吴恩达机器学习python作业之正则化逻辑回归
参考链接:
吴恩达|机器学习作业目录_学吧学吧终成学霸的博客-CSDN博客
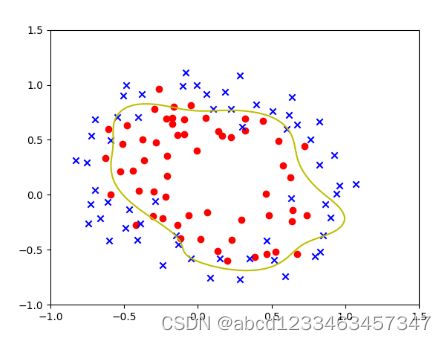
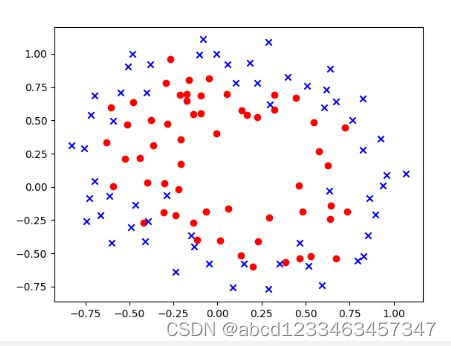 可视化数据集后发现:positive与negative之间没有线性决策边界,因此需要进行特征映射创造高阶项。
数组(array类型)合并的注意点:
numpy.AxisError: axis 1 is out of bounds for array of dimension 1_BBJG_001的博客-CSDN博客
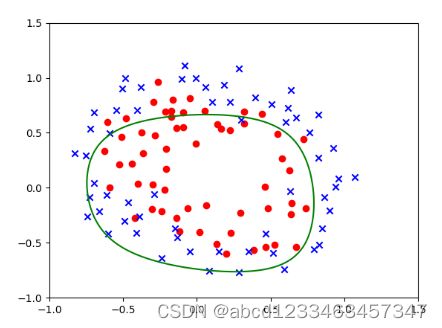
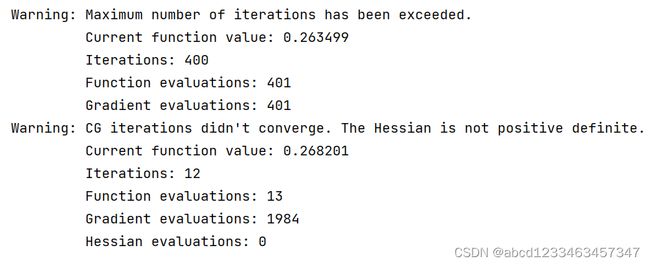
老规矩,先贴上运行结果:
有正则化项的决策边界:
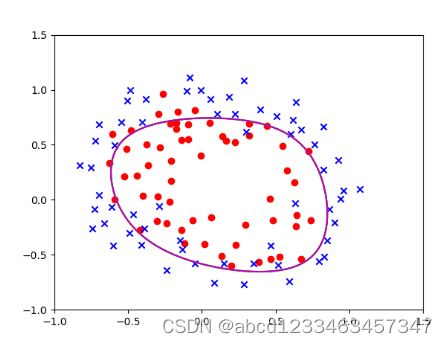
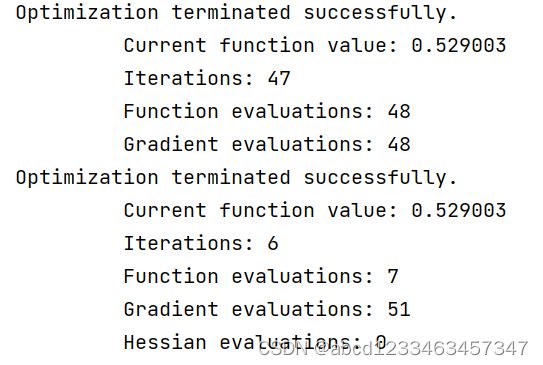
没有正则化项的决策边界:
import numpy as np
from matplotlib import pyplot as plt
from scipy import optimize as op

#1.读取数据
dt = np.loadtxt("E:\机器学习\吴恩达\data_sets\ex2data2.txt",delimiter=",")

cols = dt.shape[1]
m = dt.shape[0]
x = dt[:,0:cols-1] #(118, 2)
y = dt[:,-1] #(118,)


#2.对数据集进行可视化,分析数据集的分布
#选出被接受的芯片的下标
condition_accepted = np.where(y==1)
accepted = dt[condition_accepted]

#选出不被接受的芯片的下标
condition_unaccepted = np.where(y==0)
unaccepted = dt[condition_unaccepted]

#因为考虑的因素只有两种,所以可以进行二维可视化,被接受的用红色圆圈表示,不被接受的用蓝色x表示
plt.scatter(accepted[:,0],accepted[:,1],c="r",marker="o")
plt.scatter(unaccepted[:,0],unaccepted[:,1],c="b",marker="x")

#3.进行sigmoid函数定义,梯度计算函数定义与代价函数定义
#定义sigmoid函数
def sigmoid(z):
    return 1/(1+np.exp(-z))

#正则化前的代价函数
def costFunction(theta,x,y):
    h = sigmoid(x@theta)  # @就是矩阵乘法
    # (118,)
    first = y @ np.log(h)  # 得到一个实数
    second = (1 - y) @ np.log(1 - h)  # 得到一个实数
    result0 = -1/m*(first + second)
    return result0

#正则化后的代价函数
def costFunctionRegularzation(theta,x,y,lamda = 1):
    """
    正则化的代价函数,不需要惩罚第一项,即theta_0
    :param theta: 需要进行梯度下降的theta参数,从而能够得到最小的代价函数
    :param x: 数据集输入,特征
    :param y: 数据集输出值,结果(0,1)
    :param lamda: 正则化参数,用于平衡曲线拟合
    :return: 返回值为一个实数,表示实际的代价
    """
    #相较于ex2的逻辑回归作业,这里需要加一个正则项进行正则化regularzation
    theta0 = theta[1:] #选取第二项以后的
    reg = 1/(2*m)*np.sum(np.square(theta0))*lamda
    return costFunction(theta,x,y)+reg

#未正则化前的梯度计算函数
def gradient(theta,x,y):
    """
    计算未正则化的逻辑回归函数的梯度值
    :param theta: 需要进行梯度下降的theta参数,从而能够得到最小的代价函数
    :param x: 数据集输入,特征
    :param y: 数据集输出值,结果(0,1)
    :return: 一维数组,表示未正则化的逻辑回归函数中,theta各个维度应该下降的梯度大小
    """
    h= sigmoid(x@theta) #@就是矩阵乘法
    grad0 = 1/m*(x.T) @(h-y) #没有正则化前的梯度
    #这里要先除以m,否则防止数据过大
    return grad0 #(3,)

def gradientRegularzation(theta,x,y,lamda = 1):
    """
    计算正则化逻辑回归的梯度值
    :param theta: 需要进行梯度下降的theta参数,从而能够得到最小的代价函数
    :param x: 数据集输入,特征
    :param y: 数据集输出值,结果(0,1)
    :param lamda: 正则化参数,用于平衡曲线拟合
    :return: 一维数组,表示正则化的逻辑回归函数中,theta各个维度应该下降的梯度大小
    """
    temp = lamda / m *theta
    temp[0] = 0 #theta_0一直为0
    return gradient(theta,x,y)+temp

def mapFeature(X,Y,degree):
    """
    将数据从低维向高维映射,从而得到多项式决策边界
    :param x:特征1
    :param y:特征2
    :param degree:高维的维度值
    :return:返回值是一个数组,表示了各项的特征
    """
    result = np.ones(m)  # (118,)
    for i in range(1,degree+1):
        for j in range(0,i+1):
            temp = np.multiply(np.power(X,i-j),np.power(Y,j))
            #因为temp和result都是一维数组,也就是axis=0,不存在axis=1
            #相当于a=[1,2,3] #(3,)
            #b=[4,5,6] #(3,)
            #那么np.vstack(a,b)得到的就是:
            # [[1,2,3]
            # [4,5,6]]
            result = np.vstack((result,temp))
    result = result.T
    return result

#4.数据准备
x0 = x[:,0]
x1 = x[:,1]
x = mapFeature(x0,x1,6) #(118, 28)
cols = x.shape[1]
theta = np.zeros(cols)
#确定这些函数没有语法错误
# costFunction(theta,x,y)
# costFunctionRegularzation(theta,x,y)

#5.调用高级优化函数
#方法一 BFGS
theta1,cost1, *unused1 = op.fmin_bfgs(f=costFunctionRegularzation, fprime=gradientRegularzation, x0=theta, args=(x, y), maxiter=400, full_output=True)
#Optimization terminated successfully.
#
#方法二 牛顿共轭梯度
theta2, cost2, *unused2 = op.fmin_ncg(f=costFunctionRegularzation, fprime=gradientRegularzation, x0=theta, args=(x, y), maxiter=400, full_output=True)
#Optimization terminated successfully.
#
#方法三 L-BFGS-B
theta3, cost3, *unused3 = op.fmin_l_bfgs_b(func=costFunctionRegularzation, fprime=gradientRegularzation, x0=theta, args=(x, y), maxiter=400)


#6.画出决策边界
def plotD(theta_,co):
    u = np.linspace(-1,1.5,100)
    v = np.linspace(-1,1.5,100)
    zz = np.zeros((u.size,v.size))

    for i in range(0, u.size):
        for j in range(0, v.size):
            zz[i, j] = np.array([1, u[i],v[j], u[i]**2,u[i]*v[j],v[j]**2, u[i]**3,u[i]*u[i]*v[j],u[i]*v[j]**2,v[j]**3, u[i]**4,(u[i]**3)*v[j],u[i]*u[i]*v[j]**2,u[i]*v[j]**3,v[j]**4, u[i]**5,(u[i]**4)*v[j],(u[i]**3)*v[j]**2,u[i]*u[i]*v[j]**3,u[i]*v[j]**4,v[j]**5, u[i]**6,(u[i]**5)*v[j],(u[i]**4)*v[j]**2,u[i]*u[i]*u[i]*v[j]**3,u[i]*u[i]*v[j]**4,u[i]*v[j]**5,v[j]**6])@theta_
    plt.contour(u,v,zz,0,colors=co)
plotD(theta1,"y")
plotD(theta2,"g")
plotD(theta3,"m")
plt.show()
