大数据分析练习-第八届泰迪杯A题-基于数据挖掘的上市公司高送转预测
报告书-pdf
本实验在Anaconda环境下进行编程,使用jupyter。 具体有以下注意点:
-
文件结构 :
主文件目录 — |—— Main.ipynb 主文件 |—— ReadMe.md
|—— Moldels文件夹 模型保存
|—— OriginData文件夹 源数据和处理后数据的保存
|—— Requires文件夹 实验的具体要求
-
所用的库及版本(不一定非得按照这个版本):
名称 版本 python 3.8 jupyter 1.1.0 matplotlib 3.5.2 numpy 1.23.1 seaborn 0.11.2 pandas 1.4.3 scikit-learn 1.1.1 lightgbm 3.3.2 xgboost 1.6.2 安装命令 pip install XXX -i https://pypi.tuna.tsinghua.edu.cn/simple
-
源数据来源
-
安装LigthLGB库时可能出现Not Moudle的情况,原因是LightLGB基于C++的,可能安装在原python环境中
请参考:https://blog.csdn.net/qq_40902709/article/details/123992651
-
安装XGBoost时也可能出现4.中的错误,删除本本机python环境变量可能有效,实在不行就Goggle一下
-
为了更好的阅读体验,启动jupyter目录功能
参考:https://blog.csdn.net/weixin_43707402/article/details/126393455
-
关于调参问题:
很多模型中有n_jobs参数,该参数使用CPU全部线程,可能导致计算机卡顿。
模型调参花费大量时间,自己调参时请注意时间。
-
LightLGB中文参考文档:https://lightgbm.cn/
XGBoost参考文档:https://xgboost.readthedocs.io/en/stable/index.html(内网较慢)
下面是正文
import pandas as pd
import seaborn as sns
import numpy as np
import matplotlib.pyplot as plt
from sklearn import preprocessing
import warnings


warnings.filterwarnings('ignore')
plt.rcParams['font.sans-serif'] = ['SimHei']
plt.rcParams['axes.unicode_minus'] = False  #?来正常显示负号

model_data_save_path = "OriginData/年数据-feature-out.csv"
day_year_processed_path = "OriginData/年数据-out.csv"
1.数据预处理
1.1数据读取
# from google.colab import drive
# drive.mount('/content/drive')
#读取基础数据
data_basic = pd.read_csv('OriginData/基础数据.csv', encoding='GBK')
#读取年数据
data_year = pd.read_csv('OriginData/年数据.csv', encoding='GBK')
# data_year = pd.read_csv('OriginData/年数据.csv', encoding='GBK', nrows=2000)

# 读取日数据
data_day = pd.read_csv('OriginData/日数据.csv', encoding='GBK')
# data_day = pd.read_csv('OriginData/日数据.csv', encoding='GBK', nrows=10000)
1.2 数据基本信息
data_year.head(1)
| 股票编号 | 年份(年末) | 固定资产合计 | 无息流动负债 | 无息非流动负债 | 带息流动负债 | 带息债务 | 净债务 | 有形净资产 | 营运资本 | ... | 现金及现金等价物净增加额 | 加:期初现金及现金等价物余额 | 现金及现金等价物净增加额的特殊项目 | 现金及现金等价物净增加额的调整金额 | 期末现金及现金等价物余额 | 高转送预案公告日 | 高转送股权登记日 | 高转送除权日 | 每股送转 | 是否高转送 | |
|---|---|---|---|---|---|---|---|---|---|---|---|---|---|---|---|---|---|---|---|---|---|
| 0 | 1 | 1 | 86912289.26 | 1.422495e+09 | 160019158.3 | 819855100.3 | 827188433.6 | 357874692.1 | 892930787.2 | 590497018.1 | ... | -76152852.96 | 545466594.5 | NaN | NaN | 469313741.6 | 3月30日 | NaN | NaN | NaN | 0 |
1 rows × 362 columns
# print("数据的确实比例")
# # temp = ((data_day.isnull().sum()) / data_day.shape[0]).sort_values(ascending=False).map(lambda x: "{:.2%}".format(x))
# print("数据的缺失比例")
# temp = ((data_basic.isnull().sum()) / data_basic.shape[0]).sort_values(ascending=False).map(lambda x: "{:.2%}".format(x))
print("数据的缺失比例")
temp = ((data_year.isnull().sum()) / data_year.shape[0]).sort_values(ascending=False).map(lambda x: "{:.2%}".format(x))
pd.DataFrame(temp, columns=["缺失率"])
pd.set_option('display.width', 10)  # 设置字符显示宽度
pd.set_option('display.max_rows', None)  # 设置显示最大
1.3 特征的处理
# 对基础数据中的的所属行业特征编码
# 参考:https://blog.csdn.net/hhhhhhhhhhwwwwwwwwww/article/details/115856585
le = preprocessing.LabelEncoder()
le.fit(data_basic['所属行业'].values)
data_basic['所属行业id'] = le.transform(data_basic['所属行业'].values)
# 生成新特征
data_basic["所属概念板块_n"] = data_basic["所属概念板块"].apply(lambda x: len(x.split(";")) if x is not np.nan else 0)
data_basic["是否为国企"] = data_basic["所属概念板块"].apply(lambda x: 1 if (x is not np.nan) and "国企" in x else 0)
data_basic["是否为下盘"] = data_basic["所属概念板块"].apply(lambda x: 1 if (x is not np.nan) and "小盘" in x else 0)
# 删除一些不必要变量
data_basic.drop(columns=["所属行业", "所属概念板块"], inplace=True)
data_basic
| 股票编号 | 上市年限 | 所属行业id | 所属概念板块_n | 是否为国企 | 是否为下盘 | |
|---|---|---|---|---|---|---|
| 0 | 1 | 26 | 7 | 10 | 1 | 1 |
| 1 | 2 | 1 | 4 | 5 | 0 | 0 |
| 2 | 3 | 17 | 4 | 5 | 0 | 0 |
| 3 | 4 | 22 | 8 | 2 | 1 | 0 |
| 4 | 5 | 1 | 4 | 1 | 0 | 0 |
| ... | ... | ... | ... | ... | ... | ... |
| 3461 | 3462 | 18 | 4 | 1 | 0 | 0 |
| 3462 | 3463 | 7 | 4 | 2 | 0 | 1 |
| 3463 | 3464 | 19 | 4 | 7 | 1 | 0 |
| 3464 | 3465 | 11 | 17 | 17 | 0 | 0 |
| 3465 | 3466 | 4 | 4 | 2 | 0 | 0 |
3466 rows × 6 columns
# 利用groupBy函数生成每一年的特征的异常系数
# 异常系数:https://baike.baidu.com/item/%E5%8F%98%E5%BC%82%E7%B3%BB%E6%95%B0/6463621?fr=aladdin
data_temp = data_day.groupby(["股票编号", "年"])
data  =(data_temp.std())/data_temp.mean()
data.reset_index(inplace=True)
data = data.iloc[:, 0:9]
data.rename(columns={'年':'年份(年末)', "开盘价":"开盘价-异常系数",
                     "最高价":"最高价-异常系数", "最低价":"最低价-异常系数",
                     "收盘价":"收盘价-异常系数", "成交量":"成交量-异常系数"},inplace=True)
data.drop(columns=["月", "日"], inplace=True)
data.head(5)
| 股票编号 | 年份(年末) | 开盘价-异常系数 | 最高价-异常系数 | 最低价-异常系数 | 收盘价-异常系数 | 成交量-异常系数 | |
|---|---|---|---|---|---|---|---|
| 0 | 1 | 1 | 0.202121 | 0.207503 | 0.200785 | 0.204572 | 0.826434 |
| 1 | 1 | 2 | 0.121020 | 0.122397 | 0.117884 | 0.120320 | 0.948339 |
| 2 | 1 | 3 | 0.094508 | 0.096999 | 0.094107 | 0.095576 | 0.727320 |
| 3 | 1 | 4 | 0.138225 | 0.144623 | 0.133310 | 0.139903 | 0.993973 |
| 4 | 1 | 5 | 0.238421 | 0.241245 | 0.232125 | 0.237291 | 0.616736 |
# 将生成的的数据按照 股票编号和年份 与 年数据进行内连接
data_year = data_year.merge(data_basic, on=["股票编号"], how="left")
data_year = data_year.merge(data, on=["股票编号", "年份(年末)"], how="left")
data_year.head(5)
| 股票编号 | 年份(年末) | 固定资产合计 | 无息流动负债 | 无息非流动负债 | 带息流动负债 | 带息债务 | 净债务 | 有形净资产 | 营运资本 | ... | 上市年限 | 所属行业id | 所属概念板块_n | 是否为国企 | 是否为下盘 | 开盘价-异常系数 | 最高价-异常系数 | 最低价-异常系数 | 收盘价-异常系数 | 成交量-异常系数 | |
|---|---|---|---|---|---|---|---|---|---|---|---|---|---|---|---|---|---|---|---|---|---|
| 0 | 1 | 1 | 86912289.26 | 1.422495e+09 | 160019158.3 | 819855100.3 | 827188433.6 | 357874692.1 | 8.929308e+08 | 5.904970e+08 | ... | 26 | 7 | 10 | 1 | 1 | 0.202121 | 0.207503 | 0.200785 | 0.204572 | 0.826434 |
| 1 | 1 | 2 | 78878168.21 | 1.903724e+09 | 148736391.3 | 374909888.3 | 394226555.0 | -403497756.4 | 1.190906e+09 | 9.114353e+08 | ... | 26 | 7 | 10 | 1 | 1 | 0.121020 | 0.122397 | 0.117884 | 0.120320 | 0.948339 |
| 2 | 1 | 3 | 75301015.72 | 1.447218e+09 | 141831622.4 | 364316666.6 | 480560018.6 | -496611795.6 | 1.501162e+09 | 1.333070e+09 | ... | 26 | 7 | 10 | 1 | 1 | 0.094508 | 0.096999 | 0.094107 | 0.095576 | 0.727320 |
| 3 | 1 | 4 | 64069233.96 | 1.388840e+09 | 136730134.5 | 105000000.0 | 282613352.0 | -526350024.7 | 1.755344e+09 | 1.697810e+09 | ... | 26 | 7 | 10 | 1 | 1 | 0.138225 | 0.144623 | 0.133310 | 0.139903 | 0.993973 |
| 4 | 1 | 5 | 85929516.37 | 1.870206e+09 | 134704875.2 | 129243352.0 | 274083358.8 | -671656616.9 | 1.764907e+09 | 1.665822e+09 | ... | 26 | 7 | 10 | 1 | 1 | 0.238421 | 0.241245 | 0.232125 | 0.237291 | 0.616736 |
5 rows × 372 columns
# 观察 data_year中含有一些object特征,将日期提取出来月
data_year_copy = data_year.copy()
names = []
for name in data_year_copy.columns:
    if data_year_copy[name].dtype == object:
        names.append(name)
data_year_copy["高转送预案公告月"] = data_year_copy["高转送预案公告日"].apply(lambda x: x if pd.isnull(x) else int((x.split("月")[0])))
data_year_copy["高转送股权登记月"] = data_year_copy["高转送股权登记日"].apply(lambda x: x if pd.isnull(x) else int((x.split("月")[0])))
data_year_copy["高转送除权月"] = data_year_copy["高转送除权日"].apply(lambda x: x if pd.isnull(x) else int((x.split("月")[0])))

# 删除一些无意义的特征, 即只有一类的特征
for name in data_year_copy.columns:
    if len(data_year_copy[name].value_counts(normalize=True)) == 1:
        if name not in names:
            names.append(name)
            print(name)
data_year_copy = data_year_copy.drop(labels=names, axis=1)
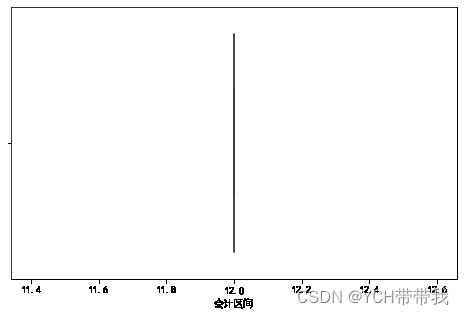
会计区间
合并标志,1-合并,2-母公司
预提费用
所有者权益(或股东权益)特殊项目
负债和所有者权益(或股东权益)特殊项目
# seaborn 画出一个有异常值的特征分布
fig, ax = plt.subplots(figsize=(8,5))
# sns.set_theme(style="whitegrid")
ax = sns.boxplot(x="会计区间",data=data_year)
1.4数据异常值处理
1.4.1正态分布检验以及异常值处理3σ原则
# 参考: https://blog.csdn.net/u013421629/article/details/103870567
import numpy as np
import pandas as pd
from scipy.stats import kstest

# 判断是否为正态分布
def KsNormDetect(df, column_name):
    # 计算均值
    u = df[column_name].mean()
    # 计算标准差
    std = df[column_name].std()
    res = kstest(df[column_name][df[column_name].notnull()], 'norm', (u, std))[1]
    if res <= 0.05:
        return 1
    else:
        return 0


def OutlierDetection(df, column_name, ks_res):
    # 计算均值
    u = df[column_name].mean()
    # 计算标准差
    std = df[column_name].std()
    # print(u, std)
    if ks_res == 0:
        print(column_name, "不服从正态分布")
        return
    for row in range(len(df)):
        if df[column_name][row] is np.nan:
            continue
        else:
            if np.abs(df[column_name][row] - u) > 3 * std:
#                 print(column_name)
                df.loc[row, column_name] = np.nan
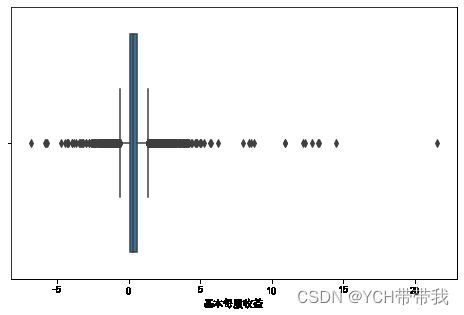
# seaborn 画出一个有异常值的特征分布
fig, ax = plt.subplots(figsize=(8,5))
# sns.set_theme(style="whitegrid")
ax = sns.boxplot(x="基本每股收益",data=data_year_copy)
for column_name in data_year_copy.columns:
    if len(list(data_year_copy[column_name].value_counts())) < len(data_year_copy) * 0.05:
        continue
    ks_res = KsNormDetect(data_year_copy, column_name)
    OutlierDetection(data_year_copy, column_name, ks_res)
data_year_copy.shape
(24262, 365)
# seaborn 画出一个有异常值的特征分布
fig, ax = plt.subplots(figsize=(8,5))
# sns.set_theme(style="whitegrid")
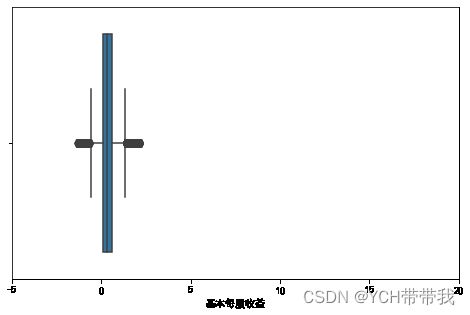
ax = sns.boxplot(x="基本每股收益",data=data_year_copy)
ax.set(xlim=(-5, 20))
[(-5.0, 20.0)]
1.5数据填充
# 参考:https://blog.csdn.net/jingyi130705008/article/details/82670011
1.5.1缺失数据较多的删除
## 删除缺失值较大的特征
f_not_null = (data_year_copy.notnull().sum() /
              data_year_copy.shape[0]).sort_values(ascending=True).to_dict()
# f_not_null
for name in data_year_copy.columns:
    if f_not_null[name] < 0.75:
        data_year_copy = data_year_copy.drop(labels=name, axis=1)
f_not_null = (data_year_copy.notnull().sum() /
              data_year_copy.shape[0]).sort_values(ascending=True).to_dict()
f_not_null
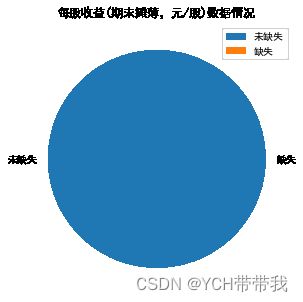
# seaborn 绘制一个特征缺失值的情况
fig, ax = plt.subplots(figsize=(8,5))
plt.pie(x=[f_not_null["每股收益(期末摊薄,元/股)"], 1 - f_not_null["每股收益(期末摊薄,元/股)"]],
                     labels = ["未缺失", "缺失"])
plt.title("每股收益(期末摊薄,元/股)数据情况")
plt.legend()
plt.show()
1.5.2中位数、众数填充
# 按变量缺失程度进行分类
f_not_null = (data_year_copy.notnull().sum() /
              data_year_copy.shape[0]).sort_values(ascending=True).to_dict()
fill_names_year = [[], [], []]
for name in data_year_copy.columns:
    # 缺失值较多,且是数值类型,随机森林填充
    if f_not_null[name] < 0.9:
        fill_names_year[0].append(name)
    else:
        fill_names_year[1].append(name)
# 对缺失数据较少的类别特征进行众数替换
for name in fill_names_year[1]:
    if len(list(data_year_copy[name].value_counts())) < 100:
        data_year_copy[name].fillna(data_year_copy[name].mode()[0]
                                    , inplace=True)
    else:
        data_year_copy[name].fillna(data_year_copy[name].median()
                                    , inplace=True)
1.5.3决策树填充
# 参考:https://blog.csdn.net/ZackSock/article/details/122200619
from sklearn.impute import SimpleImputer
from sklearn.ensemble import RandomForestRegressor


def RandomForeFill(data):
    #用随机森林预测填补缺失值
    X_missing_reg = data.copy()
    #特征缺失值累计,按索引升序排序
    sortindex = np.argsort(X_missing_reg.isnull().sum(axis=0)).values
    #循环,按缺失值累计升序,依次填补不同特征的缺失值
    for i in sortindex:
        #构建我们的新特征矩阵和新标签
        #含缺失值的总数据集
        df = X_missing_reg
        #要填充特征作为新标签列
        fillc = df.iloc[:, i]
        #新的特征矩阵=其余特征列+原来的标签列Y
        df = df.iloc[:, df.columns != i]
        #在新特征矩阵中,对含有缺失值的列,进行0的填补
        df_0 = SimpleImputer(missing_values=np.nan, strategy='constant',
                             fill_value=0).fit_transform(df)
        #找出我们的训练集和测试集
        Ytrain = fillc[fillc.notnull()]
        Ytest = fillc[fillc.isnull()]
        Xtrain = df_0[Ytrain.index, :]
        Xtest = df_0[Ytest.index, :]
        # 有一些不需要填充
        if len(Ytest) == 0:
            continue
        if(len(Xtrain)) == 0:
            print(data.columns[i])
        #用随机森林回归预测缺失值
        rfc = RandomForestRegressor(n_estimators=10, n_jobs=-1)
        rfc = rfc.fit(Xtrain, Ytrain)
        Ypredict = rfc.predict(Xtest)
        #填入预测值
        X_missing_reg.iloc[X_missing_reg.iloc[:, i].isnull(), i] = Ypredict
    return X_missing_reg
data_year_copy = RandomForeFill(data_year_copy)
# data_day_copy = RandomForeFill(data_day_copy)
# seaborn 绘制一个特征缺失值的情况
f_not_null_after = (data_year_copy.notnull().sum() /
              data_year_copy.shape[0]).sort_values(ascending=True).to_dict()
f_not_null_after
fig, ax = plt.subplots(figsize=(8,5))
plt.pie(x=[f_not_null_after["每股收益(期末摊薄,元/股)"], 1 - f_not_null_after["每股收益(期末摊薄,元/股)"]],
                     labels = ["未缺失", "缺失"])
plt.legend()
plt.title("每股收益(期末摊薄,元/股)数据情况")
plt.show()
# 生成新的特征变量 总股本  送股能力
data_year_copy["总股本"] = data_year_copy["未分配利润"] / data_year_copy["每股未分配利润(元/股)"]
data_year_copy["送股能力"] = data_year_copy["负债合计"] / data_year_copy["资产总计"]
# 保存数据
data_year_copy.to_csv(day_year_processed_path)
((data_year_copy.isnull().sum()) / data_year_copy.shape[0]).sort_values(ascending=False).map(lambda x: "{:.2%}".format(x))
股票编号           0.00%
货币资金/总资产(%)    0.00%
预付账款/总资产(%)    0.00%
存货/总资产(%)      0.00%
流动资产/总资产(%)    0.00%
               ...
速动必率           0.00%
保守速动必率         0.00%
营业利润/流动负债      0.00%
营业利润/负债合计      0.00%
送股能力           0.00%
Length: 229, dtype: object
1.6特征选择 Filter(过滤法)
# 参考 https://blog.csdn.net/jingyi130705008/article/details/82670011
data_year = pd.read_csv(day_year_processed_path, index_col=0)
# 设置基本要包含的特征个数
feature_number = 30
feature_name = []
# data_year
1.6.1互信息法
from sklearn.feature_selection import SelectKBest
from sklearn.feature_selection import mutual_info_classif

m = SelectKBest(mutual_info_classif, k=feature_number)
mm = m.fit_transform(data_year, data_year['是否高转送'])
feature_choose = m.get_support()
for i in range(len(data_year.columns)):
    if feature_choose[i]:
        feature_name.append(data_year.columns[i])
feature_name
1.6.2方差选择法
## 未使用 原因:各种数据的数量级不一定相同

# from sklearn.feature_selection import VarianceThreshold
#   # 方差选择法,返回值为特征选择后的数据
#   # 参数threshold为方差的阈值
# v = VarianceThreshold(threshold=10)  # 指定方差大于30
# vv = v.fit_transform(data_year) # 拟合选取特征
# vv.shape,v.get_support(),vv  # 维度 是否为选取的特征  提取后的数据
# feature_choose = v.get_support()
# for i in range(len(data_year.columns)):
#     if feature_choose[i]:
#         feature_name.append(data_year.columns[i])
# feature_name
1.6.3相关系数法
import pandas as pd
import matplotlib.pyplot as plt
import seaborn as sns
#线性相关
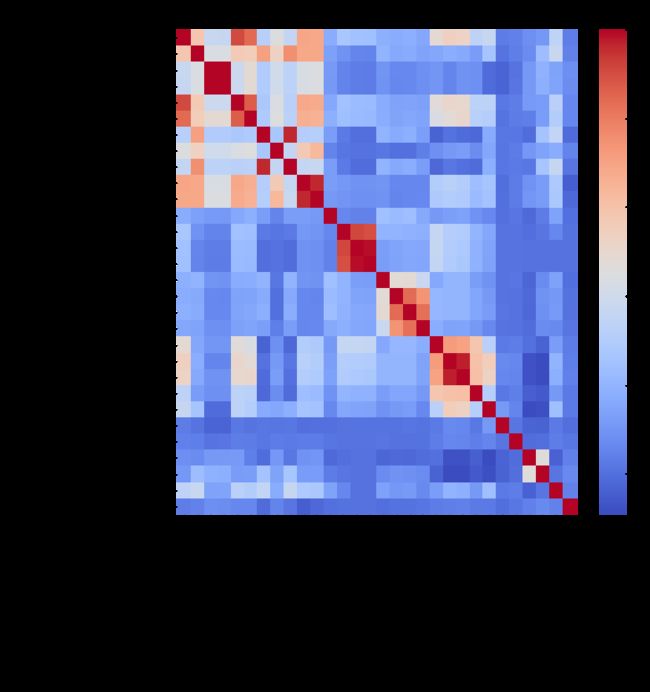
pears = data_year.corr(method='pearson', min_periods=1)  # 相关系数
temp = list((abs(pears.loc["是否高转送"])).sort_values(ascending=False).index)
for i in range(10):
    if temp[i] not in feature_name:
        feature_name.append(temp[i])
pears = data_year[feature_name].corr(method='pearson', min_periods=1)  # 相关系数
plt.figure(figsize=(10,10))
plt.title("pearson_线性相关",fontsize=25)
sns.heatmap(pears,cmap='coolwarm') # 相关系数热力图
#非线性相关
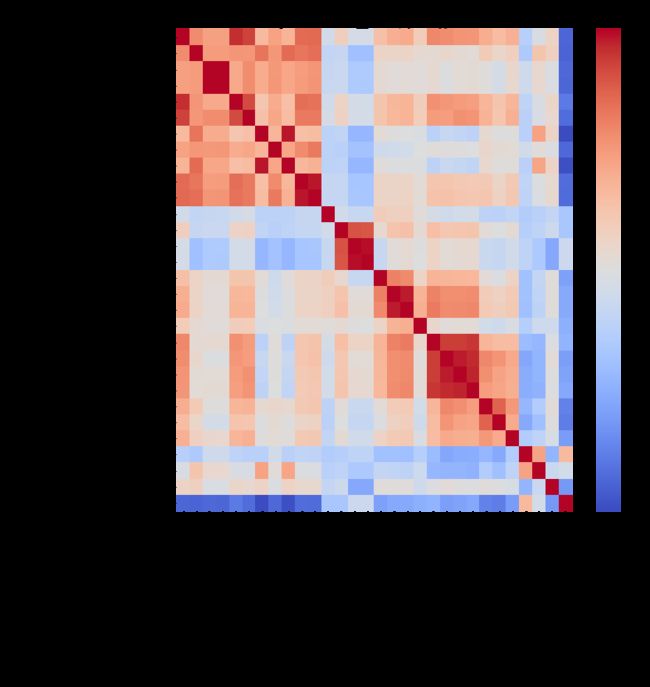
pears = data_year.corr(method='spearman', min_periods=1)  # 相关系数
temp = list((abs(pears.loc["是否高转送"])).sort_values(ascending=False).index)
for i in range(10):
    if temp[i] not in feature_name:
        feature_name.append(temp[i])
pears = data_year[feature_name].corr(method='spearman', min_periods=1)  # 相关系数
plt.figure(figsize=(10,10))
plt.title("spearman_非线性相关",fontsize=25)
sns.heatmap(pears,cmap='coolwarm') # 相关系数热力图
print("所选特征数: ", len(feature_name))
所选特征数: 40
1.7数据保存
feature_name.append("年份(年末)")
data_year[feature_name].to_csv(model_data_save_path)
data_year = data_year[feature_name]
2.嵌入法选择特征(模型)
2.1 训练数据的预处理
from sklearn import metrics
from sklearn.model_selection import train_test_split
from sklearn.preprocessing import StandardScaler
from sklearn.preprocessing import MinMaxScaler
import joblib

import pandas as pd
import matplotlib.pyplot as plt
import seaborn as sns
import math
import sklearn
%matplotlib inline
import numpy as np
import warnings

warnings.filterwarnings('ignore')
plt.rcParams['font.sans-serif'] = ['SimHei']
plt.rcParams['axes.unicode_minus'] = False  #⽤来正常显示负号
# from google.colab import drive
# drive.mount('/content/drive')
#读取年数据
data = pd.read_csv(model_data_save_path, index_col=0)
# data = data_year

Y_pd = data["是否高转送"]
X_pd = data.drop(columns=["是否高转送"], axis=1).copy()
# X_pd = X_pd.drop(columns=["股票编号"], axis=1).copy()

if "年份(年末)" in X_pd.columns:
    X_pd = X_pd.drop(columns=["年份(年末)"], axis=1)

X_shape = X_pd.shape

X = X_pd.to_numpy()
mm = MinMaxScaler()
X = mm.fit_transform(X)
scaler = StandardScaler()
X = scaler.fit_transform(X)

y = Y_pd.to_numpy()
X_train, X_test, y_train, y_test = train_test_split(X, y, random_state=0, test_size=0.3)
X_train.shape, X_test.shape, y_train.shape, y_test.shape
((16983, 39), (7279, 39), (16983,), (7279,))
trian_size = int(X_train.shape[0]/3)
test_size = int(X_test.shape[0]/3)
trian_size
5661
2.2 Lightgbm 模型
# !pip install lightgbm -i https://pypi.tuna.tsinghua.edu.cn/simple
# # 关于安装的问题 Lightgbm 基于C++ pip 安装可能存在到 本机的python环境中
# # 建议参考:https://blog.csdn.net/qq_40902709/article/details/123992651(删除环境变量也行)
import lightgbm as lgb
from sklearn.model_selection import GridSearchCV
2.2.1 Lightgbm 调参
### 数据转换
lgb_train = lgb.Dataset(X_train, y_train, free_raw_data=False, feature_name=list(X_pd.columns))
lgb_eval = lgb.Dataset(X_test,
                       y_test,
                       reference=lgb_train,
                       free_raw_data=False)
lgb_train2 = lgb.Dataset(X_train[0*trian_size:trian_size*1], y_train[0*trian_size:trian_size*1], free_raw_data=False, feature_name=list(X_pd.columns))
lgb_eval2 = lgb.Dataset(X_test[0*test_size:test_size*1],
                       y_test[0*test_size:test_size*1],
                       reference=lgb_train,
                       free_raw_data=False)
# # 这一块计算量大,容易卡死
# # 参考:https://zhuanlan.zhihu.com/p/372206991
# #     https://lightgbm.readthedocs.io/en/v3.3.2/Parameters.html -含有具体参数的意义

lgb_parameters = {
    'max_depth': range(10, 101, 10),
    'learning_rate': [1e-4, 1e-3, 1e-2, 0.1, 0.2, 0.5],
    'feature_fraction': [0.6, 0.7, 0.9, 0.95],
    'bagging_fraction': [0.6, 0.7, 0.9, 0.95],
    'lambda_l1': [1e-4, 1e-3, 0.1, 0.4, 0.6],
    'lambda_l2': [0.1, 1, 1.5, 3, 5],
    'num_leaves': range(10, 50, 5),
    "min_data_in_leaf":[1, 16, 31, 46, 61, 76, 91],
    "max_bin":range(50,255,20),
    "n_estimators":[450,500,550,600,650,700,750]
}
gbm = lgb.LGBMClassifier(boosting_type='gbdt',
                         objective='binary',
                         metric='auc',
                         verbose=-1,
                         learning_rate=0.001,
                         num_leaves=30,
                         feature_fraction=0.8,
                         bagging_fraction=0.9,
                         lambda_l1=0.2,
                         lambda_l2=0,
                         n_jobs=-1,
                         seed=0,
                         )
# 训练取消注释
# lgb_gsearch = GridSearchCV(gbm, param_grid=lgb_parameters, scoring='auc', cv=3, verbose=0)
# lgb_gsearch.fit(X_train, y_train)
# print("Best score: %0.3f" % lgb_gsearch.best_score_)
# print("Best parameters set:")
# best_parameters = lgb_gsearch.best_estimator_.get_params()
# for param_name in sorted(lgb_parameters.keys()):
#     print("\t%s: %r" % (param_name, best_parameters[param_name]))
2.2.2 LightGBM 模型预测
# # 调好的参数,又手调了一下

lgb_params = {
    'boosting_type': 'gbdt',
#     'objective': 'binary',
    "objective":'cross_entropy',
    'num_leaves': 30,
    'metric': 'binary_logloss',
#     'metric': 'auc',
    'max_depth':20,
    'learning_rate': 0.01,
    'feature_fraction': 0.8,
    'bagging_fraction': 0.8,
    "min_data_in_leaf":61,
    "max_bin":195,
    "lambda_l1":1e-4,
    "lambda_l2":0.1,
    "n_estimators":650,
    "verbose":-1
}
evals_result = {}  # 记录训练结果所用
lgb_model = lgb.train(lgb_params,
                lgb_train,
                num_boost_round=600,
                valid_sets=[lgb_train, lgb_eval],
                evals_result=evals_result,
                verbose_eval=-1
                )

#模型保存
lgb_train_pre = lgb_model.predict(X_train)
lgb_pre = lgb_model.predict(X_test)
lgb_model2 = lgb.train(lgb_params,
                lgb_train,
                num_boost_round=600,
                valid_sets=[lgb_train, lgb_eval],
                evals_result=evals_result,
                verbose_eval=-1
                )
joblib.dump(lgb_model2,"Models/lgb_model.dat")
['Models/lgb_model.dat']
2.3 Xgboost 模型
2.3.1 Xgboost 调参
from sklearn.model_selection import GridSearchCV
from sklearn import metrics
# !pip install xgboost -i https: // pypi.tuna.tsinghua.edu.cn / simple
# # 关于安装的问题 Xgboost 基于C++ pip 安装可能不太行,建议删除本机的环境变量,自己打一下import xgboost
import xgboost as xgb
import pandas as pd

xgb_train = xgb.DMatrix(X_train, y_train, feature_names=list(X_pd.columns))
xgb_eval = xgb.DMatrix(X_test,y_test, feature_names=list(X_pd.columns))
xgb_train2 = xgb.DMatrix(X_train[1*trian_size:trian_size*2], y_train[1*trian_size:trian_size*2], feature_names=list(X_pd.columns))
xgb_eval2 = xgb.DMatrix(X_test[1*test_size:test_size*2],y_test[1*test_size:test_size*2], feature_names=list(X_pd.columns))
# # 这一块计算量大,容易卡死
# # 参考:https://juejin.cn/post/6844903661013827598
# #      https://xgboost.readthedocs.io/en/stable/parameter.html -含有具体参数的意义

xgb_parameters = {
    'max_depth': [i for i in range(6, 20, 2)],
    'learning_rate': [1e-5, 1e-4, 1e-3, 1e-2, 0.1, 0.2, 0.5],
    'min_child_weight': [0, 2, 5, 8, 15],
    'subsample': [0.6, 0.7, 0.8, 0.85, 0.95],
    'colsample_bytree': [0.5, 0.6, 0.7, 0.8, 0.9],
    'reg_alpha': [1e-5, 1e-2, 0.1, 0.4, 0.6, 0.8],
    'reg_lambda': [0.01, 0.1, 0.2, 0.8, 1],
    "predictor": ["gpu_predictor"],
    "n_estinators":[i for i in range(600, 800, 20)]
}
xlf = xgb.XGBClassifier(
                        max_depth=30,
                        learning_rate=0.01,
                        n_estimators=200,
                        silent=True,
                        objective='binary:logistic',
                        nthread=-1,
                        gamma=0,
                        min_child_weight=1,
                        max_delta_step=0,
                        subsample=0.85,
                        colsample_bytree=0.7,
                        colsample_bylevel=1,
                        reg_alpha=0,
                        reg_lambda=1,
                        scale_pos_weight=1,
                        seed=0,
                        missing=None,
)
# xgb_gsearch = GridSearchCV(xlf, param_grid=xgb_parameters, scoring='neg_log_loss', cv=3, verbose=0, n_jobs=-1)
# xgb_gsearch.fit(X_train, y_train)
# print("Best score: %0.3f" % xgb_gsearch.best_score_)
# print("Best parameters set:")
# best_parameters = xgb_gsearch.best_estimator_.get_params()
# for param_name in sorted(xgb_parameters.keys()):
#     print("\t%s: %r" % (param_name, best_parameters[param_name]))
2.3.2 Xgboost 模型预测
xgb_params={
#     "objective":"binary:hinge",
    "objective":"binary:logistic",
    "n_estinators:":500,
    "min_child_weight":8,
    "gamma" : 0.7,
    "learning_rate":0.01,
    "subsample":0.8,
    "colsample_bytree":0.8,
    "reg_alpha": 1e-5,
    "reg_lambda":0.01,
    "max_depth":12,
    'seed': 0,
    "verbosity":0,
    'metric':['auc', "logloss"],
}
xgb_evals_result = {}
xgb_model = xgb.train(
    xgb_params,xgb_train,
    evals=[(xgb_train, 'dtrain'), (xgb_eval, 'dtest')],
    num_boost_round=600, evals_result=xgb_evals_result
)
xgb_train_pre = xgb_model.predict(xgb_train)
xgb_pre = xgb_model.predict(xgb_eval)
#模型保存
xgb_model2 = xgb.train(xgb_params,xgb_train2,evals=[(xgb_train2, 'dtrain'), (xgb_eval2, 'dtest')], num_boost_round=600, evals_result=xgb_evals_result)
joblib.dump(xgb_model2,"Models/xgb_model.dat")
2.4 SVM 模型
from sklearn.model_selection import GridSearchCV
from sklearn.metrics import classification_report
from sklearn.metrics import plot_roc_curve
from sklearn.svm import SVC
import numpy as np
2.4.1 SVM 调参
# 调参慢,训练时取消注释
# SVM_params = [{'kernel': ['rbf'], 'C': list(np.linspace(0.2,20,5))},
#               {'kernel': ['linear'], 'C': list(np.linspace(0.2,20,5))}]
# svm_model = GridSearchCV(SVC(), SVM_params, cv=3,
#                        scoring="roc_auc", n_jobs=-1)
# svm_model.fit(X_train, y_train)
# print(svm_model.best_params_)
2.4.2 SVM 模型预测
svc_model = SVC(kernel="rbf", C=12, probability=True)
svc_model.fit(X_train, y_train)
svc_train_pre = svc_model.predict_proba(X_train)[:, 1]
svc_pre = svc_model.predict_proba(X_test)[:, 1]
# #模型保存
# svc_model2 = SVC(kernel="rbf", C=12, probability=True)
# svc_model2.fit(X_train[0*trian_size:4*trian_size], y_train[2*trian_size:3*trian_size])
# joblib.dump(svc_model2,"Models/svc_model.dat")
2.5 模型评价
# # 参考 https://lightgbm.readthedocs.io/en/v3.3.2/Python-API.html
evals_result
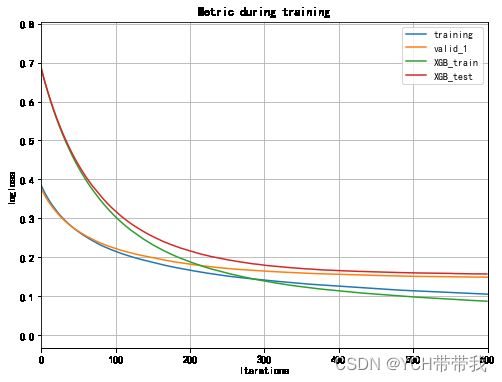
2.5.2 log_loss 曲线
if "training" in xgb_evals_result:
    evals_result["LGB_train"] = evals_result.pop("training")
if "valid_1" in xgb_evals_result:
    evals_result["LGB_test"] = evals_result.pop("valid_1")
if "dtrain" in xgb_evals_result:
    xgb_evals_result["XGB_train"] = xgb_evals_result.pop("dtrain")
if "dtest" in xgb_evals_result:
    xgb_evals_result["XGB_test"] = xgb_evals_result.pop("dtest")
fig, ax = plt.subplots(figsize=(8,6))
ax = lgb.plot_metric(evals_result, metric='binary_logloss', ax=ax)
ax = lgb.plot_metric(xgb_evals_result, metric='logloss',ax= ax)
plt.show()
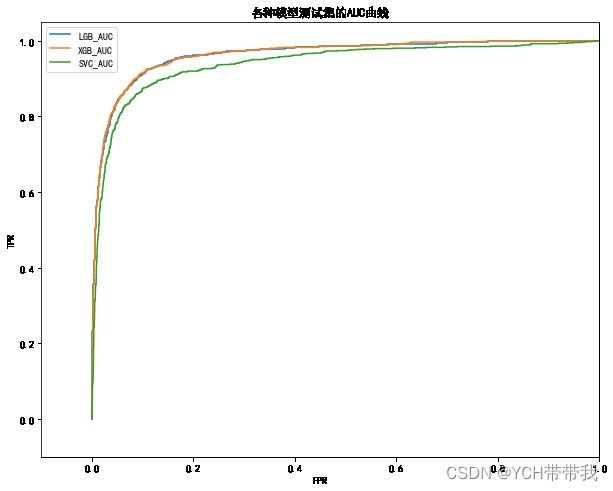
2.5.3 auc 曲线
def get_fptr_tpr(y_test, y_pre):
    fpr, tpr, thresholds = metrics.roc_curve(y_test, y_pre)
    AUC = metrics.auc(fpr, tpr)
    return fpr, tpr, AUC

fig, ax = plt.subplots(figsize=(10,8))
plt.xlim([0-.1, 1.0])
plt.ylim([-0.1, 1.05])
plt.title("各种模型测试集的AUC曲线")
fpr, tpr, AUC = get_fptr_tpr(y_test, lgb_pre)
plt.plot(fpr,tpr, label="LGB_AUC")
fpr, tpr, AUC = get_fptr_tpr(y_test, xgb_pre)
plt.plot(fpr,tpr, label="XGB_AUC")
fpr, tpr, AUC = get_fptr_tpr(y_test, svc_pre)
plt.plot(fpr,tpr, label="SVC_AUC")
plt.xlabel("FPR")
plt.ylabel("TPR")
plt.legend()
2.6 特征选择
# 创建两个子图 -- 图3
plt.rcParams['font.sans-serif']=['SimHei']
plt.rcParams['axes.unicode_minus'] = False
plt.rcParams['figure.autolayout'] = False
fig, ax = plt.subplots(figsize=(11,7))
lgb.plot_importance(lgb_model, max_num_features=20, title="LGB特征权重(前20)", ax=ax)
# max_features表示最多展示出前10个重要性特征,可以自行设置
plt.show()
fig, ax = plt.subplots(figsize=(11,7))
xgb.plot_importance(xgb_model, max_num_features=20,  title="XGB特征权重(前20)", ax=ax)
plt.show()
xgb_feature_importance             = pd.DataFrame()
xgb_feature_importance['xgb_fea_name'] = X_pd.columns
xgb_feature_importance['xgb_fea_imp']  = xgb_model.get_fscore().values()
xgb_feature_importance             = xgb_feature_importance.sort_values('xgb_fea_imp',ascending = False)
lgb_feature_importance             = pd.DataFrame()
lgb_feature_importance['lgb_fea_name'] = X_pd.columns
lgb_feature_importance['lgb_fea_imp']  = lgb_model.feature_importance()
lgb_feature_importance             = lgb_feature_importance.sort_values('lgb_fea_imp',ascending = False)
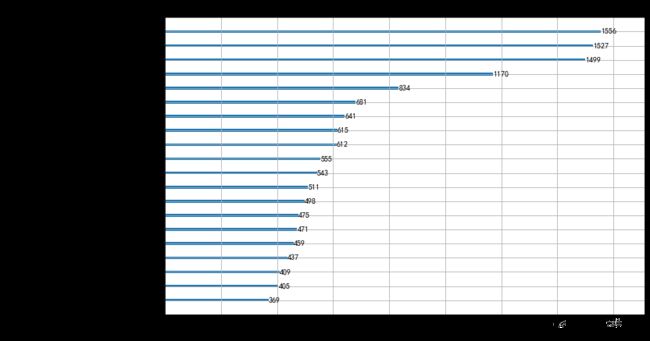
lgb_feature_importance.head(20)
| lgb_fea_name | lgb_fea_imp | |
|---|---|---|
| 2 | 稀释每股收益 | 1556 |
| 15 | 归属于母公司净利润同必增长(%) | 1527 |
| 16 | 基本每股收益同必增长(%) | 1499 |
| 1 | 每股收益(期末摊薄,元/股) | 1170 |
| 17 | 稀释每股收益同必增长(%) | 834 |
| 3 | 每股净资产(元/股) | 681 |
| 37 | 实收资本(或股本) | 641 |
| 21 | 每股净资产相对年初增长(%) | 615 |
| 14 | 营业总额同必增长(%) | 612 |
| 23 | 净资产收益率(扣除加权平均,%) | 555 |
| 38 | 资本公积 | 543 |
| 6 | 每股营业利润(元/股) | 511 |
| 11 | 每股未分配利润(元/股) | 498 |
| 0 | 股票编号 | 475 |
| 9 | 每股盈余公积(元/股) | 471 |
| 20 | 归属于母公司的股东权益相对年初增长(%) | 459 |
| 8 | 每股资本公积(元/股) | 437 |
| 13 | 每股现金流量净额(元/股) | 409 |
| 10 | 每股公积金(元/股) | 405 |
| 22 | 净资产收益率(平均,%) | 369 |
# fig, ax = plt.subplots(figsize=(16,9))
# plt.pie(lgb_feature_importance["lgb_fea_imp"][0:20], labels = lgb_feature_importance["lgb_fea_name"][0:20],
#         counterclock = True, wedgeprops = {'width' : 0.6}, autopct = '%0.0f%%');

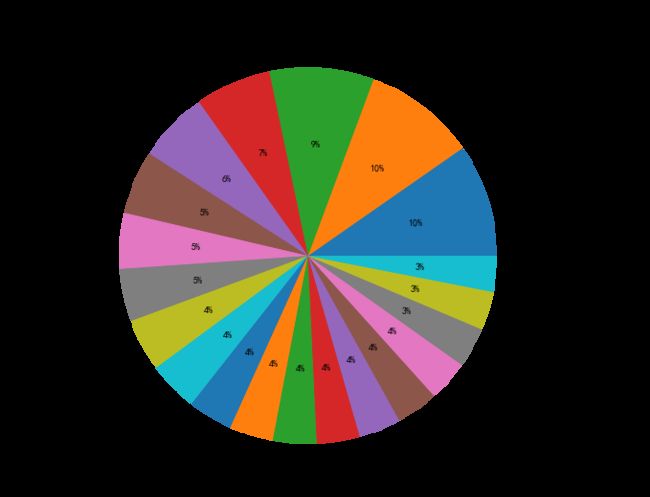
fig, ax = plt.subplots(figsize=(16,9))
plt.pie(lgb_feature_importance["lgb_fea_imp"][0:20], labels = lgb_feature_importance["lgb_fea_name"][0:20],
        counterclock = True, autopct = '%0.0f%%',radius=1.1);
plt.title("lgb特征比重图")
# plt.legend()
plt.show()


# plt.legend(lgb_feature_importance["lgb_fea_name"][0:20],loc="upper right")
# xgb_feature_importance.loc[6]["xgb_fea_name"] = "其他"
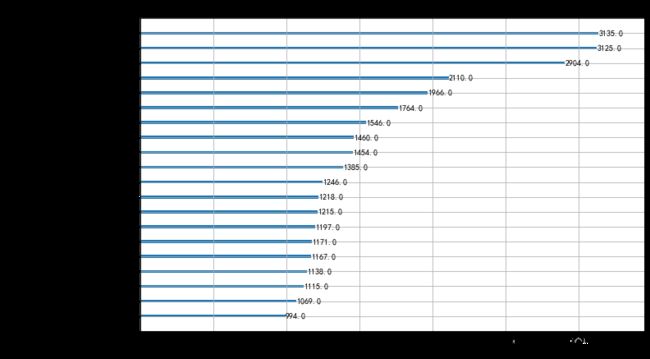
xgb_feature_importance[0:20]
| xgb_fea_name | xgb_fea_imp | |
|---|---|---|
| 15 | 归属于母公司净利润同必增长(%) | 3135.0 |
| 16 | 基本每股收益同必增长(%) | 3125.0 |
| 2 | 稀释每股收益 | 2904.0 |
| 1 | 每股收益(期末摊薄,元/股) | 2110.0 |
| 17 | 稀释每股收益同必增长(%) | 1966.0 |
| 14 | 营业总额同必增长(%) | 1764.0 |
| 37 | 实收资本(或股本) | 1546.0 |
| 3 | 每股净资产(元/股) | 1460.0 |
| 21 | 每股净资产相对年初增长(%) | 1454.0 |
| 38 | 资本公积 | 1385.0 |
| 23 | 净资产收益率(扣除加权平均,%) | 1246.0 |
| 10 | 每股公积金(元/股) | 1218.0 |
| 9 | 每股盈余公积(元/股) | 1215.0 |
| 0 | 股票编号 | 1197.0 |
| 18 | 总资产相对年初增长(%) | 1171.0 |
| 8 | 每股资本公积(元/股) | 1167.0 |
| 31 | ebit利息保障倍数(倍) | 1138.0 |
| 13 | 每股现金流量净额(元/股) | 1115.0 |
| 11 | 每股未分配利润(元/股) | 1069.0 |
| 19 | 净资产相对年初增长(%) | 994.0 |
# fig, ax = plt.subplots(figsize=(10,10))
# plt.pie(xgb_feature_importance["xgb_fea_imp"][0:20], labels = xgb_feature_importance["xgb_fea_name"][0:20],
#         counterclock = False, wedgeprops = {'width' : 0.6}, autopct = '%0.0f%%');
# plt.legend()

fig, ax = plt.subplots(figsize=(16,9))
# fig, ax = plt.subplots(figsize=(10,10))
plt.pie(xgb_feature_importance["xgb_fea_imp"][0:20], labels = xgb_feature_importance["xgb_fea_name"][0:20],
        counterclock = True, autopct = '%0.0f%%');
plt.title("xgb特征比重图")
# plt.legend()
plt.show()
3 Stacking 集成学习模型
3.1 模型训练
# # 利用逻辑回归的原因是 防止再次利用 复杂模型导致过拟合 我这里没有弄交叉验证
# # 参考:https://blog.csdn.net/chensq_yinhai/article/details/115341870
from sklearn.linear_model import LogisticRegression
newfeature = np.concatenate((lgb_train_pre.reshape(-1, 1),xgb_train_pre.reshape(-1, 1), svc_train_pre.reshape(-1, 1)), axis=1)
newtestdata = np.concatenate((lgb_pre.reshape(-1, 1),xgb_pre.reshape(-1, 1), svc_pre.reshape(-1, 1)), axis=1)
sigmoid_model = LogisticRegression(random_state=0).fit(newfeature, y_train)
joblib.dump(sigmoid_model, "Models/sigmoid_model.dat")
stacking_pre = sigmoid_model.predict_proba(newtestdata)[:, 1]
3.2 模型评价
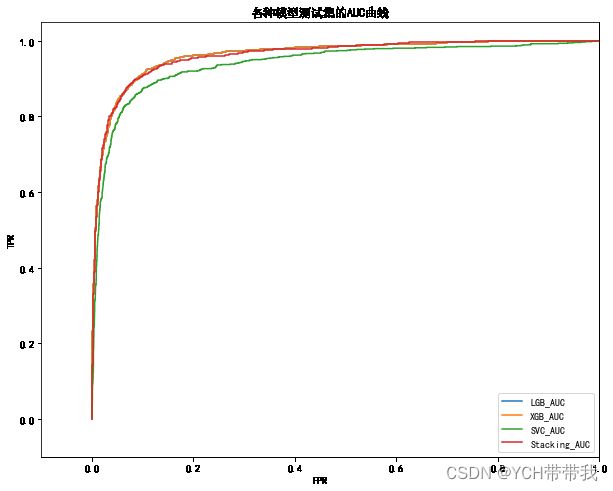
fig, ax = plt.subplots(figsize=(10,8))
plt.xlim([0-.1, 1.0])
plt.ylim([-0.1, 1.05])
plt.title("各种模型测试集的AUC曲线")
fpr, tpr, lgb_AUC = get_fptr_tpr(y_test, lgb_pre)
plt.plot(fpr,tpr, label="LGB_AUC")
fpr, tpr, xgb_AUC = get_fptr_tpr(y_test, lgb_pre)
plt.plot(fpr,tpr, label="XGB_AUC")
fpr, tpr, svc_AUC = get_fptr_tpr(y_test, svc_pre)
plt.plot(fpr,tpr, label="SVC_AUC")
fpr, tpr, stacking_AUC = get_fptr_tpr(y_test, stacking_pre)
plt.plot(fpr,tpr, label="Stacking_AUC")
plt.xlabel("FPR")
plt.ylabel("TPR")
plt.legend()
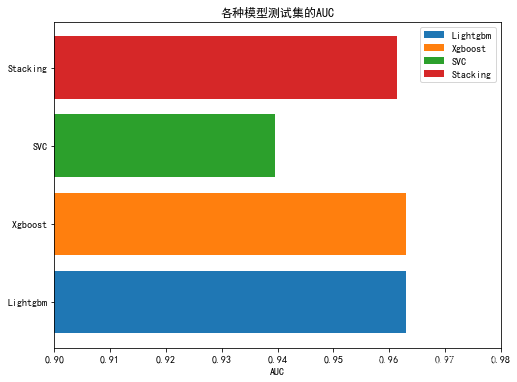
fig, ax = plt.subplots(figsize=(8,6))
labels = ["Lightgbm","Xgboost", "SVC", "Stacking"]
colors = ['r', 'g', 'b', 'orange']
AUC = [lgb_AUC, xgb_AUC, svc_AUC, stacking_AUC]
name = ["Lightgbm", " Xgboost", "SVC", "Stacking"]
# plt.barh(name, AUC, color = ['r', 'g', 'b', 'orange'], label=labels)
plt.barh(name[0], AUC[0], label=labels[0])
plt.barh(name[1], AUC[1], label=labels[1])
plt.barh(name[2], AUC[2], label=labels[2])
plt.barh(name[3], AUC[3], label=labels[3])
plt.xlabel("AUC")
plt.title("各种模型测试集的AUC")
plt.xlim(0.9,0.98)
plt.legend()
plt.show()
3.3 预测第 8 年上市公司实施高送转的情况
import pandas as pd

data = pd.read_csv(model_data_save_path, index_col=0)
X_pd = data[data["年份(年末)"]==7].drop("年份(年末)",axis=1)
Y_pd = X_pd["是否高转送"]
X_pd = X_pd.drop("是否高转送",axis=1)
# if "股票编号" in X_pd.columns:
#     X_pd = X_pd.drop(columns=["股票编号"], axis=1)
X = X_pd.to_numpy()
mm = MinMaxScaler()
X = mm.fit_transform(X)
scaler = StandardScaler()
Xtest = scaler.fit_transform(X)
Ytest = Y_pd.to_numpy()
X_pd
| 股票编号 | 每股收益(期末摊薄,元/股) | 稀释每股收益 | 每股净资产(元/股) | 每股营业总收入(元/股) | 每股营业收入(元/股) | 每股营业利润(元/股) | 每股息税前利润(元/股) | 每股资本公积(元/股) | 每股盈余公积(元/股) | ... | 息税折旧摊销前利润/负债合计 | 息税折旧摊销前利润/带息债务 | ebit利息保障倍数(倍) | 营业总成本/营业总收入(%) | 经营活动净收益/营业总收入(%) | 净利润/营业总收入(%) | ebitda/营业总收入(%) | 归属于母公司的股东权益/总资产(%) | 实收资本(或股本) | 资本公积 | |
|---|---|---|---|---|---|---|---|---|---|---|---|---|---|---|---|---|---|---|---|---|---|
| 6 | 1 | 1.0453 | 1.0453 | 4.9023 | 4.8738 | 4.8738 | 1.3972 | 1.3439 | 0.1996 | 0.5027 | ... | 0.342635 | 36129.451033 | 0.001536 | 75.0113 | 24.9887 | 21.4468 | 29.14510 | 54.1723 | 5.959791e+08 | 1.189381e+08 |
| 13 | 2 | 0.4044 | 0.3200 | 5.2170 | 3.1745 | 3.1745 | 0.4523 | 0.4363 | 2.1735 | 0.1827 | ... | 0.921912 | 32569.789224 | -0.000708 | 86.6884 | 13.3116 | 12.7387 | 17.76480 | 89.5053 | 8.311760e+07 | 1.806529e+08 |
| 20 | 3 | -0.0042 | -0.0042 | 1.7783 | 0.7710 | 0.7710 | -0.0138 | -0.0056 | 0.6971 | 0.0644 | ... | 0.117351 | 0.218691 | -0.671924 | 103.1180 | -3.1180 | -0.6438 | 6.81430 | 79.4992 | 1.510550e+09 | 1.053069e+09 |
| 27 | 4 | 0.0943 | 0.0943 | 3.3428 | 5.7990 | 5.7990 | 0.0995 | 0.2383 | 0.7376 | 0.4322 | ... | 0.108892 | 0.263176 | 1.842629 | 99.9246 | 0.0754 | 1.5143 | 10.86020 | 34.2258 | 1.745754e+08 | 1.287605e+08 |
| 34 | 5 | 0.7780 | 0.9100 | 7.8629 | 4.3329 | 4.3329 | 0.8718 | 0.9004 | 3.6358 | 0.1073 | ... | 1.224130 | 10.474077 | 300.501017 | 80.5242 | 19.4758 | 17.9560 | 28.05800 | 88.7859 | 6.800000e+07 | 2.472332e+08 |
| ... | ... | ... | ... | ... | ... | ... | ... | ... | ... | ... | ... | ... | ... | ... | ... | ... | ... | ... | ... | ... | ... |
| 24233 | 3462 | 0.5770 | 0.5770 | 6.1199 | 11.6987 | 11.6987 | 0.7360 | 0.9682 | 1.9218 | 0.4831 | ... | 0.307567 | 0.483046 | 4.104014 | 94.5760 | 5.4240 | 5.0022 | 15.56200 | 50.0662 | 1.167561e+09 | 2.243767e+09 |
| 24240 | 3463 | 0.5804 | 0.5831 | 10.6666 | 7.1831 | 7.1831 | 0.6956 | 0.7307 | 8.2990 | 0.1982 | ... | 0.244503 | 1.011356 | 16.769062 | 91.4106 | 8.5894 | 7.7843 | 13.46950 | 72.7819 | 5.170313e+08 | 4.311292e+09 |
| 24247 | 3464 | 0.1937 | 0.1900 | 3.1109 | 9.9443 | 9.9443 | 0.5566 | 1.4168 | 1.0209 | 0.3887 | ... | 0.087313 | 0.116342 | 1.261007 | 95.1713 | 4.8287 | 1.6218 | 21.29650 | 10.9624 | 1.900500e+09 | 1.940141e+09 |
| 24254 | 3465 | 0.8860 | 0.9900 | 7.4300 | 2.3815 | 2.3815 | 1.0814 | 0.0002 | 2.0756 | 0.6454 | ... | -0.000027 | -0.000231 | 0.000097 | 54.5906 | 44.8653 | 37.4993 | 0.01245 | 7.5047 | 2.114300e+10 | 4.891240e+08 |
| 24261 | 3466 | 0.3931 | 0.2800 | 6.1511 | 3.8495 | 3.8495 | 0.4306 | 0.4224 | 2.9481 | 0.3422 | ... | 0.237832 | 1.485498 | 336.019747 | 90.7982 | 9.2018 | 10.0824 | 18.17590 | 67.5468 | 8.000000e+07 | 2.358505e+08 |
3466 rows × 39 columns
log_model = joblib.load('Models/lgb_model.dat')
lgb_pre2 = lgb_model.predict(Xtest)
xgb_model = joblib.load('Models/xgb_model.dat')
xgb_eval2 = xgb.DMatrix(Xtest, Ytest, feature_names=list(X_pd.columns))
xgb_pre2 = xgb_model.predict(xgb_eval2)
svc_model = joblib.load('Models/svc_model.dat')
svc_pre2 = svc_model.predict(Xtest)
testdata = np.concatenate((lgb_pre2.reshape(-1, 1),xgb_pre2.reshape(-1, 1), svc_pre2.reshape(-1, 1)), axis=1)
sigmoid_model = joblib.load('Models/sigmoid_model.dat')
stacking_pre2 = sigmoid_model.predict_proba(testdata)[:, 1]
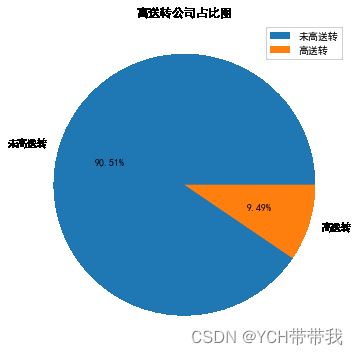
countN = (stacking_pre2>0.5).astype(int).sum()
countSum = (stacking_pre2>0).astype(int).sum()
print("高送转公司数:", countN)
print("高送转占比:{:.2f} %".format(countN / countSum * 100))
高送转公司数: 329
高送转占比:9.49 %
fig, ax = plt.subplots(figsize=(6,6))
plt.pie([countSum-countN, countN], labels=["未高送转","高送转"], autopct= '%1.2f%%')
plt.title("高送转公司占比图")
plt.legend()
plt.show()
