100天精通Python(可视化篇)——第81天:matplotlib绘制不同种类炫酷饼图参数说明+代码实战(自定义、百分比、多个子图、圆环、嵌套饼图)
文章目录
- 专栏导读
- 0. 前言
- 1. 参数说明
- 2. 普通饼图
- 3. 百分比饼图
- 4. 突出某一块的饼图
- 5. 自定义颜色的饼图
- 6. 多个子图
- 7. 圆环饼图
- 8. 圆环分离饼图
- 9. 饼图+圆环图组合
- 10. 多层圆环饼图
专栏导读
本文已收录于《100天精通Python从入门到就业》:本专栏专门针对零基础和需要进阶提升的同学所准备的一套完整教学,从0到100的不断进阶深入,后续还有实战项目,轻松应对面试,专栏订阅地址:https://blog.csdn.net/yuan2019035055/category_11466020.html
- 优点:订阅限时9.9付费专栏进入千人全栈VIP答疑群,作者优先解答机会(代码指导、远程服务),群里大佬众多可以抱团取暖(大厂内推机会)
- 专栏福利:简历指导、招聘内推、每周送实体书、80G全栈学习视频、300本IT电子书:Python、Java、前端、大数据、数据库、算法、爬虫、数据分析、机器学习、面试题库等等


0. 前言
饼图是一种常见的统计图表,用来表示每个分类所占比例。它是一种分开圆形,再把它们分成不同大小和形状的片段,表示不同分类处于整体中所占的比例,可以直观地反映变量之间的关系。同时也有扇形图,也即用扇形的面积来模拟数据的大小。
![]()
特点:饼图能有效的反映一个分类下各大小项所占比例,简洁明了,直观易读,甚至可以用颜色表示的更加直观,以达到更加有效的传达信息的目的。
应用场景:饼图常用于客观反应一个统计主体中不同组或不同项的比例,例如采用分类统计某个行业销售情况,社会民众对某种事物的支持程度等,同时应用范围也十分广泛,可以运用于商业,教育,社会,经济等领域。
1. 参数说明
matplotlib通过plt.pie函数绘制饼图,语法格式如下:
plt.pie(
    x,  # 饼图每个扇形的大小,可以是数字、列表或数组
    explode=None,  # 每个扇形与中心的距离,可以是数字、列表或数组,例如[0, 0.1, 0, 0]表示第二个扇形与中心的距离为半径的10%
    labels=None,  # 饼图每个扇形的标签,可以是字符串或列表
    colors=None,  # 饼图每个扇形的颜色,可以是字符串、元组或列表
    autopct=None,  # 控制每个扇形内部文本的显示格式,例如"%1.1f%%"表示保留一位小数并添加百分号
    pctdistance=0.6,  # 扇形内部文本与圆心的距离,例如0.6表示距离半径的60%
    shadow=False,  # 是否添加阴影效果
    labeldistance=1.1,  # 扇形标签与圆心的距离,例如1.1表示距离半径的110%
    startangle=None,  # 饼图的起始角度,以度数表示,例如90表示从12点钟方向开始绘制
    radius=None,  # 饼图的半径,例如0.8表示半径为0.8倍的图形
    counterclock=True,  # 是否逆时针绘制饼图
    wedgeprops=None,  # 扇形的属性,例如边框颜色、边框宽度、填充颜色等
    textprops=None,  # 扇形内部文本的属性,例如字体大小、颜色等
    center=(0, 0),  # 饼图的中心坐标,例如(0.5, 0.5)表示中心在图形的正中央
    frame=False,  # 是否添加边框
    rotatelabels=False,  # 是否旋转扇形标签的方向
    normalize=None,  # 是否将大小归一化,例如True表示将大小除以总和并乘以100%
    data=None,  # 饼图数据的来源,可以是字典、DataFrame、Series等
)
参数说明:
- explode:每个扇形与中心的距离,可以是数字、列表或数组,例如[0, 0.1, 0, 0]表示第二个扇形与中心的距离为半径的10%
- labels:饼图每个扇形的标签,可以是字符串或列表
- colors:饼图每个扇形的颜色,可以是字符串、元组或列表
- autopct:控制每个扇形内部文本的显示格式,例如"%1.1f%%"表示保留一位小数并添加百分号
- pctdistance:扇形内部文本与圆心的距离,例如0.6表示距离半径的60%
- shadow:是否添加阴影效果
- labeldistance:扇形标签与圆心的距离,例如1.1表示距离半径的110%
- radius:饼图的半径,例如0.8表示半径为0.8倍的图形
- counterclock:是否逆时针绘制饼图
- wedgeprops:扇形的属性,例如边框颜色、边框宽度、填充颜色等
- textprops:扇形内部文本的属性,例如字体大小、颜色等
- center:饼图的中心坐标,例如(0.5, 0.5)表示中心在图形的正中央
- frame:是否添加边框
- rotatelabels:是否旋转扇形标签的方向
- normalize:是否将大小归一化,例如True表示将大小除以总和并乘以100%
- data:饼图数据的来源,可以是字典、DataFrame、Series等
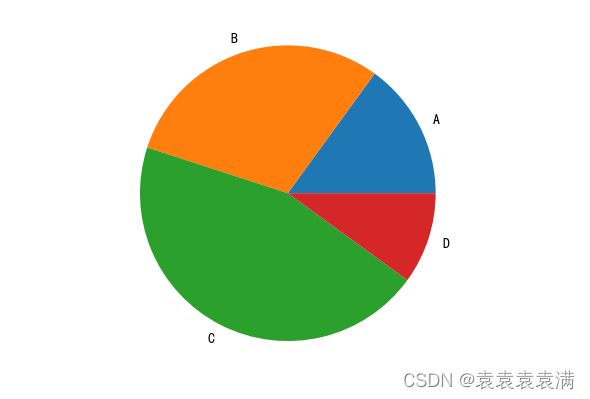
2. 普通饼图
import matplotlib.pyplot as plt

# 数据
labels = ['A', 'B', 'C', 'D']
sizes = [15, 30, 45, 10]

# 绘图
plt.pie(sizes, labels=labels)

# 显示图形
plt.show()
3. 百分比饼图
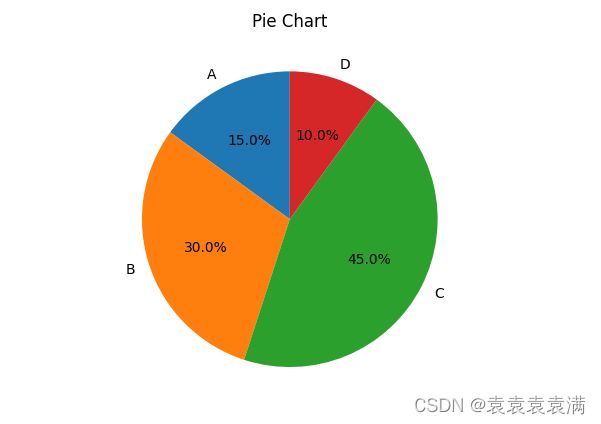
通过设置autopct='%1.1f%%'参数显示饼图百分比占比:
import matplotlib.pyplot as plt

# 数据
labels = ['A', 'B', 'C', 'D']
sizes = [15, 30, 45, 10]

# 绘制饼图
plt.pie(sizes, labels=labels, autopct='%1.1f%%', startangle=90)

# 添加标题
plt.title('Pie Chart')

# 显示图形
plt.show()
参数说明:
- labels:饼图中每个扇形的标签。
- sizes:每个扇形的大小,可以是数字、列表或数组。
- autopct:控制每个扇形内部文本的显示格式,%1.1f%%表示保留一位小数并添加百分号。
- startangle:饼图的起始角度,以度数表示,例如90表示从12点钟方向开始绘制。
运行结果:
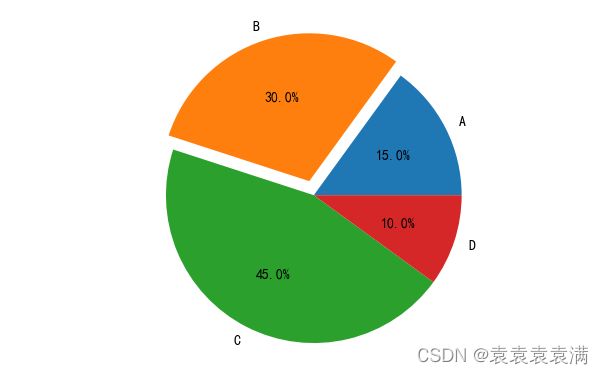
4. 突出某一块的饼图
import matplotlib.pyplot as plt

# 数据
labels = ['A', 'B', 'C', 'D']
sizes = [15, 30, 45, 10]
explode = (0, 0.1, 0, 0)

# 绘图
plt.pie(sizes, explode=explode, labels=labels, autopct='%1.1f%%')

# 显示图形
plt.show()
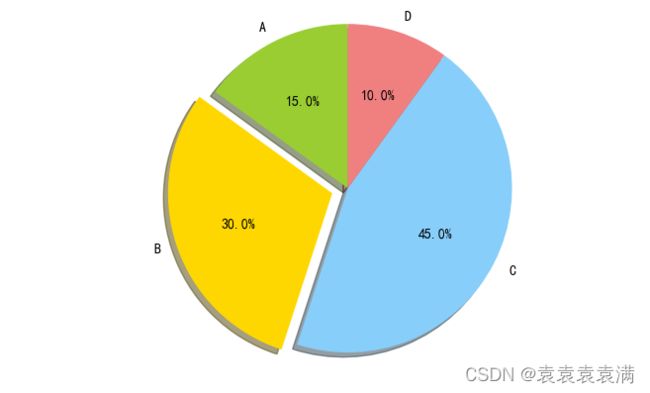
5. 自定义颜色的饼图
import matplotlib.pyplot as plt

# 数据
labels = ['A', 'B', 'C', 'D']
sizes = [15, 30, 45, 10]

# 设置颜色
colors = ['yellowgreen', 'gold', 'lightskyblue', 'lightcoral']

# 绘图
explode = (0, 0.1, 0, 0)
plt.pie(sizes, explode=explode, labels=labels, colors=colors,autopct='%1.1f%%', shadow=True, startangle=90)
plt.axis('equal')

# 显示
plt.show()
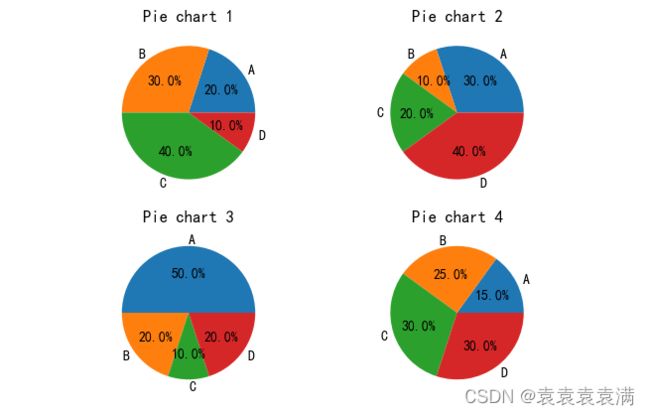
6. 多个子图
多个饼图(Multiple Pie chart):将多个饼图组合在一起,方便对比分析。
要绘制多个饼图,我们可以使用subplot()函数在一个图中创建多个子图。下面例子创建了一个2x2的子图,每个子图都是一个饼图。我们可以在每个子图中使用pie()函数来绘制饼图,然后使用set_title()函数为每个子图添加标题。最后,我们使用show()函数显示图形:
import matplotlib.pyplot as plt

# 定义数据
labels = ['A', 'B', 'C', 'D']
sizes1 = [20, 30, 40, 10]
sizes2 = [30, 10, 20, 40]
sizes3 = [50, 20, 10, 20]
sizes4 = [15, 25, 30, 30]

# 创建子图
fig, axs = plt.subplots(2, 2)

# 绘制饼图
axs[0, 0].pie(sizes1, labels=labels, autopct='%1.1f%%')
axs[0, 1].pie(sizes2, labels=labels, autopct='%1.1f%%')
axs[1, 0].pie(sizes3, labels=labels, autopct='%1.1f%%')
axs[1, 1].pie(sizes4, labels=labels, autopct='%1.1f%%')

# 添加标题
axs[0, 0].set_title('Pie chart 1')
axs[0, 1].set_title('Pie chart 2')
axs[1, 0].set_title('Pie chart 3')
axs[1, 1].set_title('Pie chart 4')

# 显示图形
plt.show()
7. 圆环饼图
import matplotlib.pyplot as plt

# 定义数据
labels = ['A', 'B', 'C', 'D']
sizes = [15, 30, 45, 10]
colors = ['#FFC107', '#FF9800', '#FF5722', '#F44336']
explode = (0, 0, 0, 0.1)
inner_radius = 0.5

# 绘制圆环饼图
fig, ax = plt.subplots(figsize=(8, 8))
ax.pie(sizes, explode=explode, labels=labels, colors=colors, autopct='%1.1f%%', startangle=90, counterclock=False, wedgeprops={'linewidth': 1, 'edgecolor': 'white'})
ax.set_title('Circle Donut Chart', fontsize=20)

# 设置内圆半径
centre_circle = plt.Circle((0, 0), inner_radius, color='white', fc='white', linewidth=1.25)
fig.gca().add_artist(centre_circle)

# 显示图形
plt.show()
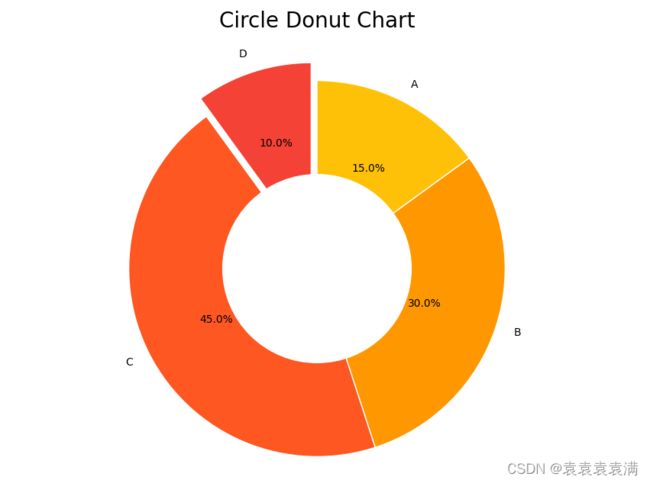
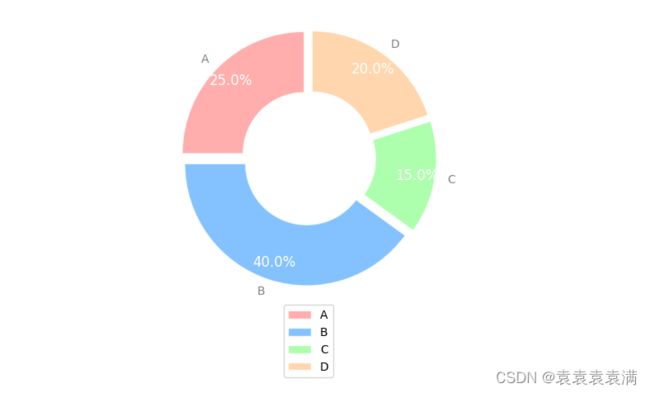
8. 圆环分离饼图
下面示例代码将绘制一个圆环分离饼图,其中包含四个环形,每个环形的大小和颜色都不同。标签和百分比将添加到每个环形中。圆角线将添加到每个环形中,使其看起来更美观:
import matplotlib.pyplot as plt

# 数据
sizes = [25, 40, 15, 20]  # 环形大小
labels = ['A', 'B', 'C', 'D']  # 标签
colors = ['#ff9999', '#66b3ff', '#99ff99', '#ffcc99']  # 环形颜色
explode = [0.05, 0.05, 0.05, 0.05]  # 突出显示

# 绘制圆角线穿环百分比图
fig, ax = plt.subplots()
ax.axis('equal')  # 设置坐标轴比例相等
wedges, texts, autotexts = ax.pie(sizes, labels=labels, colors=colors, autopct='%1.1f%%', startangle=90, pctdistance=0.85, explode=explode, wedgeprops=dict(width=0.5, edgecolor='w'))

# 添加圆角线
for wedge in wedges:
    wedge.set_linewidth(1)
    wedge.set_edgecolor('w')
    wedge.set_alpha(0.8)
    wedge.set_zorder(1)
    wedge.set_capstyle('round')

# 添加标签和百分比
ax.legend(wedges, labels, loc='center', bbox_to_anchor=(0.5, -0.1))
for text, autotext in zip(texts, autotexts):
    text.set_color('grey')
    autotext.set_color('white')
    autotext.set_fontsize(12)

# 显示图形
plt.show()
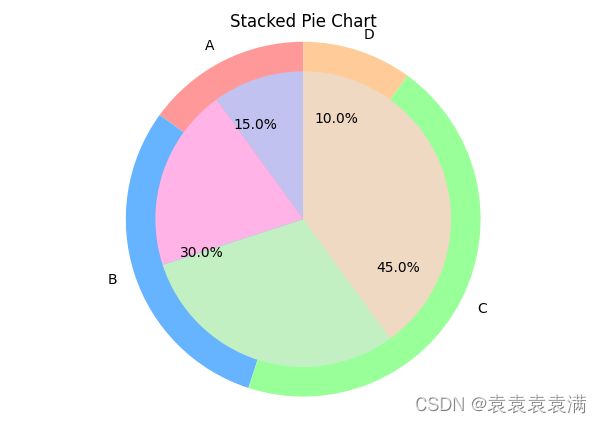
9. 饼图+圆环图组合
使用圆环图与饼图制作,圆环图制作外层突出数据,饼图制作为浅色阴影:
import matplotlib.pyplot as plt

# 数据
labels = ['A', 'B', 'C', 'D']
sizes1 = [15, 30, 45, 10]
sizes2 = [10, 20, 30, 40]

# 绘制饼图1
plt.pie(sizes1, labels=labels, autopct='%1.1f%%', startangle=90, radius=1.2, colors=['#ff9999', '#66b3ff', '#99ff99', '#ffcc99'])

# 绘制饼图2
plt.pie(sizes2, radius=1, colors=['#c2c2f0', '#ffb3e6', '#c2f0c2', '#f0d9c2'], startangle=90)

# 添加标题
plt.title('Stacked Pie Chart')

# 显示图形
plt.show()
参数说明:
- labels:饼图中每个扇形的标签。
- sizes1和sizes2:每个扇形的大小,可以是数字、列表或数组。sizes1表示底层饼图的大小,sizes2表示顶层饼图的大小。
- autopct:控制每个扇形内部文本的显示格式,%1.1f%%表示保留一位小数并添加百分号。
- startangle:饼图的起始角度,以度数表示,例如90表示从12点钟方向开始绘制。
- radius:饼图的半径,例如1.2表示底层饼图的半径为整个图形的1.2倍,1表示顶层饼图的半径为整个图形的1倍。
- colors:饼图每个扇形的颜色,可以是字符串、元组或列表。本例中使用了自定义颜色。
- 绘制底层饼图时,只需传入sizes1和radius=1.2参数即可。由于顶层饼图的半径为1,因此底层饼图的半径为1.2时,会自动与顶层饼图重叠。
- 可以使用startangle参数控制顶层饼图的起始角度,使其与底层饼图重叠时,各个扇形的位置保持一致。
- 可以使用不同的颜色区分底层饼图和顶层饼图的数据。
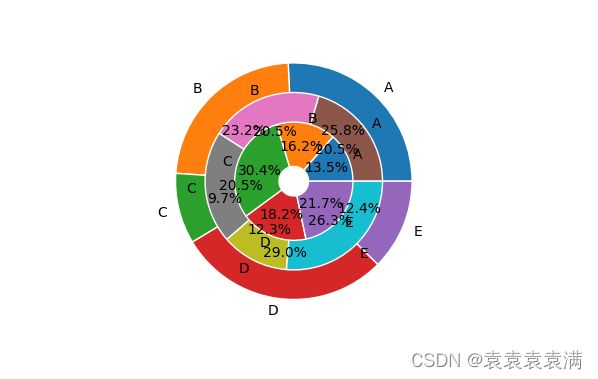
10. 多层圆环饼图
下面代码将创建一个多层圆环饼图,其中每层饼图表示不同的数据集,每个扇形表示数据的百分比。图例标签是数据集的标签,半径越大表示该层数据集的权重越高。
import matplotlib.pyplot as plt

# 创建数据
labels = ['A', 'B', 'C', 'D', 'E']
data_1 = [20, 30, 10, 25, 15]
data_2 = [15, 25, 20, 10, 30]
data_3 = [10, 20, 30, 15, 25]

# 计算百分比
total = [sum(x) for x in zip(data_1, data_2, data_3)]
percent_1 = [x/total[i]*100 for i,x in enumerate(data_1)]
percent_2 = [x/total[i]*100 for i,x in enumerate(data_2)]
percent_3 = [x/total[i]*100 for i,x in enumerate(data_3)]

# 绘制饼图
fig, ax = plt.subplots()
ax.pie(percent_1, labels=labels, autopct='%1.1f%%', radius=0.8, wedgeprops=dict(width=0.3, edgecolor='w'))
ax.pie(percent_2, labels=labels, autopct='%1.1f%%', radius=0.6, wedgeprops=dict(width=0.3, edgecolor='w'))
ax.pie(percent_3, labels=labels, autopct='%1.1f%%', radius=0.4, wedgeprops=dict(width=0.3, edgecolor='w'))

# 添加标题
ax.set_title('Multi-layer Stacked Pie Chart')

# 显示图像
plt.show()
