混淆矩阵的生成
混淆矩阵简介
混淆矩阵(Confusion Matrix)是一个二维表格,常用于评价分类模型的性能。在混淆矩阵中,每一列代表了预测值,每一行代表了真实值。因此,混淆矩阵中的每一个元素表示了一个样本被预测为某一类别的次数。混淆矩阵的构成如下:
| 预测值=正例 | 预测值=反例 | |
|---|---|---|
| 真实值=正例 | TP | FN |
| 真实值=反例 | FP | TN |
其中,TP表示真正例(True Positive),FN表示假反例(False Negative),FP表示假正例(False Positive),TN表示真反例(True Negative)。
解释如下:
TP:真正例,指的是模型将正例预测为正例的次数;
FN:假反例,指的是模型将正例预测为反例的次数;
FP:假正例,指的是模型将反例预测为正例的次数;
TN:真反例,指的是模型将反例预测为反例的次数。
混淆矩阵的重要性在于,可以通过计算其中的四个元素,得到各种评价指标,如精确度(Accuracy)、召回率(Recall)、准确率(Precision)和 F1 值等。
精确度(Accuracy):表示模型预测正确的样本数与总样本数之比,即 A c c u r a c y = T P + T N T P + F P + F N + T N Accuracy = \frac{TP+TN}{TP+FP+FN+TN} Accuracy=TP+FP+FN+TNTP+TN;
召回率(Recall):表示模型正确预测正例样本的比例,即 R e c a l l = T P T P + F N Recall = \frac{TP}{TP+FN} Recall=TP+FNTP;
准确率(Precision):表示模型预测为正例的样本中,真正例的比例,即 P r e c i s i o n = T P T P + F P Precision = \frac{TP}{TP+FP} Precision=TP+FPTP;
F1 值:综合了准确率和召回率,即 F 1 = 2 × P r e c i s i o n × R e c a l l P r e c i s i o n + R e c a l l F1 = \frac{2\times Precision\times Recall}{Precision+Recall} F1=Precision+Recall2×Precision×Recall。
混淆矩阵也可以可视化,可以使用热力图等图形来展示混淆矩阵中每个元素的数值大小,以便更加直观地理解分类模型的性能。
混淆矩阵的主要作用和意义如下:
评估分类器的性能:混淆矩阵可以帮助我们计算分类器的准确率、召回率、精确率、F1分数等指标,从而评估分类器的性能。
比较不同分类器的性能:混淆矩阵可以帮助我们比较不同分类器的性能,找出最优的分类器。
识别分类器的错误类型:混淆矩阵可以帮助我们了解分类器在哪些情况下容易出错,识别出分类器的错误类型,从而针对性地改进分类器。
优化分类器的阈值:混淆矩阵可以帮助我们优化分类器的阈值,从而提高分类器的性能。
可视化分类器的性能:混淆矩阵可以将分类器的性能可视化,从而更直观地了解分类器的性能。
混淆矩阵可视化代码:
import os
from matplotlib.font_manager import FontProperties
import itertools
import matplotlib.pyplot as plt
import numpy as np


# 绘制混淆矩阵
def plot_confusion_matrix(cm, classes, normalize=False, title='Confusion matrix', cmap=plt.cm.Blues):
    """
    - cm : 计算出的混淆矩阵的值
    - classes : 混淆矩阵中每一行每一列对应的列
    - normalize : True:显示百分比, False:显示个数
    """
    if normalize:
        cm = cm.astype('float') / cm.sum(axis=1)[:, np.newaxis]
        print("显示百分比:")
        np.set_printoptions(formatter={'float': '{: 0.2f}'.format})
        print(cm)
    else:
        print('显示具体数字:')
        print(cm)
    plt.imshow(cm, interpolation='nearest', cmap=cmap)
    plt.title(title)
    plt.colorbar()
    tick_marks = np.arange(len(classes))
    plt.xticks(tick_marks, classes, rotation=45)
    plt.yticks(tick_marks, classes)
    # matplotlib版本问题,如果不加下面这行代码,则绘制的混淆矩阵上下只能显示一半,有的版本的matplotlib不需要下面的代码,分别试一下即可
    plt.ylim(len(classes) - 0.5, -0.5)
    fmt = '.2f' if normalize else 'd'
    thresh = cm.max() / 2.
    for i, j in itertools.product(range(cm.shape[0]), range(cm.shape[1])):
        plt.text(j, i, format(cm[i, j], fmt),
                 horizontalalignment="center",
                 color="white" if cm[i, j] > thresh else "black")
    plt.tight_layout()
    plt.ylabel('True label')
    plt.xlabel('Predicted label')
    plt.show()


cnf_matrix = np.array([[151, 64, 731, 164, 45],
                       [821, 653, 79, 0, 28],
                       [266, 167, 423, 4, 2],
                       [691, 0, 107, 776, 26],
                       [30, 0, 111, 17, 42]])
attack_types = ['Normal', 'DoS', 'Probe', 'R2L', 'U2R']
# 归一化
# plot_confusion_matrix(cnf_matrix, classes=attack_types, normalize=True, title='Confusion matrix')
# 不归一化
plot_confusion_matrix(cnf_matrix, classes=attack_types, normalize=True, title='Confusion matrix')
其中上述有两种方式可以选择,即一种是归一化,一种是不归一化
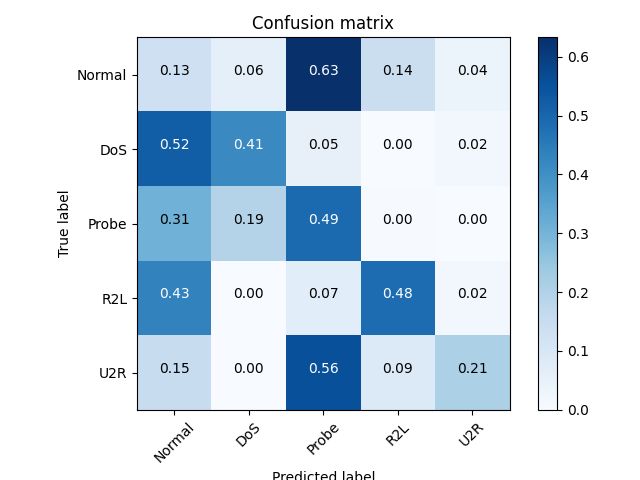
归一化设置 normalize=True
结果为:

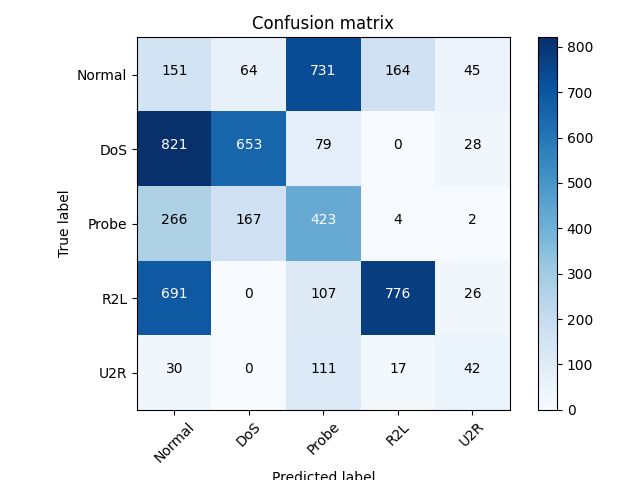
不归一化设置 normalize=False
结果为:

如果想要配合模型生成混淆矩阵,则需要让神经生成一个混淆矩阵的矩阵序列代码为:
import os
import json

import torch
from torchvision import transforms, datasets
import numpy as np
from tqdm import tqdm
import matplotlib.pyplot as plt
from prettytable import PrettyTable

from model import MobileNetV2


class ConfusionMatrix(object):
    """
    注意,如果显示的图像不全,是matplotlib版本问题
    本例程使用matplotlib-3.2.1(windows and ubuntu)绘制正常
    需要额外安装prettytable库
    """

    def __init__(self, num_classes: int, labels: list):
        self.matrix = np.zeros((num_classes, num_classes))
        self.num_classes = num_classes
        self.labels = labels

    def update(self, preds, labels):
        for p, t in zip(preds, labels):
            self.matrix[p, t] += 1

    def plot(self, normalize=False):
        if normalize:
        cm = cm.astype('float') / cm.sum(axis=1)[:, np.newaxis]
        print("显示百分比:")
        np.set_printoptions(formatter={'float': '{: 0.2f}'.format})
        print(cm)
   		else:
        print('显示具体数字:')
        print(cm)

        matrix = self.matrix
	    plt.imshow(matrix , interpolation='nearest', cmap=cmap)
	    plt.title(title)
	    plt.colorbar()
	    tick_marks = np.arange(len(classes))
	    plt.xticks(tick_marks, classes, rotation=45)
	    plt.yticks(tick_marks, classes)
	    # matplotlib版本问题,如果不加下面这行代码,则绘制的混淆矩阵上下只能显示一半,有的版本的matplotlib不需要下面的代码,分别试一下即可
	    plt.ylim(len(classes) - 0.5, -0.5)
	    fmt = '.2f' if normalize else 'd'
	    thresh = cm.max() / 2.
	    for i, j in itertools.product(range(cm.shape[0]), range(cm.shape[1])):
	        plt.text(j, i, format(cm[i, j], fmt),
	                 horizontalalignment="center",
	                 color="white" if cm[i, j] > thresh else "black")
	    plt.tight_layout()
	    plt.ylabel('True label')
	    plt.xlabel('Predicted label')
	    plt.show()


if __name__ == '__main__':
    mylabel = {"4": "4", "5": "5", "6": "6"}
    num_classes=3 #################################
    os.environ['KMP_DUPLICATE_LIB_OK'] = 'TRUE'
    ROOT_DATA = r'D:/other/ClassicalModel/data/flower_datas'  #################################
    device = torch.device("cuda:0" if torch.cuda.is_available() else "cpu")
    print(device)

    data_transform = transforms.Compose([transforms.Resize(256),
                                         transforms.CenterCrop(224),
                                         transforms.ToTensor(),
                                         transforms.Normalize([0.485, 0.456, 0.406], [0.229, 0.224, 0.225])])

    validate_dataset = datasets.ImageFolder(root=os.path.join(ROOT_DATA, "val"),
                                            transform=data_transform)

    batch_size = 16
    validate_loader = torch.utils.data.DataLoader(validate_dataset,
                                                  batch_size=batch_size, shuffle=False,
                                                  num_workers=2)

    net = MobileNetV2(num_classes=num_classes)  ###########################
    # load pretrain weights
    model_weight_path = r"D:/other/ClassicalModel/MobileNet/runs1/mobilenet_v2.pth"  #########################
    assert os.path.exists(model_weight_path), "cannot find {} file".format(model_weight_path)
    net.load_state_dict(torch.load(model_weight_path, map_location=device))
    net.to(device)
    labels = [label for _, label in mylabel.items()]
    confusion = ConfusionMatrix(num_classes=num_classes, labels=labels)
    net.eval()
    with torch.no_grad():
        for val_data in tqdm(validate_loader):
            val_images, val_labels = val_data
            outputs = net(val_images.to(device))
            outputs = torch.softmax(outputs, dim=1)
            outputs = torch.argmax(outputs, dim=1)
            # print('outputs++'+str(outputs.to("cpu").numpy())+'val_labels++'+str(val_labels.numpy()))
            confusion.update(outputs.to("cpu").numpy(), val_labels.to("cpu").numpy())
    confusion.plot()
其中*多的地方需要自行修改,例如
ROOT_DATA = r'D:/other/ClassicalModel/data/flower_datas' #################################
在这里进行数据集的修改
mylabel = {"4": "4", "5": "5", "6": "6"}
进行标签的修改
net = MobileNetV2(num_classes=3) ###########################
在这里进行网络修改
model_weight_path = r"D:/other/ClassicalModel/MobileNet/runs1/mobilenet_v2.pth" #########################
在这里进行本地模型权重的修改