python Matplotlib绘制三维图
参考链接
https://www.zhihu.com/question/328934697
https://www.moonapi.com/news/12036.html
https://blog.csdn.net/sunnyoldman001/article/details/125821967
官方文档
Axes3D.plot_surface
Poly3DCollection
官方作图示例 gallery
关键参数理解
rstride 和 cstride 参数
https://buyixiao.blog.csdn.net/article/details/86618606?
https://blog.csdn.net/y15520833229/article/details/126254044
示例
import numpy as np
import matplotlib.pyplot as plt
import seaborn as sns;sns.set_style('white')
# plt.style.use('ggplot')

fig1 = plt.figure(1,figsize=(6,6))
ax1  = fig1.add_subplot(1,1,1,projection='3d')
x = np.arange(start=0, stop=10, step=0.1)
y = np.arange(start=0, stop=10, step=1)
X, Y = np.meshgrid(x, y)

Z  = np.exp(-abs(X)) - np.exp(-abs(Y))

ax1.plot_surface(X,Y,Z,cstride = 10, rstride = 1, alpha=0.7, edgecolor = 'lightgray', lw=0.5)
ax1.set_xlabel(r'$\alpha$')
ax1.set_ylabel(r'$\beta$')
ax1.set_zlabel(r'$\gamma$')

ax1.view_init(30,-45)
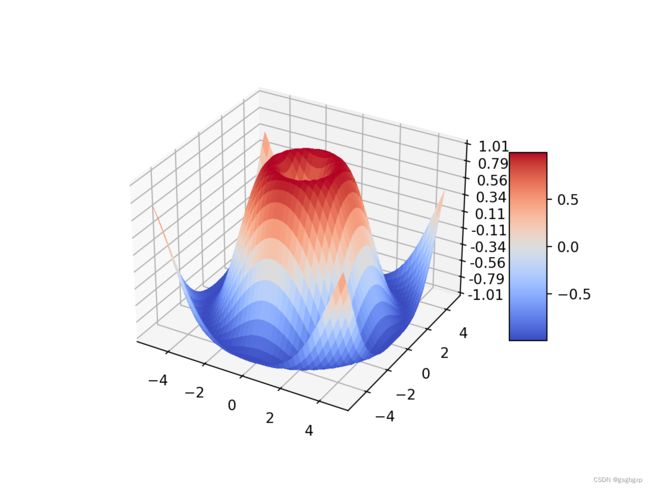
import matplotlib.pyplot as plt
from matplotlib import cm
from matplotlib.ticker import LinearLocator
import numpy as np

fig, ax = plt.subplots(subplot_kw={"projection": "3d"})

# Make data.
X = np.arange(-5, 5, 0.25)
Y = np.arange(-5, 5, 0.25)
X, Y = np.meshgrid(X, Y)
R = np.sqrt(X**2 + Y**2)
Z = np.sin(R)

# Plot the surface.
surf = ax.plot_surface(X, Y, Z, cmap=cm.coolwarm,
                       linewidth=0, antialiased=False)

# Customize the z axis.
ax.set_zlim(-1.01, 1.01)
ax.zaxis.set_major_locator(LinearLocator(10))
# A StrMethodFormatter is used automatically
ax.zaxis.set_major_formatter('{x:.02f}')

# Add a color bar which maps values to colors.
fig.colorbar(surf, shrink=0.5, aspect=5)

plt.show()
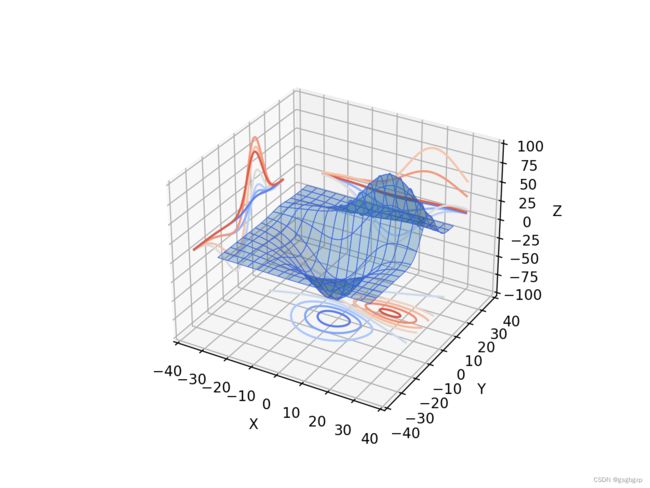
from mpl_toolkits.mplot3d import axes3d
import matplotlib.pyplot as plt

ax = plt.figure().add_subplot(projection='3d')
X, Y, Z = axes3d.get_test_data(0.05)

# Plot the 3D surface
ax.plot_surface(X, Y, Z, edgecolor='royalblue', lw=0.5, rstride=8, cstride=8,
                alpha=0.3)

# Plot projections of the contours for each dimension.  By choosing offsets
# that match the appropriate axes limits, the projected contours will sit on
# the 'walls' of the graph.
ax.contour(X, Y, Z, zdir='z', offset=-100, cmap='coolwarm')
ax.contour(X, Y, Z, zdir='x', offset=-40, cmap='coolwarm')
ax.contour(X, Y, Z, zdir='y', offset=40, cmap='coolwarm')

ax.set(xlim=(-40, 40), ylim=(-40, 40), zlim=(-100, 100),
       xlabel='X', ylabel='Y', zlabel='Z')

plt.show()


