从零开始学Python之matplotlib
一、条形图
- 在本期内容中,我们先从条形图开始,条形图实际上是用来表示分组(或离散)变量的可视化,可以使用matplotlib模块中的bar(barh)函数完成条形图的绘制。
1、简单垂直条形图(plt.bar)
- 案例一:直辖市GDP水平
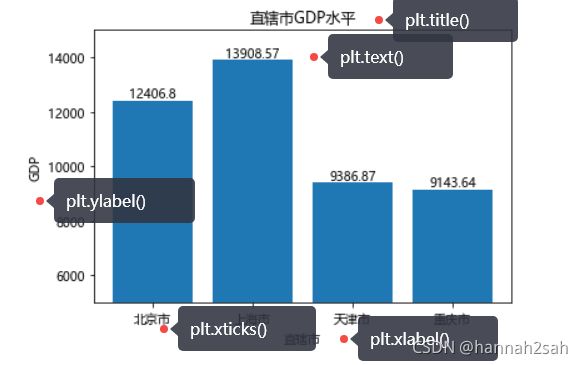
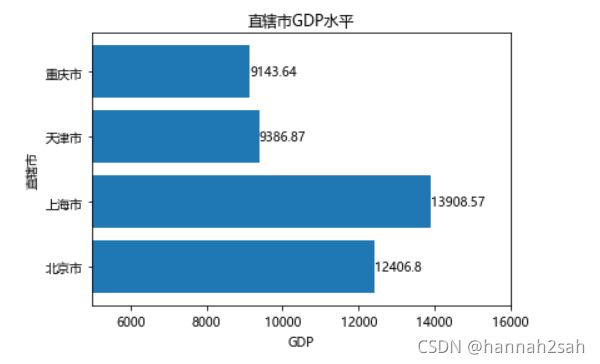
- 中国的四个直辖市分别为北京市、上海市、天津市和重庆市,其2017年上半年的GDP分别为12406.8亿、13908.57亿、9386.87亿、9143.64亿。对于这样一组数据,我们该如何使用条形图来展示各自的GDP水平呢?
#导入matplotlib相关库
import matplotlib.pyplot as plt

# 中文乱码的处理
plt.rcParams['font.sans-serif'] =['Microsoft YaHei']
plt.rcParams['axes.unicode_minus'] = False
- 由于matplotlib对中文的支持并不是很友好,所以需要提前对绘图进行字体的设置,即通过rcParams来设置字体,这里将字体设置为微软雅黑,同时为了避免坐标轴不能正常的显示负号,也需要进行设置;
#绘制条形图
plt.bar([0,1,2,3],[12406.8,13908.57,9386.87,9143.64],color = 'steelblue', alpha = 0.8)

#添加标题
plt.title("直辖市GDP水平")

#添加y轴标签
plt.ylabel("GDP")

#添加x轴标签
plt.xlabel("直辖市")

#添加刻度标签
plt.xticks(range(4),labels=["北京市","上海市","天津市","重庆市"])

# 设置Y轴的刻度范围
plt.ylim([5000,15000])

# 为每个条形图添加数值标签
for x,y in enumerate([12406.8,13908.57,9386.87,9143.64]):
     plt.text(x,y+100,s=y,ha='center')

plt.show()
代码解读
- 首先通过plt.bar函数指定了条形图的x轴、y轴值,设置x轴刻度标签为水平居中,条形图的填充色color为铁蓝色,同时设置透明度alpha为0.8;
- 添加y轴标签、标题、x轴刻度标签值,为了让条形图显示各柱体之间的差异,将y轴范围设置在5000~15000;
- 通过循环的方式,通过plt.text()添加条形图的数值标签;
补充:enumerate() 函数
- enumerate() 函数用于将一个可遍历的数据对象(如列表、元组或字符串)组合为一个索引序列,同时列出数据和数据下标,一般用在 for 循环当中。
- enumerate(sequence, [start=0])
- sequence – 一个序列、迭代器或其他支持迭代对象。
- start – 下标起始位置。
 seasons = ['Spring', 'Summer', 'Fall', 'Winter']
list(enumerate(seasons))
- 输出
[(0, 'Spring'), (1, 'Summer'), (2, 'Fall'), (3, 'Winter')]
 # 下标从 1 开始
list(enumerate(seasons, start=1))
- 输出
[(1, 'Spring'), (2, 'Summer'), (3, 'Fall'), (4, 'Winter')]
i = 0
seq = ['one', 'two', 'three']
for element in seq:
    print(i,seq[i])
    i+=1
- 输出
0 one
1 two
2 three
seq = ['one', 'two', 'three']
for i,element in enumerate(seq):
    print(i,element)
- 输出
0 one
1 two
2 three
2、简单水平条形图(plt.barh)
#导入matplotlib相关库
import matplotlib.pyplot as plt

# 中文乱码的处理
plt.rcParams['font.sans-serif'] =['Microsoft YaHei']
plt.rcParams['axes.unicode_minus'] = False
#将上面的垂直条形图做成水平条形图,使用plt.barh
plt.barh(range(4),[12406.8,13908.57,9386.87,9143.64])

#添加标题
plt.title("直辖市GDP水平")

#添加y轴标签
plt.ylabel("直辖市")

#添加x轴标签
plt.xlabel("GDP")

#添加刻度标签
plt.yticks(range(4),labels=["北京市","上海市","天津市","重庆市"])

# 设置Y轴的刻度范围
plt.xlim([5000,16000])

# 为每个条形图添加数值标签
for x,y in enumerate([12406.8,13908.57,9386.87,9143.64]):
    plt.text(y,x,s=y,va='center')

plt.show()
- 案例二:同一本书不同平台最低价比较
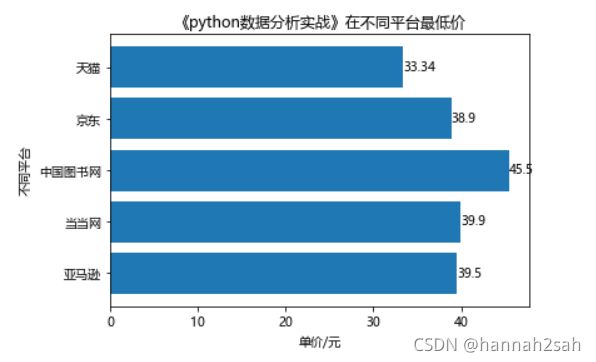
- 很多人在买一本书的时候,都比较喜欢货比三家,例如《python数据分析实战》在亚马逊、当当网、中国图书网、京东和天猫的最低价格分别为39.5、39.9、45.4、38.9、33.34。针对这个数据,我们也可以通过条形图来完成,这里使用水平条形图来显示:
plt.barh(range(5),[39.5,39.9,45.5,38.9,33.34])
#添加标题
plt.title("《python数据分析实战》在不同平台最低价")

#添加x轴标签
plt.xlabel("单价/元")

#添加y轴标签
plt.ylabel("不同平台")

#添加刻度标签
plt.yticks(range(5),labels=["亚马逊","当当网","中国图书网","京东","天猫"])

#为每个条形图添加数值标签
for x,y in enumerate([39.5,39.9,45.5,38.9,33.34]):
    plt.text(y,x,s = y,va = "center")

plt.show()
代码解读
- 水平条形图的绘制与垂直条形图的绘制步骤一致,只是调用了barh函数来完成。
- 需要注意的是,条形图的数值标签设置有一些不一样,需要将标签垂直居中显示,使用va参数即可。
3、水平交错条形图
- 以上讲的简单垂直和水平条形图是基于一种离散变量的情况,针对两种离散变量的条形图我们可以使用水平交错条形图和堆叠条形图,下面我们就来看看这两种条形图是如何绘制的。
- 案例三:胡润财富榜:亿万资产超高净值家庭数
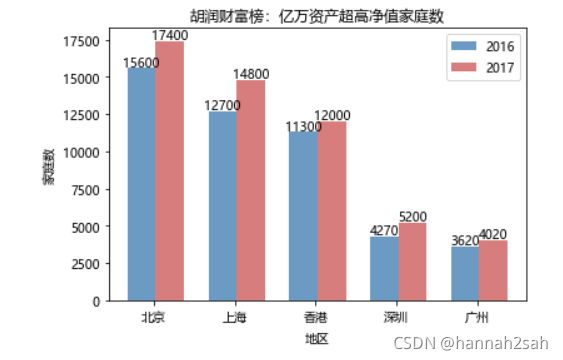
- 利用水平交错条形图对比2016年和2017年亿万资产超高净值家庭数(top5),其数据如下:
# 构建数据
Y2016 = [15600,12700,11300,4270,3620]
Y2017 = [17400,14800,12000,5200,4020]
labels = ['北京','上海','香港','深圳','广州']
bar_width = 0.35

#绘制图形
#plt.bar([1,2,3,4,5],Y2016,label = '2016',color = "steelblue",alpha = 0.8,width = bar_width)
#plt.bar([1.35,2.35,3.35,4.35,5.35],Y2017,label = '2017',color = "indianred",alpha = 0.8,width = bar_width)

import numpy as np
plt.bar(np.arange(5),Y2016,label = '2016',color = "steelblue",alpha = 0.8,width = bar_width)
plt.bar(np.arange(5)+bar_width,Y2017,label = '2017',color = "indianred",alpha = 0.8,width = bar_width)

#添加标题
plt.title("胡润财富榜:亿万资产超高净值家庭数")


#添加x轴标签
plt.xlabel("地区")

#添加y轴标签
plt.ylabel("家庭数")

#添加x轴刻度标签
plt.xticks(np.arange(5)+0.15,labels=labels)

#为每个条形图添加数值标签
for x,y in enumerate(Y2016):
    plt.text(x,y+120,s = y,ha = "center")

for x,y in enumerate(Y2017):
    plt.text(x+0.35,y+120,s = y,ha = "center")


#添加图例
plt.legend()

plt.show()
代码解读
- 水平交错条形图绘制的思想很简单,就是在第一个条形图绘制好的基础上,往左移一定的距离,再去绘制第二个条形图,所以在代码中会出现两个bar函数;
- 图例的绘制需要在bar函数中添加label参数;
- color和alpha参数分别代表条形图的填充色和透明度;
- 给条形图添加数值标签,同样需要使用两次for循环的方式实现;
总结
- 导入matplotlib.pyplot库
import matplotlib.pyplot as plt
- 字体的设置
plt.rcParams["font.sans-serif"] = ["Microsoft YaHei"]
- 正常显示负号
plt.rcParams["axes.unicode_minus"] = False
- 绘制图形
plt.bar(x轴数值,y轴数值,color = "颜色",alpha = 透明度,width = 宽度)
plt.barh(y轴数值,x轴数值,color = "颜色",alpha = 透明度,width = 宽度)
- 添加标题
plt.title("")
- 添加x轴标题
plt.xlabel("")
- 添加y轴标题
plt.ylabel("")
- 添加x轴刻度标题
plt.xticks(位置,labels=[])
- 添加y轴刻度标题
plt.yticks(位置,labels=[])
- 添加x轴刻度范围
plt.xlim([])
- 添加y轴刻度范围
plt.ylim([])
- 为每个条形图添加数值标签
for x,y in enumerate():
    plt.text(x,y,s = 值,ha/va = "center")
- 显示图例
plt.legend()
- 显示图形
plt.show()
二、饼图
- 我们用条形图来展示离散变量的分布呈现,在常见的统计图像中,还有一种图像可以表示离散变量各水平占比情况,这就是我们要讲解的饼图。饼图的绘制可以使用matplotlib库中的pie函数,首先我们来看看这个函数的参数说明。
- pie函数参数解读
plt.pie(x
        ,explode=None
        ,labels=None
        ,colors=None
        ,autopct=None
        ,pctdistance=0.6
        ,shadow=False
        ,labeldistance=1.1
        ,startangle=None
        ,radius=None
        ,counterclock=True
        ,wedgeprops=None
        ,textprops=None
        ,center=(0, 0)
        ,frame=False)
#x:指定绘图的数据;
#explode:指定饼图某些部分的突出显示,即呈现爆炸式;
#labels:为饼图添加标签说明,类似于图例说明;
#colors:指定饼图的填充色;
#autopct:自动添加百分比显示,可以采用格式化的方法显示;
#pctdistance:设置百分比标签与圆心的距离;
#shadow:是否添加饼图的阴影效果;
#labeldistance:设置各扇形标签(图例)与圆心的距离;
#startangle:设置饼图的初始摆放角度;
#radius:设置饼图的半径大小;
#counterclock:是否让饼图按逆时针顺序呈现;
#wedgeprops:设置饼图内外边界的属性,如边界线的粗细、颜色等;
#textprops:设置饼图中文本的属性,如字体大小、颜色等;
#center:指定饼图的中心点位置,默认为原点
#frame:是否要显示饼图背后的图框,如果设置为True的话,需要同时控制图框x轴、y轴的范围和饼图的中心位置;
饼图的绘制
- 案例:芝麻信用失信用户分析
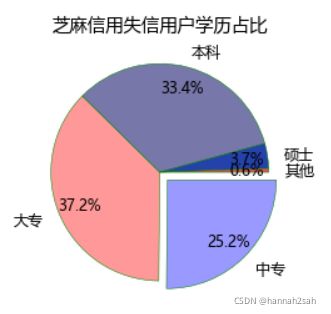
- 关于绘图数据,我们借用芝麻信用近300万失信人群的样本统计数据,该数据显示,从受教育水平上来看,中专占比25.15%,大专占比37.24%,本科占比33.36%,硕士占比3.68%,剩余的其他学历占比0.57%。对于这样一组数据,我们该如何使用饼图来呈现呢?
#导入对应的库
import matplotlib.pyplot as plt
#解决中文乱码的问题
plt.rcParams["font.sans-serif"] = ["Microsoft YaHei"]
#绘制图形
plt.pie([25.15,37.24,33.36,3.68,0.57]
       ,explode=[0.1,0,0,0,0]
       ,labels = ["中专","大专","本科","硕士","其他"]
       ,colors = ['#9999ff','#ff9999','#7777aa','#2442aa','#dd5555'] # 自定义颜色
       ,autopct='%.1f%%' # 设置百分比的格式,这里保留一位小数
       ,pctdistance=0.8 # 设置百分比标签与圆心的距离
       ,labeldistance = 1.15 # 设置教育水平标签与圆心的距离
       ,startangle = 360 # 设置饼图的初始角度
       ,radius = 1 # 设置饼图的半径
       ,counterclock = False # 是否逆时针,这里设置为顺时针方向
       ,wedgeprops = {'linewidth': 0.5, 'edgecolor':'green'}# 设置饼图内外边界的属性值
       ,textprops = {'fontsize':12, 'color':'k'} # 设置文本标签的属性值
       ,center = (0.5,0.5) # 设置饼图的原点
       ,frame = False # 是否显示饼图的图框,这里设置不显示
       )

#添加标题
plt.title("芝麻信用失信用户学历占比")

#显示图形
plt.show()
总结
- 相比较条形图设置,饼图大部分的设置都是在plt.pie里面完成的
- 记住上面pie函数参数即可
三、箱线图
- 针对离散变量我们可以使用常见的条形图和饼图完成数据的可视化工作,那么,针对数值型变量,我们也有很多可视化的方法,例如箱线图、直方图、折线图、面积图、散点图等等。这一期,我们就先来介绍一下数值型变量的箱线图绘制。箱线图一般用来展现数据的分布(如上下四分位值、中位数等),同时,也可以用箱线图来反映数据的异常情况。
- boxplot函数的参数解读
plt.boxplot(
    x
    ,notch=None
    ,sym=None
    ,vert=None
    ,whis=None
    ,positions=None
    ,widths=None
    ,patch_artist=None
    ,meanline=None
    ,showmeans=None
    ,showcaps=None
    ,showbox=None
    ,showfliers=None
    ,boxprops=None
    ,labels=None
    ,flierprops=None
    ,medianprops=None
    ,meanprops=None
    ,capprops=None
    ,whiskerprops=None)

#x:指定要绘制箱线图的数据;
#notch:是否是凹口的形式展现箱线图,默认非凹口;
#sym:指定异常点的形状,默认为+号显示;
#vert:是否需要将箱线图垂直摆放,默认垂直摆放;
#whis:指定上下须与上下四分位的距离,默认为1.5倍的四分位差;
#positions:指定箱线图的位置,默认为[0,1,2…];
#widths:指定箱线图的宽度,默认为0.5;
#patch_artist:是否填充箱体的颜色;
#meanline:是否用线的形式表示均值,默认用点来表示;
#showmeans:是否显示均值,默认不显示;
#showcaps:是否显示箱线图顶端和末端的两条线,默认显示;
#showbox:是否显示箱线图的箱体,默认显示;
#showfliers:是否显示异常值,默认显示;
#boxprops:设置箱体的属性,如边框色,填充色等;
#labels:为箱线图添加标签,类似于图例的作用;
#filerprops:设置异常值的属性,如异常点的形状、大小、填充色等;
#medianprops:设置中位数的属性,如线的类型、粗细等;
#meanprops:设置均值的属性,如点的大小、颜色等;
#capprops:设置箱线图顶端和末端线条的属性,如颜色、粗细等;
#whiskerprops:设置须的属性,如颜色、粗细、线的类型等;
箱线图绘制
- 案例:titanic:不同等级仓位的年龄箱线图
- 整体乘客的年龄箱线图
数据部分详情见这十套练习,教你如何用Pandas做数据分析
这篇内容的练习7-可视化
#导入必要的库
import pandas as pd

#从以下地址导入数据
#将数据框命名为titanic
titanic = pd.read_csv(r"D:\PythonFlie\python\pandas\pandas_exercise\exercise_data\train.csv")
titanic.head()
- 输出
PassengerId	Survived	Pclass	Name	Sex	Age	SibSp	Parch	Ticket	Fare	Cabin	Embarked
0	1	0	3	Braund, Mr. Owen Harris	male	22.0	1	0	A/5 21171	7.2500	NaN	S
1	2	1	1	Cumings, Mrs. John Bradley (Florence Briggs Th...	female	38.0	1	0	PC 17599	71.2833	C85	C
2	3	1	3	Heikkinen, Miss. Laina	female	26.0	0	0	STON/O2. 3101282	7.9250	NaN	S
3	4	1	1	Futrelle, Mrs. Jacques Heath (Lily May Peel)	female	35.0	1	0	113803	53.1000	C123	S
4	5	0	3	Allen, Mr. William Henry	male	35.0	0	0	373450	8.0500	NaN	S
# 检查年龄是否有缺失
titanic.info()
- 输出
<class 'pandas.core.frame.DataFrame'>
RangeIndex: 891 entries, 0 to 890
Data columns (total 12 columns):
 #   Column       Non-Null Count  Dtype
---  ------       --------------  -----
 0   PassengerId  891 non-null    int64
 1   Survived     891 non-null    int64
 2   Pclass       891 non-null    int64
 3   Name         891 non-null    object
 4   Sex          891 non-null    object
 5   Age          714 non-null    float64
 6   SibSp        891 non-null    int64
 7   Parch        891 non-null    int64
 8   Ticket       891 non-null    object
 9   Fare         891 non-null    float64
 10  Cabin        204 non-null    object
 11  Embarked     889 non-null    object
dtypes: float64(2), int64(5), object(5)
memory usage: 83.7+ KB
# 不妨删除含有缺失年龄的观察
titanic.dropna(subset=['Age'], inplace=True)
#在检查一下数据
titanic.info()
- 输出
<class 'pandas.core.frame.DataFrame'>
Int64Index: 714 entries, 0 to 890
Data columns (total 12 columns):
 #   Column       Non-Null Count  Dtype
---  ------       --------------  -----
 0   PassengerId  714 non-null    int64
 1   Survived     714 non-null    int64
 2   Pclass       714 non-null    int64
 3   Name         714 non-null    object
 4   Sex          714 non-null    object
 5   Age          714 non-null    float64
 6   SibSp        714 non-null    int64
 7   Parch        714 non-null    int64
 8   Ticket       714 non-null    object
 9   Fare         714 non-null    float64
 10  Cabin        185 non-null    object
 11  Embarked     712 non-null    object
dtypes: float64(2), int64(5), object(5)
memory usage: 72.5+ KB
#导入matplotlib库
import matplotlib.pyplot as plt

#解决中文乱码的问题
plt.rcParams["font.sans-serif"] = ["Microsoft YaHei"]

#绘制图形(注意这里需要删除缺失值后进行绘图,否则将没有图形显示)
plt.boxplot(titanic["Age"]
           ,notch=False
           ,sym="."
           ,vert=True
           ,patch_artist=False
           ,meanline=True
           ,showmeans=True
           ,showcaps=True
           ,showbox=True
           ,showfliers=True
           ,boxprops={'color':'black'}
           ,flierprops = {'marker':'o','markerfacecolor':'red','color':'black'} # 设置异常值属性,点的形状、填充色和边框色
           ,meanprops = {'marker':'D','markerfacecolor':'indianred'} # 设置均值点的属性,点的形状、填充色
           ,medianprops = {'linestyle':'--','color':'orange'} # 设置中位数线的属性,线的类型和颜色
           )
# 设置y轴的范围
plt.ylim(0,85)

#显示图形
plt.show()
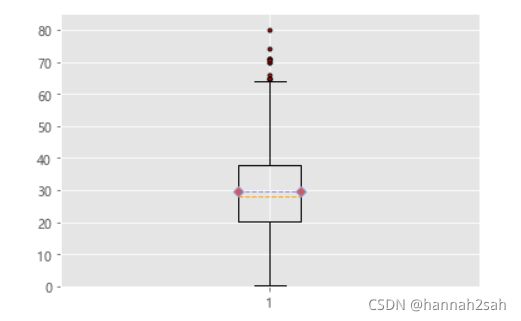
- 对于所有乘客而言,从图中容易发现,乘客的平均年龄在30岁,有四分之一的人低于20岁,另有四分之一的人超过38岁,换句话说,有一半的人,年龄落在20~38岁之间;从均值(红色的菱形)略高于中位数(黄色虚线)来看,说明年龄是有偏的,并且是右偏;同时,我们也会发现一些红色的异常值,这些异常值的年龄均在64岁以上。
不同等级仓的年龄箱线图
# 按舱级排序,为了后面正常显示分组盒形图的顺序
titanic.sort_values(by = 'Pclass', inplace=True)
# 通过for循环将不同仓位的年龄人群分别存储到列表Age变量中
Age = []
Levels = titanic.Pclass.unique()
for Pclass in Levels:
    Age.append(titanic.loc[titanic.Pclass==Pclass,'Age'])
#绘制图形
plt.boxplot(Age
           ,notch=False
           ,sym="."
           ,vert=True
           ,positions=[1,2,3]
           ,patch_artist=True
           ,labels = ['一等舱','二等舱','三等舱'] # 添加具体的标签名称
           ,meanline=True
           ,showmeans=True
           ,showcaps=True
           ,showbox=True
           ,showfliers=True
           ,boxprops={'color':'black'}
           ,flierprops = {'marker':'o','markerfacecolor':'red','color':'black'} # 设置异常值属性,点的形状、填充色和边框色
           ,meanprops = {'marker':'D','markerfacecolor':'indianred'} # 设置均值点的属性,点的形状、填充色
           ,medianprops = {'linestyle':'--','color':'orange'} # 设置中位数线的属性,线的类型和颜色
           )

plt.show()
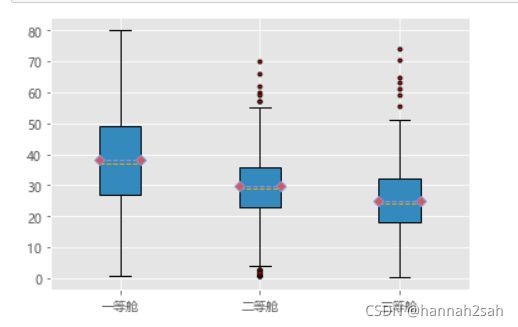
- 如果对人群的年龄按不同的舱位来看,我们会发现一个明显的趋势,就是舱位等级越高的乘客,他们的年龄越高,三种舱位的平均年龄为38、30和25,说明年龄越是偏大一点,他们的经济能力会越强一些,所买的舱位等级可能就会越高一些。同时,在二等舱和三等舱内,乘客的年龄上存在一些异常用户。
总结
- 大部分设置也是在plt.boxplot里面进行设置,但是相比于之前的图,需要进一步处理数据,排除缺失值,否则会出错
- 后续难点在于存在多个箱线图的绘制,需要构建自己需要的数据才能继续绘制箱线图
四、直方图
- 上一部分展示了如何绘制数值型变量的箱线图,展现数据的分布,我们还可以使用直方图来说明,通过图形的长相,就可以快速的判断数据是否近似服从正态分布。之所以我们很关心数据的分布,是因为在统计学中,很多假设条件都会包括正态分布,故使用直方图来定性的判定数据的分布情况,尤其显得重要。这期我们就来介绍Python中如何绘制一个直方图。
- hist函数的参数解读
plt.hist(x
         ,bins=10
         ,range=None
         ,normed=False
         ,weights=None
         ,cumulative=False
         ,bottom=None
         ,histtype='bar'
         ,align='mid'
         ,orientation='vertical'
         ,rwidth=None
         ,log=False
         ,color=None
         ,label=None
         ,stacked=False)

#x:指定要绘制直方图的数据;
#bins:指定直方图条形的个数;
#range:指定直方图数据的上下界,默认包含绘图数据的最大值和最小值;
#normed:是否将直方图的频数转换成频率;
#weights:该参数可为每一个数据点设置权重;
#cumulative:是否需要计算累计频数或频率;
#bottom:可以为直方图的每个条形添加基准线,默认为0;
#histtype:指定直方图的类型,默认为bar,除此还有’barstacked’, ‘step’, ‘stepfilled’;
#align:设置条形边界值的对其方式,默认为mid,除此还有’left’和’right’;
#orientation:设置直方图的摆放方向,默认为垂直方向;
#rwidth:设置直方图条形宽度的百分比;
#log:是否需要对绘图数据进行log变换;
#color:设置直方图的填充色;
#label:设置直方图的标签,可通过legend展示其图例;
#stacked:当有多个数据时,是否需要将直方图呈堆叠摆放,默认水平摆放;
一元直方图的绘制
- 案例:titanic数据集
- 整体乘客的年龄直方图
#导入必要的库
import pandas as pd
#从以下地址导入数据
#将数据框命名为titanic
titanic = pd.read_csv(r"D:\PythonFlie\python\pandas\pandas_exercise\exercise_data\train.csv")
titanic.head()
- 输出
PassengerId	Survived	Pclass	Name	Sex	Age	SibSp	Parch	Ticket	Fare	Cabin	Embarked
0	1	0	3	Braund, Mr. Owen Harris	male	22.0	1	0	A/5 21171	7.2500	NaN	S
1	2	1	1	Cumings, Mrs. John Bradley (Florence Briggs Th...	female	38.0	1	0	PC 17599	71.2833	C85	C
2	3	1	3	Heikkinen, Miss. Laina	female	26.0	0	0	STON/O2. 3101282	7.9250	NaN	S
3	4	1	1	Futrelle, Mrs. Jacques Heath (Lily May Peel)	female	35.0	1	0	113803	53.1000	C123	S
4	5	0	3	Allen, Mr. William Henry	male	35.0	0	0	373450	8.0500	NaN	S
# 检查年龄是否有缺失
titanic.info()
- 输出
<class 'pandas.core.frame.DataFrame'>
RangeIndex: 891 entries, 0 to 890
Data columns (total 12 columns):
 #   Column       Non-Null Count  Dtype
---  ------       --------------  -----
 0   PassengerId  891 non-null    int64
 1   Survived     891 non-null    int64
 2   Pclass       891 non-null    int64
 3   Name         891 non-null    object
 4   Sex          891 non-null    object
 5   Age          714 non-null    float64
 6   SibSp        891 non-null    int64
 7   Parch        891 non-null    int64
 8   Ticket       891 non-null    object
 9   Fare         891 non-null    float64
 10  Cabin        204 non-null    object
 11  Embarked     889 non-null    object
dtypes: float64(2), int64(5), object(5)
memory usage: 83.7+ KB
titanic.dropna(subset = ["Age"],inplace = True)
#导入matplotlib库
import matplotlib.pyplot as plt

#绘制图形
plt.hist(titanic.Age
        ,bins=20
        ,histtype ="barstacked"
        ,align ='mid'
        ,label = '年龄的频数直方图'
        ,color = 'steelblue'
        ,edgecolor = 'k'
        )

#显示图例
plt.legend()

#显示图形
plt.show()
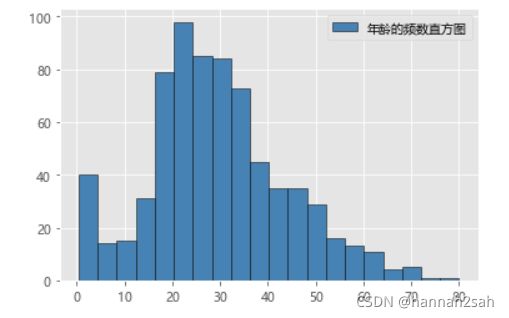
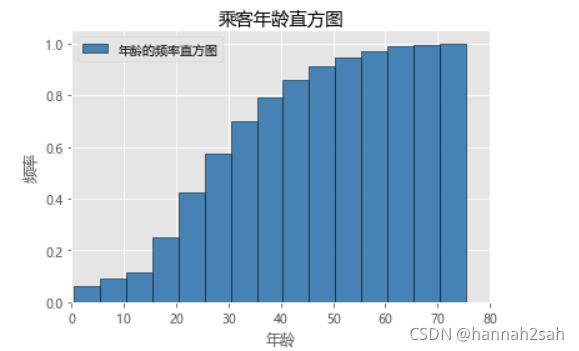
- 上图绘制的是年龄的频数直方图,从整体的分布来看,有点像正态分布,两边低中间高的倒钟形状。除此,我们还可以绘制累计频率直方图,并且设置5岁为组距,如下代码可以表示成:
import numpy as np

#绘制图形
plt.hist(titanic.Age
        ,bins=np.arange(titanic.Age.min(),titanic.Age.max(),5)
        ,density=True
        ,cumulative=True
        ,align ='mid'
        ,label = '年龄的频率直方图'
        ,color = 'steelblue'
        ,edgecolor = 'k'
        )
#设置x轴范围
plt.xlim([0,80])

# 设置坐标轴标签和标题
plt.title('乘客年龄直方图')
plt.xlabel('年龄')
plt.ylabel('频率')

#显示图例
plt.legend()

#显示图形
plt.show()
- plt.hist(titanic.Age,bins=np.arange(0,90,5),normed=True,align =‘mid’,label = ‘年龄的频率直方图’,color = ‘steelblue’,edgecolor = ‘k’)
- 会报’Rectangle’ object has no property 'normed’错
- 去掉normed,改成density(布尔值),意思是开启概率分布(直方图面积为1)
二元直方图的绘制
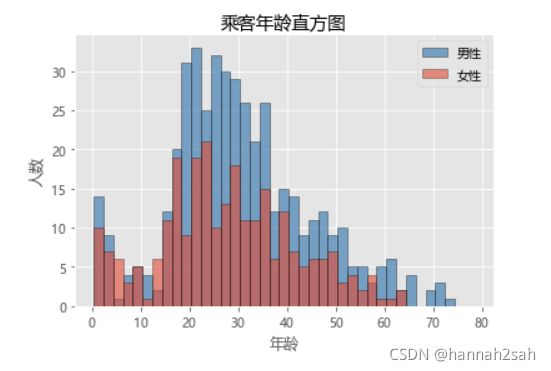
- 上面绘制的直方图都是基于所有乘客的年龄,如果想对比男女乘客的年龄直方图的话,我们可以通过两个hist将不同性别的直方图绘制到一张图内,具体代码如下:
#导入matplotlib库
import matplotlib.pyplot as plt

#绘制图形
plt.hist(titanic.Age[titanic.Sex == 'male']
        ,bins=np.arange(titanic.Age.min(), titanic.Age.max(), 2)
        ,label = "男性"
        ,histtype ="barstacked"
        ,align ='mid'
        ,color = 'steelblue'
        ,edgecolor = 'k'
        ,alpha = 0.7
        )

plt.hist(titanic.Age[titanic.Sex == 'female']
        ,bins=np.arange(titanic.Age.min(), titanic.Age.max(), 2)
        ,label = "女性"
        ,histtype ="barstacked"
        ,align ='mid'
        ,edgecolor = 'k'
        ,alpha = 0.6
        )

# 设置坐标轴标签和标题
plt.title('乘客年龄直方图')
plt.xlabel('年龄')
plt.ylabel('人数')

#显示图例
plt.legend()

#显示图形
plt.show()
- 图中结果反映了,不同年龄组内几乎都是男性乘客比女性乘客要多;同时,也说明男女性别的年龄组分布几乎一致
五、折线图
- 折线图一般是用来表示某个数值变量随着时间的推移而形成的趋势,这种图还是比较常见的,如经济走势图、销售波动图、PV监控图等。在Python的matplotlib模块中,我们可以调用plot函数就能实现折线图的绘制了,先来看看这个函数的一些参数含义。
- plot函数的参数解读
plt.plot(x
         ,y
         ,linestyle
         ,linewidth
         ,color
         ,marker
         ,markersize
         ,markeredgecolor
         ,markerfactcolor
         ,label
         ,alpha)
#x:指定折线图的x轴数据;
#y:指定折线图的y轴数据;
#linestyle:指定折线的类型,可以是实线、虚线、点虚线、点点线等,默认文实线;
#linewidth:指定折线的宽度
#marker:可以为折线图添加点,该参数是设置点的形状;
#markersize:设置点的大小;
#markeredgecolor:设置点的边框色;
#markerfactcolor:设置点的填充色;
#label:为折线图添加标签,类似于图例的作用;
一元折线图的绘制
- 案例:每天进步一点点2015公众号文章阅读人数
#导入数据
import pandas as pd
wechart = pd.read_csv(r"D:\PythonFlie\python\pandas\pandas_exercise\exercise_data\wechart.csv")
wechart.head(-5)
- 输出
	date	article_reading_cnts	article_reading_times	collect_times
0	2017/1/1	37	124	1
1	2017/1/2	51	149	7
2	2017/1/3	93	369	5
3	2017/1/4	58	278	6
4	2017/1/5	58	216	2
...	...	...	...	...
261	2017/9/19	95	231	8
262	2017/9/20	83	230	19
263	2017/9/21	78	364	3
264	2017/9/22	69	248	9
265	2017/9/23	539	799	29
266 rows × 4 columns
#查看数据情况
wechart.info()
#不存在缺失值
- 输出
<class 'pandas.core.frame.DataFrame'>
RangeIndex: 271 entries, 0 to 270
Data columns (total 4 columns):
 #   Column                 Non-Null Count  Dtype
---  ------                 --------------  -----
 0   date                   271 non-null    object
 1   article_reading_cnts   271 non-null    int64
 2   article_reading_times  271 non-null    int64
 3   collect_times          271 non-null    int64
dtypes: int64(3), object(1)
memory usage: 8.6+ KB
#绘制公众号文章阅读人数随时间折线图
#导入对应的库
import matplotlib.pyplot as plt

#解决中文乱码问题
plt.rcParams["font.sans-serif"] = ['Microsoft YaHei']

# 设置图框的大小
fig = plt.figure(figsize=(20,6))

#绘图
plt.plot(wechart.date[wechart.date >= '2017/9/1']
         ,wechart.article_reading_cnts[wechart.date >= '2017/9/1']
         ,linestyle = '-' # 折线类型
         ,linewidth = 2 # 折线宽度
         ,color = 'steelblue' # 折线颜色
         ,marker = 'o' # 点的形状
         ,markersize = 6 # 点的大小
         ,markeredgecolor='black' # 点的边框色
         ,markerfacecolor='brown' # 点的填充色
        )

#设置标题
plt.title("公众号文章九月份阅读人数折线图")


#设置x轴,y轴标题
plt.xlabel("日期/天")
plt.ylabel("人数")


# 为了避免x轴日期刻度标签的重叠,设置x轴刻度自动展现,并且45度倾斜
fig.autofmt_xdate(rotation = 45)

#显示图形
plt.show()
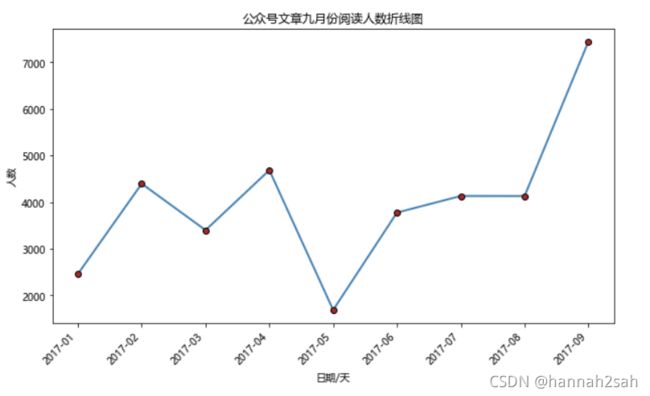
- 发散一下思维:如果做每个月阅读人数总和的折线图,应该怎么做?
from datetime import datetime

#首先把需要的数据弄一下
wechart["月份"] = wechart["date"].apply(lambda a:datetime.strptime(a, '%Y/%m/%d').strftime('%Y-%m'))
wechart.head()
- 输出
	date	article_reading_cnts	article_reading_times	collect_times	月份
0	2017/1/1	37	124	1	2017-01
1	2017/1/2	51	149	7	2017-01
2	2017/1/3	93	369	5	2017-01
3	2017/1/4	58	278	6	2017-01
4	2017/1/5	58	216	2	2017-01
#在将article_reading_cnts根据月份聚合一下
wechart.groupby(by = "月份").aggregate({"article_reading_cnts":sum})
- 输出
	article_reading_cnts
月份
2017-01	2461
2017-02	4397
2017-03	3400
2017-04	4687
2017-05	1688
2017-06	3777
2017-07	4133
2017-08	4132
2017-09	7444
#导入对应的库
import matplotlib.pyplot as plt

#解决中文乱码问题
plt.rcParams["font.sans-serif"] = ['Microsoft YaHei']

# 设置图框的大小
fig = plt.figure(figsize=(10,6))

#绘图
plt.plot(wechart.groupby(by = "月份").aggregate({"article_reading_cnts":sum}).index
         ,wechart.groupby(by = "月份").aggregate({"article_reading_cnts":sum})
         ,linestyle = '-' # 折线类型
         ,linewidth = 2 # 折线宽度
         ,color = 'steelblue' # 折线颜色
         ,marker = 'o' # 点的形状
         ,markersize = 6 # 点的大小
         ,markeredgecolor='black' # 点的边框色
         ,markerfacecolor='brown' # 点的填充色
        )

#设置标题
plt.title("公众号文章九月份阅读人数折线图")


#设置x轴,y轴标题
plt.xlabel("日期/天")
plt.ylabel("人数")


# 为了避免x轴日期刻度标签的重叠,设置x轴刻度自动展现,并且45度倾斜
fig.autofmt_xdate(rotation = 45)

#显示图形
plt.show()
补充:从字符串中提取年月日
#导入时间模块
from datetime import datetime

a = '2017/8/2'
b = datetime.strptime(a, '%Y/%m/%d').strftime('%m-%d')
b
- 输出
'08-02'
一元折线图的绘制—图形优化
#绘制公众号文章阅读人数随时间折线图
#导入对应的库
import matplotlib.pyplot as plt
import matplotlib as mpl

#解决中文乱码问题
plt.rcParams["font.sans-serif"] = ['Microsoft YaHei']

# 设置图框的大小
fig = plt.figure(figsize=(20,6))

#绘图
plt.plot(wechart.date[wechart.date >= '2017/9/1']
         ,wechart.article_reading_cnts[wechart.date >= '2017/9/1']
         ,linestyle = '-' # 折线类型
         ,linewidth = 2 # 折线宽度
         ,color = 'steelblue' # 折线颜色
         ,marker = 'o' # 点的形状
         ,markersize = 6 # 点的大小
         ,markeredgecolor='black' # 点的边框色
         ,markerfacecolor='brown' # 点的填充色
        )

#设置标题
plt.title("公众号文章九月份阅读人数折线图")

#设置x轴,y轴标题
plt.xlabel("日期/天")
plt.ylabel("人数")

# 获取图的坐标信息
ax = plt.gca()
# 设置日期的显示格式
date_format = mpl.dates.DateFormatter("%m-%d")
ax.xaxis.set_major_formatter(date_format)

# 设置x轴显示多少个日期刻度
#xlocator = mpl.ticker.LinearLocator(10)
# 设置x轴每个刻度的间隔天数
xlocator = mpl.ticker.MultipleLocator(2)
ax.xaxis.set_major_locator(xlocator)

# 为了避免x轴日期刻度标签的重叠,设置x轴刻度自动展现,并且45度倾斜
fig.autofmt_xdate(rotation = 45)

#显示图形
plt.show()
多元折线图的绘制
- 如果你需要在一张图形中画上两条折线图,也很简单,只需要在代码中写入两次plot函数即可,其他都不需要改动了。具体可以参考下面的代码逻辑:
#绘制公众号文章阅读人数随时间折线图
#导入对应的库
import matplotlib.pyplot as plt

#解决中文乱码问题
plt.rcParams["font.sans-serif"] = ['Microsoft YaHei']

# 设置图框的大小
fig = plt.figure(figsize=(20,6))

#绘图
plt.plot(wechart.date[wechart.date >= '2017/9/1']
         ,wechart.article_reading_cnts[wechart.date >= '2017/9/1']
         ,linestyle = '-' # 折线类型
         ,linewidth = 2 # 折线宽度
         ,color = 'steelblue' # 折线颜色
         ,marker = 'o' # 点的形状
         ,markersize = 6 # 点的大小
         ,markeredgecolor='black' # 点的边框色
         ,markerfacecolor='brown' # 点的填充色
         ,label = "人数"
        )


#绘图
plt.plot(wechart.date[wechart.date >= '2017/9/1']
         ,wechart.article_reading_times[wechart.date >= '2017/9/1']
         ,linestyle = '-' # 折线类型
         ,linewidth = 2 # 折线宽度
         ,color = '#ff9999' # 折线颜色
         ,marker = 'o' # 点的形状
         ,markersize = 6 # 点的大小
         ,markeredgecolor='black' # 点的边框色
         ,markerfacecolor='brown' # 点的填充色
         ,label = "次数"
        )


#设置标题
plt.title("公众号每天阅读人数和次数趋势图")


#设置x轴,y轴标题
plt.xlabel("日期/天")
plt.ylabel("人数/次数")


#设置图例
plt.legend()

# 为了避免x轴日期刻度标签的重叠,设置x轴刻度自动展现,并且45度倾斜
fig.autofmt_xdate(rotation = 45)

#显示图形
plt.show()
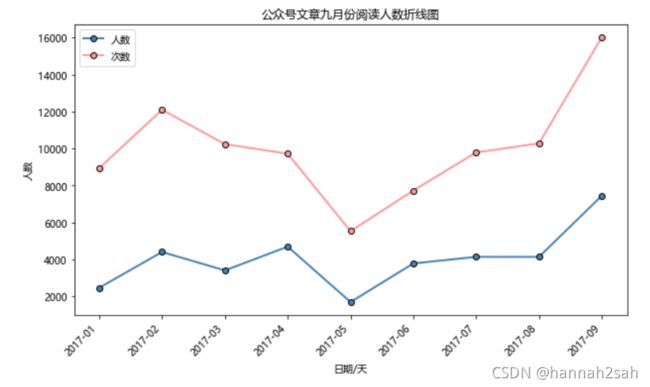
- 两条折线图很完美的展现在一张图中,公众号的阅读人数与次数趋势完全一致,而且具有一定的周期性,即过几天就会有一个大幅上升的波动,这个主要是由于双休日的时候,时间比较空闲,就可以更新并推送文章了。
#导入对应的库
import matplotlib.pyplot as plt

#解决中文乱码问题
plt.rcParams["font.sans-serif"] = ['Microsoft YaHei']

# 设置图框的大小
fig = plt.figure(figsize=(10,6))

#绘图
plt.plot(wechart.groupby(by = "月份").aggregate({"article_reading_cnts":sum}).index
         ,wechart.groupby(by = "月份").aggregate({"article_reading_cnts":sum})
         ,linestyle = '-' # 折线类型
         ,linewidth = 2 # 折线宽度
         ,color = 'steelblue' # 折线颜色
         ,marker = 'o' # 点的形状
         ,markersize = 6 # 点的大小
         ,markeredgecolor='black' # 点的边框色
         ,markerfacecolor='steelblue' # 点的填充色
         ,label = "人数"
        )

plt.plot(wechart.groupby(by = "月份").aggregate({"article_reading_cnts":sum}).index
         ,wechart.groupby(by = "月份").aggregate({"article_reading_times":sum})
         ,linestyle = '-' # 折线类型
         ,linewidth = 2 # 折线宽度
         ,color = '#ff9999' # 折线颜色
         ,marker = 'o' # 点的形状
         ,markersize = 6 # 点的大小
         ,markeredgecolor='black' # 点的边框色
         ,markerfacecolor='#ff9999' # 点的填充色
        ,label = "次数"
        )


#设置标题
plt.title("公众号文章九月份阅读人数折线图")


#设置x轴,y轴标题
plt.xlabel("日期/天")
plt.ylabel("人数")

#设置图例
plt.legend()


# 为了避免x轴日期刻度标签的重叠,设置x轴刻度自动展现,并且45度倾斜
fig.autofmt_xdate(rotation = 45)

#显示图形
plt.show()
总结
- 折线图的制作同条形图以及直方图一样,在原来图的基础上,在添加即可,不同的是直方图与折线图直接添加就可以了,条形图需要设置好相对的位置来展示另一个条形图
六、散点图
- 我们通过折线图可以快速的发现时间序列的趋势图,当然它不仅仅只能用在时间序列中,也可以和其他图形配合使用,可以将折线图绘制到散点图中。散点图可以反映两个变量间的相关关系,即如果存在相关关系的话,它们之间是正向的线性关系还是反向的线性关系?甚至于是非线性关系?在绘制散点图之前,先来介绍一下matplotlib包中的scatter函数用法及参数含义。
plt.scatter(x
            ,y
            ,s=20
            ,c=None
            ,marker='o'
            ,cmap=None
            ,norm=None
            ,vmin=None
            ,vmax=None
            ,alpha=None
            ,linewidths=None
            ,edgecolors=None)
#x:指定散点图的x轴数据;
#y:指定散点图的y轴数据;
#s:指定散点图点的大小,默认为20,通过传入新的变量,实现气泡图的绘制;
#c:指定散点图点的颜色,默认为蓝色;
#marker:指定散点图点的形状,默认为圆形;
#cmap:指定色图,只有当c参数是一个浮点型的数组的时候才起作用;
#norm:设置数据亮度,标准化到0~1之间,使用该参数仍需要c为浮点型的数组;
#vmin、vmax:亮度设置,与norm类似,如果使用了norm则该参数无效;
#alpha:设置散点的透明度;
#linewidths:设置散点边界线的宽度;
#edgecolors:设置散点边界线的颜色;
一般散点图的绘制
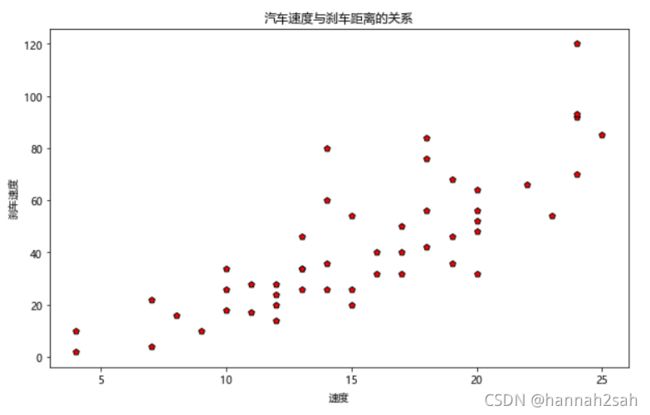
- 案例:汽车速度与刹车距离的关系
import pandas as pd
cars = pd.read_csv(r"D:\PythonFlie\python\pandas\pandas_exercise\exercise_data\cars.csv")
cars.head()
- 输出
speed	dist
0	4	2
1	4	10
2	7	4
3	7	22
4	8	16
#查看数据是否存在缺失,没有缺失数据
cars.info()
- 输出
#查看数据是否存在缺失,没有缺失数据
cars.info()
#查看数据是否存在缺失,没有缺失数据
cars.info()
<class 'pandas.core.frame.DataFrame'>
RangeIndex: 50 entries, 0 to 49
Data columns (total 2 columns):
 #   Column  Non-Null Count  Dtype
---  ------  --------------  -----
 0   speed   50 non-null     int64
 1   dist    50 non-null     int64
dtypes: int64(2)
memory usage: 928.0 bytes
#导入matplotlib库
import matplotlib.pyplot as plt

#解决中文乱码问题
plt.rcParams["font.sans-serif"] = ['Microsoft YaHei']

#设置图框大小
plt.figure(figsize=(10,6))

#绘图
plt.scatter(cars.speed
            ,cars.dist
            ,color = "r"
            ,marker = "p"
            ,edgecolors="k"
            )

#设置标题
plt.title("汽车速度与刹车距离的关系")

#设置x轴,y轴标题
plt.xlabel("速度")
plt.ylabel("刹车速度")


#显示图像
plt.show()
- 这样一张简单的散点图就呈现出来了,很明显的发现,汽车的刹车速度与刹车距离存在正相关关系,即随着速度的增加,刹车距离也在增加。其实这个常识不用绘图都能够发现,关键是通过这个简单的案例,让大家学会如何通过python绘制一个散点图。如果你需要画的散点图,是根据不同的类别进行绘制,如按不同的性别,将散点图区分开来等。这样的散点图该如何绘制呢?
分组散点图的绘制
#导入对应数据
import pandas as pd
iris= pd.read_csv(r"D:\PythonFlie\python\pandas\pandas_exercise\exercise_data\iris.csv")
iris.head()
- 输出
	5.1	3.5	1.4	0.2	Iris-setosa
0	4.9	3.0	1.4	0.2	Iris-setosa
1	4.7	3.2	1.3	0.2	Iris-setosa
2	4.6	3.1	1.5	0.2	Iris-setosa
3	5.0	3.6	1.4	0.2	Iris-setosa
4	5.4	3.9	1.7	0.4	Iris-setosa
#修改列名
iris.rename(columns={'5.1':'sepal_length','3.5':'sepal_width','1.4':'petal_length','0.2':'petal_width','Iris-setosa':'classes'},inplace = True)
iris.head()
- 输出
	sepal_length	sepal_width	petal_length	petal_width	classes
0	4.9	3.0	1.4	0.2	Iris-setosa
1	4.7	3.2	1.3	0.2	Iris-setosa
2	4.6	3.1	1.5	0.2	Iris-setosa
3	5.0	3.6	1.4	0.2	Iris-setosa
4	5.4	3.9	1.7	0.4	Iris-setosa
#导入matplotlib库
import matplotlib.pyplot as plt

#解决中文乱码问题
plt.rcParams["font.sans-serif"] = ['Microsoft YaHei']

#设置图框大小
plt.figure(figsize=(10,6))

#绘图
plt.scatter(iris.sepal_length
            ,iris.sepal_width
            ,color = "b"
            ,marker = "o"
            ,edgecolors="k"
            )

#设置标题
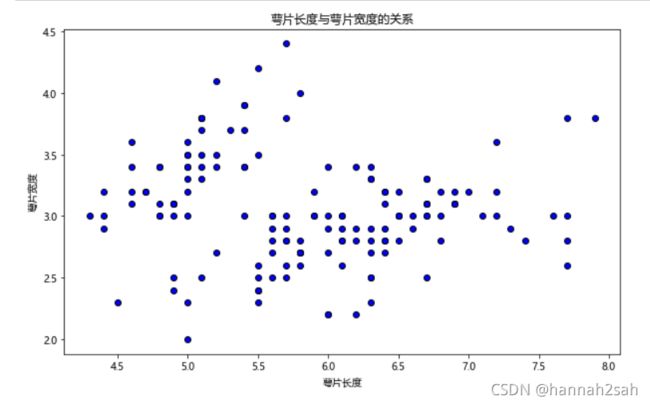
plt.title("萼片长度与萼片宽度的关系")

#设置x轴,y轴标题
plt.xlabel("萼片长度")
plt.ylabel("萼片宽度")


#显示图像
plt.show()
# 自定义颜色
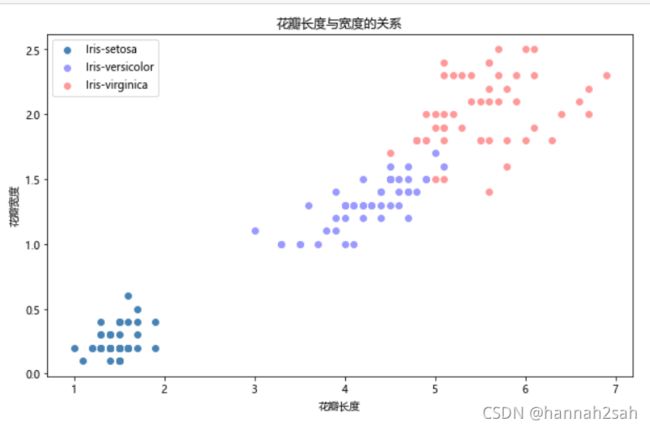
colors = ['steelblue', '#9999ff', '#ff9999']# 三种不同的花品种
Species = iris.classes.unique()

#设置图框大小
plt.figure(figsize=(10,6))

# 通过循环的方式,完成分组散点图的绘制
for i in range(len(Species)):
    plt.scatter(iris.loc[iris.classes == Species[i], 'petal_length']
                ,iris.loc[iris.classes == Species[i], 'petal_width']
                ,s = 35
                ,c = colors[i]
                ,label = Species[i]
               )

# 添加轴标签和标题
plt.title('花瓣长度与宽度的关系')
plt.xlabel('花瓣长度')
plt.ylabel('花瓣宽度')


# 添加图例
plt.legend(loc = 'upper left')

# 显示图形
plt.show()
七、雷达图
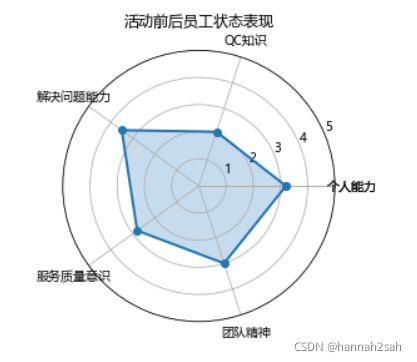
- 雷达图可以很好刻画出某些指标的横向或纵向的对比关系,例如近三年营业额、客单价、新客招募等指标的同比情况对比,完全就可以通过雷达图让数据一目了然。很不幸的是,matplotlib模块中并没有特制雷达图的封装函数,我们只能换一只思路来实现了。
#导入matplotlib库
import matplotlib.pyplot as plt

#解决中文乱码问题
plt.rcParams["font.sans-serif"] = ['Microsoft YaHei']

# 构造数据
values = [3.2,2.1,3.5,2.8,3]
feature = ['个人能力','QC知识','解决问题能力','服务质量意识','团队精神']

import numpy as np
N = len(values)
# 设置雷达图的角度,用于平分切开一个圆面
angles=np.linspace(0, 2*np.pi, N, endpoint=False)

# 为了使雷达图一圈封闭起来,需要下面的步骤
values=np.concatenate((values,[values[0]]))
angles=np.concatenate((angles,[angles[0]]))

# 绘图
fig=plt.figure()

# 这里一定要设置为极坐标格式
ax = fig.add_subplot(111, polar=True)

# 绘制折线图
ax.plot(angles, values, 'o-', linewidth=2)

# 填充颜色
ax.fill(angles, values, alpha=0.25)

# 添加每个特征的标签
ax.set_thetagrids(angles * 180/np.pi,['个人能力','QC知识','解决问题能力','服务质量意识','团队精神','个人能力'])

# 设置雷达图的范围
ax.set_ylim(0,5)

# 添加标题
plt.title('活动前后员工状态表现')

# 添加网格线
ax.grid(True)

# 显示图形
plt.show()
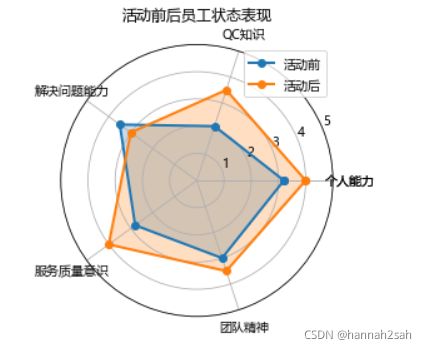
- 非常简单吧,一张雷达图就这么造出来了。其思想也非常简单,即先把常见的二维坐标变换成极坐标,然后在极坐标的基础上绘制折线图,如果需要填充颜色的话就是要fill方法。一般而言这样的雷达图没有什么意义,因为我们用雷达图通常是要实现多个对象的对比,所以,该如何绘制多条线的雷达图呢?可以参考下面的代码:
#导入matplotlib库
import matplotlib.pyplot as plt

#解决中文乱码问题
plt.rcParams["font.sans-serif"] = ['Microsoft YaHei']

# 构造数据
values = [3.2,2.1,3.5,2.8,3]
values1 = [4,3.5,3,4,3.5]
feature = ['个人能力','QC知识','解决问题能力','服务质量意识','团队精神']

import numpy as np
N = len(values)
# 设置雷达图的角度,用于平分切开一个圆面
angles=np.linspace(0, 2*np.pi, N, endpoint=False)

# 为了使雷达图一圈封闭起来,需要下面的步骤
values=np.concatenate((values,[values[0]]))
values1=np.concatenate((values1,[values1[0]]))
angles=np.concatenate((angles,[angles[0]]))

# 绘图
fig=plt.figure()

# 这里一定要设置为极坐标格式
ax = fig.add_subplot(111, polar=True)

# 绘制折线图
ax.plot(angles, values, 'o-', linewidth=2,label = "活动前")
ax.plot(angles, values1, 'o-', linewidth=2,label = "活动后")


# 填充颜色
ax.fill(angles, values, alpha=0.25)
ax.fill(angles, values1, alpha=0.25)

# 添加每个特征的标签
ax.set_thetagrids(angles * 180/np.pi,['个人能力','QC知识','解决问题能力','服务质量意识','团队精神','个人能力'])

# 设置雷达图的范围
ax.set_ylim(0,5)

# 添加标题
plt.title('活动前后员工状态表现')

# 添加网格线
ax.grid(True)

#显示图例
plt.legend(loc = 'upper right')

# 显示图形
plt.show()
- 虽然matplotlib模块没有封装好的雷达图命令,但pygal模块则提供了更加简单的雷达图函数,我们也尝试着借助这个模块实现雷达图的绘制。
# 导入第三方模块
import pygal

# 调用Radar这个类,并设置雷达图的填充,及数据范围
radar_chart = pygal.Radar(fill = True, range=(0,5))

# 添加雷达图的标题
radar_chart.title = '活动前后员工状态表现'

# 添加雷达图各顶点的含义
radar_chart.x_labels = ['个人能力','QC知识','解决问题能力','服务质量意识','团队精神']

# 绘制两条雷达图区域
radar_chart.add('活动前', [3.2,2.1,3.5,2.8,3])
radar_chart.add('活动后', [4,4.1,4.5,4,4.1])

# 保存图像
radar_chart.render_to_file('radar_chart.svg')
八、面积图
- 一般来说,折线图表达的思想是研究某个时间序列的趋势。
- 往往一条折线图可以根据某个分组变量进行拆分,比如今年的销售额可以拆分成各个事业线的贡献;流量可以拆分为各个渠道;物流总量可以拆分为公路运输、铁路运输、海运和空运。按照这个思路可以将一条折线图拆分成多条折线图,直观的发现各个折线图的趋势,但遗憾的是不能得知总量的趋势。
- 为了解决这个问题,我们可以借助matplotlib中的stackplot函数绘制面积图来直观表达分组趋势和总量趋势。
stackplot(x,*args,**kargs)
#x指定面积图的x轴数据
#*args为可变参数,可以接受任意多的y轴数据,即各个拆分的数据对象
#**kargs为关键字参数,可以通过传递其他参数来修饰面积图,如标签、颜色
#可用的关键字参数:
#labels:以列表的形式传递每一块面积图包含的标签,通过图例展现
#colors:设置不同的颜色填充面积图
面积图绘制
#首先来绘制折线图
#导入matplotlib库
import matplotlib.pyplot as plt

#解决中文乱码的问题
plt.rcParams["font.sans-serif"] = ['Microsoft YaHei']

#设置图框大小
plt.figure(figsize=(15,6))

#创建数据
x = ["一月","二月","三月","四月","五月","六月","七月","八月"]
y = [[31058,28121,32185,30133,30304,29934,31002,31590]
      ,[255802,179276,285446,309576,319713,320028,319809,331077]
      ,[52244,46482,59688,54728,55813,59054,57253,57583]]
labels = ["铁路","公路","水运"]


#绘图
for i in range(3):
    plt.plot(x
             ,y[i]
             ,marker = 'o'
             ,linewidth = 2 # 设置线的宽度
             ,label=labels[i]
            )

# 添加标题和坐标轴标签
plt.title('2017年各运输渠道的运输量')
plt.ylabel('运输量(万吨)')

#显示图例
plt.legend()

plt.show()
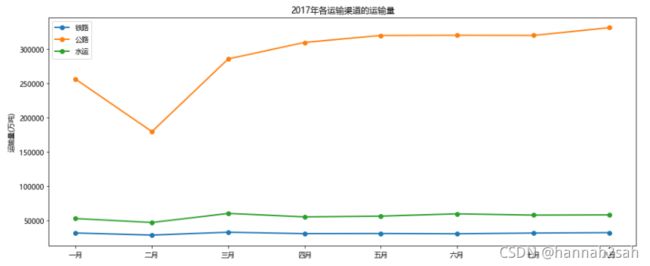
- 这就是绘制分组的折线图思想,虽然折线图能够反映各个渠道的运输量随月份的波动趋势,但无法观察到1月份到8月份的各自总量。接下来我们看看面积图的展现。
#设置图框大小
plt.figure(figsize=(15,6))

#创建数据
x = ["一月","二月","三月","四月","五月","六月","七月","八月"]
y = [[31058,28121,32185,30133,30304,29934,31002,31590]
      ,[255802,179276,285446,309576,319713,320028,319809,331077]
      ,[52244,46482,59688,54728,55813,59054,57253,57583]]
labels = ["铁路","公路","水运"]

# 定义各区块面积的含义
colors = ['#ff9999','#9999ff','#cc1234']

# 绘制面积图
plt.stackplot(x, # x轴
              y[0],y[1],y[2], # 可变参数,接受多个y
              labels = labels, # 定义各区块面积的含义
              colors = colors # 设置各区块的填充色
             )

# 添加标题和坐标轴标签
plt.title('2017年各运输渠道的运输量')
plt.ylabel('累积运输量(万吨)')

# 显示图例(即显示labels的效果)
plt.legend(loc = 'upper left')

# 显示图形
plt.show()
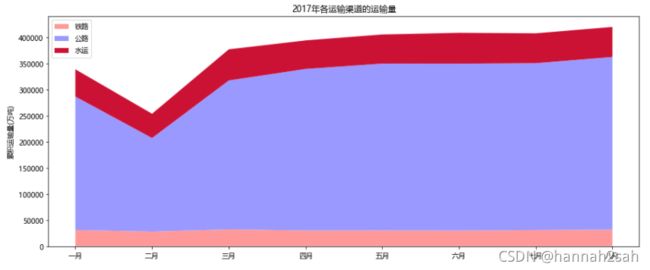
- 一个stackplot函数就能解决问题,而且具有很强的定制化。从上面的面积图就可以清晰的发现两个方面的信息,一个是各渠道运输量的趋势,另一个是则可以看见各月份的总量趋势。所以,我们在可视化的过程中要尽可能的为阅读者输出简单而信息量丰富的图形。
九、热力图
- 所谓的填充表格热力图就是将原本为数字表(数组)的单元格以颜色来填充,颜色的深浅表示数值的大小。我想,对于这样的图来说,总比直接看密密麻麻的数值表要轻松的多吧,毕竟颜色感官比数字感官要直接,要具有更强的冲击。除了填充表格热力图,还有更为常见的地图热力图等。那填充表格热力图是如何应用Python来实现的呢?就让我们手把手的进行讲解吧~
填充热力图的绘制
#导入第三方库
import pandas as pd
import numpy as np
import calendar
import datetime

#创建数据
d = {"date":pd.date_range(start='2021-09-01',periods=30)
    ,"high":[36,32,30,31,33,32,29,28,30,32
             ,26,28,29,25,26,28,29,29,18,33
             ,31,34,35,31,32,32,34,29,30,30]}
df = pd.DataFrame(d)

# 数据处理
# 由日期型数据衍生出weekday
df['weekday'] = df.date.apply(pd.datetime.weekday)

# 由日期型数据计算week_of_month,即当前日期在本月中是第几周
# 由于没有现成的函数,这里自定义一个函数来计算week_of_month
def week_of_month(tgtdate):
    # 由日期型参数tgtdate计算该月的天数
    days_this_month = calendar.mdays[tgtdate.month]    # 通过循环当月的所有天数,找出第二周的第一个日期
    for i in range(1, days_this_month + 1):
        d = datetime.datetime(tgtdate.year, tgtdate.month, i)
        if d.day - d.weekday() > 0:
            startdate = d
            break
    # 返回日期所属月份的第一周
    return (tgtdate - startdate).days //7 + 1


df['week_of_month'] = df.date.apply(week_of_month)
df.head()
- 输出
	date	high	weekday	week_of_month
0	2021-09-01	36	2	0
1	2021-09-02	32	3	0
2	2021-09-03	30	4	0
3	2021-09-04	31	5	0
4	2021-09-05	33	6	0
基于matplotlib绘制热力图
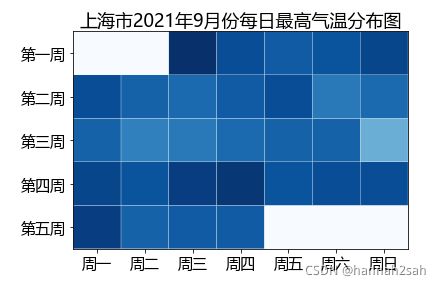
- 其实,我需要绘制的是一个数据表,只不过把表中的每一个单元格用颜色填充起来。而表的结构是:列代表周一到周日,行代表9月份第一周到第五周。很显然,我们刚刚完成的数据并不符合这样的结构,故需要通过pandas模块中的pivot_table函数制作一个透视表,然后才可以绘图。关于热力图,我们可以使用matplotlib模块中的pcolor函数,具体我们可以看下方的绘图语句:
# 构建数据表(日历)
target = pd.pivot_table(data = df.iloc[:,1:],values = 'high',
                        index = 'week_of_month', columns = 'weekday')
target

# 缺失值填充(不填充的话pcolor函数无法绘制)
target.fillna(0,inplace=True)
# 删除表格的索引名称
target.index.name = None
# 对索引排序(为了让“第一周”到“第五周”的刻度从y轴的高到底显示)
target.sort_index(ascending=False, inplace=True)


# 设置中文和负号正常显示
plt.rcParams['font.sans-serif'] = 'Microsoft YaHei'
plt.rcParams['axes.unicode_minus'] = False

plt.pcolor(target, # 指定绘图数据
           cmap=plt.cm.Blues, # 指定填充色
           edgecolors = 'white' # 指点单元格之间的边框色
          )

# 添加x轴和y轴刻度标签(加0.5是为了让刻度标签居中显示)
plt.xticks(np.arange(7)+0.5,['周一','周二','周三','周四','周五','周六','周日'])
plt.yticks(np.arange(5)+0.5,['第五周','第四周','第三周','第二周','第一周'])

# 添加标题
plt.title('上海市2021年9月份每日最高气温分布图')

# 显示图形
plt.show()
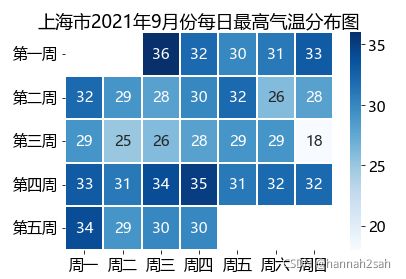
- 绘图过程中发现几个问题:
- 1)绘图用的数据,不能包含缺失值,否则填充图是绘制不出来的,所有需要对缺失值做填充处理;
- 2)最终的图例无法实现,即颜色的深浅,代表了具体的数值范围是什么?
- 3)不方便将具体的温度值显示在每个单元格内;
- 为解决上面的三个问题,我们借助于seaborn模块中的heatmap函数重新绘制一下热力图,而且这些问题在heatmap函数看来根本不算问题。
基于seaborn绘制热力图
- 为解决上面的三个问题,我们借助于seaborn模块中的heatmap函数重新绘制一下热力图,而且这些问题在heatmap函数看来根本不算问题。
import seaborn as sns

# 通过透视图函数形成绘图数据
target = pd.pivot_table(data = df.iloc[:,1:],values = 'high',
                        index = 'week_of_month', columns = 'weekday')

# 绘图
ax = sns.heatmap(target, # 指定绘图数据
                 cmap=plt.cm.Blues, # 指定填充色
                 linewidths=.1, # 设置每个单元方块的间隔
                 annot=True # 显示数值
                )

# 添加x轴刻度标签(加0.5是为了让刻度标签居中显示)
plt.xticks(np.arange(7)+0.5,['周一','周二','周三','周四','周五','周六','周日'])
# 可以将刻度标签置于顶部显示
# ax.xaxis.tick_top()

# 添加y轴刻度标签
plt.yticks(np.arange(5)+0.5,['第一周','第二周','第三周','第四周','第五周'])
# 旋转y刻度0度,即水平显示
plt.yticks(rotation = 0)

# 设置标题和坐标轴标签
ax.set_title('上海市2021年9月份每日最高气温分布图')
ax.set_xlabel('')
ax.set_ylabel('')

# 显示图形
plt.show()
十、树地图
- 用可视化的方法来表达离散变量的数值情况,不仅仅可以使用条形图、饼图、热力图,我们还可以借助于树地图来完成。树地图的思想就是通过方块的面积来表示,面积越大,其代表的值就越大,反之亦然。今天要跟大家分享的就是如何通过Ptyhon这个工具,完成树地图的绘制。
squarify.plot函数语法及参数
- 在Python中,可以借助于squarify包来绘制,即squarify.plot函数。首先,我们来看一下这个函数的语法及参数含义:
squarify.plot(sizes,
            norm_x=100,
            norm_y=100,
            color=None,
            label=None,
            value=None,
            alpha,
            **kwargs)
#sizes:指定离散变量各水平对应的数值,即反映树地图子块的面积大小;
#norm_x:默认将x轴的范围限定在0-100之内;
#norm_y:默认将y轴的范围限定在0-100之内;
#color:自定义设置树地图子块的填充色;
#label:为每个子块指定标签;
#value:为每个子块添加数值大小的标签;
#alpha:设置填充色的透明度;
#**kwargs:关键字参数,与条形图的关键字参数类似,如设置边框色、边框粗细等;
树地图的绘制
# 导入第三方包
import squarify
import matplotlib.pyplot as plt

#中文及负号处理办法
plt.rcParams['font.sans-serif'] = 'Microsoft YaHei'
plt.rcParams['axes.unicode_minus'] = False


# 创建数据
name = ['国内增值税','国内消费税','企业所得税','个人所得税','进口增值税、消费税'
        ,'出口退税','城市维护建设税', '车辆购置税','印花税','资源税','土地和房税','车船税烟叶税等']
income = [3908,856,801,868,1361,1042,320,291,175,111,414,63]

#设置图表大小
plt.figure(figsize = (20,6))

# 绘图
colors = ['steelblue','#9999ff','red','indianred','green','yellow','orange']
plot = squarify.plot(sizes = income, # 指定绘图数据
                     label = name, # 指定标签
                     color = colors, # 指定自定义颜色
                     alpha = 0.6, # 指定透明度
                     value = income, # 添加数值标签
                     edgecolor = 'white', # 设置边界框为白色
                     linewidth =3 # 设置边框宽度为3
                    )
# 设置标签大小
plt.rc('font', size=15)

# 设置标题大小
plot.set_title('2017年8月中央财政收支情况',fontdict = {'fontsize':15})

# 去除坐标轴
plt.axis('off')

# 去除上边框和右边框刻度
plt.tick_params(top = 'off', right = 'off')

# 显示图形
plt.show()
