sklearn 小白抱佛脚笔记4: 无监督学习
Unsupervised learning: seeking representations of the data
- 类聚:
-
- k-means 类聚
- Hierarchical agglomerative clustering: Ward 分层类聚算法(HAC): Ward
-
- 1. 聚集思路: 同类的尽量聚集在一块
- 2. 分隔思路: 不同类尽量彼此远离
- 联系约束类聚
- Feature agglomeration 特征块
- Decompositions: from a signal to components and loadings 分解
-
- 主成分分析: Principal component analysis: PCA
- 独立成分分析:Independent Component Analysis: ICA
为了帮朋友搞定个作业, 没学过现在只能临时抱佛脚, 做个笔记方便后面回查.
类聚:
- 目的就是为了把数据 化分 成没有标签的类, 其实它是分离数据的, 而不是说把数据放到哪一类里的
k-means 类聚
>>> from sklearn import cluster, datasets
>>> X_iris, y_iris = datasets.load_iris(return_X_y=True)

>>> k_means = cluster.KMeans(n_clusters=3)
>>> k_means.fit(X_iris)
KMeans(n_clusters=3)
>>> print(k_means.labels_[::10])
[1 1 1 1 1 0 0 0 0 0 2 2 2 2 2]
>>> print(y_iris[::10])
[0 0 0 0 0 1 1 1 1 1 2 2 2 2 2]
完整的例子:
print(__doc__)


# Code source: Gaël Varoquaux
# Modified for documentation by Jaques Grobler
# License: BSD 3 clause

import numpy as np
import matplotlib.pyplot as plt
# Though the following import is not directly being used, it is required
# for 3D projection to work
from mpl_toolkits.mplot3d import Axes3D

from sklearn.cluster import KMeans
from sklearn import datasets

np.random.seed(5)

iris = datasets.load_iris()
X = iris.data
y = iris.target

estimators = [('k_means_iris_8', KMeans(n_clusters=8)),
              ('k_means_iris_3', KMeans(n_clusters=3)),
              ('k_means_iris_bad_init', KMeans(n_clusters=3, n_init=1,
                                               init='random'))]

fignum = 1
titles = ['8 clusters', '3 clusters', '3 clusters, bad initialization']
for name, est in estimators:
    fig = plt.figure(fignum, figsize=(4, 3))
    ax = Axes3D(fig, rect=[0, 0, .95, 1], elev=48, azim=134)
    est.fit(X)
    labels = est.labels_

    ax.scatter(X[:, 3], X[:, 0], X[:, 2],
               c=labels.astype(np.float), edgecolor='k')

    ax.w_xaxis.set_ticklabels([])
    ax.w_yaxis.set_ticklabels([])
    ax.w_zaxis.set_ticklabels([])
    ax.set_xlabel('Petal width')
    ax.set_ylabel('Sepal length')
    ax.set_zlabel('Petal length')
    ax.set_title(titles[fignum - 1])
    ax.dist = 12
    fignum = fignum + 1

# Plot the ground truth
fig = plt.figure(fignum, figsize=(4, 3))
ax = Axes3D(fig, rect=[0, 0, .95, 1], elev=48, azim=134)

for name, label in [('Setosa', 0),
                    ('Versicolour', 1),
                    ('Virginica', 2)]:
    ax.text3D(X[y == label, 3].mean(),
              X[y == label, 0].mean(),
              X[y == label, 2].mean() + 2, name,
              horizontalalignment='center',
              bbox=dict(alpha=.2, edgecolor='w', facecolor='w'))
# Reorder the labels to have colors matching the cluster results
y = np.choose(y, [1, 2, 0]).astype(np.float)
ax.scatter(X[:, 3], X[:, 0], X[:, 2], c=y, edgecolor='k')

ax.w_xaxis.set_ticklabels([])
ax.w_yaxis.set_ticklabels([])
ax.w_zaxis.set_ticklabels([])
ax.set_xlabel('Petal width')
ax.set_ylabel('Sepal length')
ax.set_zlabel('Petal length')
ax.set_title('Ground Truth')
ax.dist = 12

fig.show()
这里有个提醒, 就是不管怎么调都不可能保证分类出来的结果就百分百对, 类聚从另一方面来说就是选少量的样例来压缩信息, 解决的问题也叫向量量化, 一般可以用来分离色彩.
这里是个例子:
print(__doc__)


# Code source: Gaël Varoquaux
# Modified for documentation by Jaques Grobler
# License: BSD 3 clause

import numpy as np
import scipy as sp
import matplotlib.pyplot as plt

from sklearn import cluster


try:  # SciPy >= 0.16 have face in misc
    from scipy.misc import face
    face = face(gray=True)
except ImportError:
    face = sp.face(gray=True)

n_clusters = 5
np.random.seed(0)

X = face.reshape((-1, 1))  # We need an (n_sample, n_feature) array
k_means = cluster.KMeans(n_clusters=n_clusters, n_init=4)
k_means.fit(X)
values = k_means.cluster_centers_.squeeze()
labels = k_means.labels_

# create an array from labels and values
face_compressed = np.choose(labels, values)
face_compressed.shape = face.shape

vmin = face.min()
vmax = face.max()

# original face
plt.figure(1, figsize=(3, 2.2))
plt.imshow(face, cmap=plt.cm.gray, vmin=vmin, vmax=256)

# compressed face
plt.figure(2, figsize=(3, 2.2))
plt.imshow(face_compressed, cmap=plt.cm.gray, vmin=vmin, vmax=vmax)

# equal bins face
regular_values = np.linspace(0, 256, n_clusters + 1)
regular_labels = np.searchsorted(regular_values, face) - 1
regular_values = .5 * (regular_values[1:] + regular_values[:-1])  # mean
regular_face = np.choose(regular_labels.ravel(), regular_values, mode="clip")
regular_face.shape = face.shape
plt.figure(3, figsize=(3, 2.2))
plt.imshow(regular_face, cmap=plt.cm.gray, vmin=vmin, vmax=vmax)

# histogram
plt.figure(4, figsize=(3, 2.2))
plt.clf()
plt.axes([.01, .01, .98, .98])
plt.hist(X, bins=256, color='.5', edgecolor='.5')
plt.yticks(())
plt.xticks(regular_values)
values = np.sort(values)
for center_1, center_2 in zip(values[:-1], values[1:]):
    plt.axvline(.5 * (center_1 + center_2), color='b')

for center_1, center_2 in zip(regular_values[:-1], regular_values[1:]):
    plt.axvline(.5 * (center_1 + center_2), color='b', linestyle='--')

plt.show()
Hierarchical agglomerative clustering: Ward 分层类聚算法(HAC): Ward
一般的类聚其实无非两种思路(很多时候神经网络里设计loss函数也是这么两个思路):
1. 聚集思路: 同类的尽量聚集在一块
又下至上的思路: 每一个样本从它们自身的簇开始, 然后慢慢合并去最小化同类簇之间的间隔, 这种情况一般适合用在簇类少的情况, 当簇的种类数量多的时候, 计算量就会爆炸
2. 分隔思路: 不同类尽量彼此远离
这个是从上往下的思路: 所有样本从同一个簇出发, 然后慢慢分隔成下一级的几个簇然后又是下一级的几个簇, 对于簇数量多的情况,这玩意儿也很慢也很吃酸梨
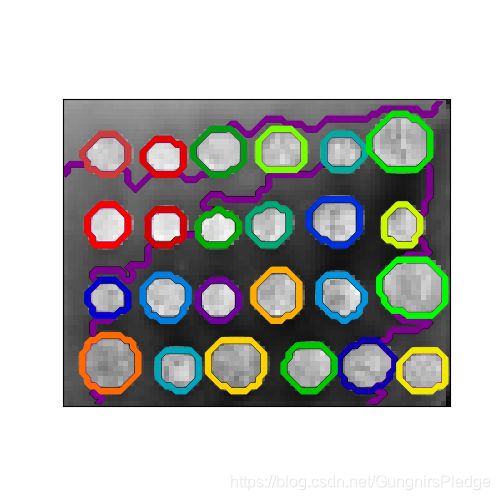
联系约束类聚
这里有两个可视化的例子:
# Author : Vincent Michel, 2010
#          Alexandre Gramfort, 2011
# License: BSD 3 clause

print(__doc__)

import time as time

import numpy as np
from scipy.ndimage.filters import gaussian_filter

import matplotlib.pyplot as plt

import skimage
from skimage.data import coins
from skimage.transform import rescale

from sklearn.feature_extraction.image import grid_to_graph
from sklearn.cluster import AgglomerativeClustering
from sklearn.utils.fixes import parse_version

# these were introduced in skimage-0.14
if parse_version(skimage.__version__) >= parse_version('0.14'):
    rescale_params = {'anti_aliasing': False, 'multichannel': False}
else:
    rescale_params = {}

# #############################################################################
# Generate data
orig_coins = coins()

# Resize it to 20% of the original size to speed up the processing
# Applying a Gaussian filter for smoothing prior to down-scaling
# reduces aliasing artifacts.
smoothened_coins = gaussian_filter(orig_coins, sigma=2)
rescaled_coins = rescale(smoothened_coins, 0.2, mode="reflect",
                         **rescale_params)

X = np.reshape(rescaled_coins, (-1, 1))

# #############################################################################
# Define the structure A of the data. Pixels connected to their neighbors.
connectivity = grid_to_graph(*rescaled_coins.shape)

# #############################################################################
# Compute clustering
print("Compute structured hierarchical clustering...")
st = time.time()
n_clusters = 27  # number of regions
ward = AgglomerativeClustering(n_clusters=n_clusters, linkage='ward',
                               connectivity=connectivity)
ward.fit(X)
label = np.reshape(ward.labels_, rescaled_coins.shape)
print("Elapsed time: ", time.time() - st)
print("Number of pixels: ", label.size)
print("Number of clusters: ", np.unique(label).size)

# #############################################################################
# Plot the results on an image
plt.figure(figsize=(5, 5))
plt.imshow(rescaled_coins, cmap=plt.cm.gray)
for l in range(n_clusters):
    plt.contour(label == l,
                colors=[plt.cm.nipy_spectral(l / float(n_clusters)), ])
plt.xticks(())
plt.yticks(())
plt.show()
Feature agglomeration 特征块
我们可以减少维度来避免维度灾难, 特征块的作用就是合并相同的特征: This approach can be implemented by clustering in the feature direction, in other words clustering the transposed data.
>>> digits = datasets.load_digits()
>>> images = digits.images
>>> X = np.reshape(images, (len(images), -1))
>>> connectivity = grid_to_graph(*images[0].shape)

>>> agglo = cluster.FeatureAgglomeration(connectivity=connectivity,
...                                      n_clusters=32)
>>> agglo.fit(X)
FeatureAgglomeration(connectivity=..., n_clusters=32)
>>> X_reduced = agglo.transform(X)

>>> X_approx = agglo.inverse_transform(X_reduced)
>>> images_approx = np.reshape(X_approx, images.shape)
下面是个例子:
print(__doc__)

# Code source: Gaël Varoquaux
# Modified for documentation by Jaques Grobler
# License: BSD 3 clause

import numpy as np
import matplotlib.pyplot as plt

from sklearn import datasets, cluster
from sklearn.feature_extraction.image import grid_to_graph

digits = datasets.load_digits()
images = digits.images
X = np.reshape(images, (len(images), -1))
connectivity = grid_to_graph(*images[0].shape)

agglo = cluster.FeatureAgglomeration(connectivity=connectivity,
                                     n_clusters=32)

agglo.fit(X)
X_reduced = agglo.transform(X)

X_restored = agglo.inverse_transform(X_reduced)
images_restored = np.reshape(X_restored, images.shape)
plt.figure(1, figsize=(4, 3.5))
plt.clf()
plt.subplots_adjust(left=.01, right=.99, bottom=.01, top=.91)
for i in range(4):
    plt.subplot(3, 4, i + 1)
    plt.imshow(images[i], cmap=plt.cm.gray, vmax=16, interpolation='nearest')
    plt.xticks(())
    plt.yticks(())
    if i == 1:
        plt.title('Original data')
    plt.subplot(3, 4, 4 + i + 1)
    plt.imshow(images_restored[i], cmap=plt.cm.gray, vmax=16,
               interpolation='nearest')
    if i == 1:
        plt.title('Agglomerated data')
    plt.xticks(())
    plt.yticks(())

plt.subplot(3, 4, 10)
plt.imshow(np.reshape(agglo.labels_, images[0].shape),
           interpolation='nearest', cmap=plt.cm.nipy_spectral)
plt.xticks(())
plt.yticks(())
plt.title('Labels')
plt.show()

有些模型有transform 方法, 这个方法可以用来给数据集降维
Decompositions: from a signal to components and loadings 分解
Components and loadings
If X is our multivariate data, then the problem that we are trying to solve is to rewrite it on a different observational basis: we want to learn loadings L and a set of components C such that X = L C. Different criteria exist to choose the components
主成分分析: Principal component analysis: PCA
降维的一种方法
print(__doc__)

# Authors: Gael Varoquaux
#          Jaques Grobler
#          Kevin Hughes
# License: BSD 3 clause

from sklearn.decomposition import PCA

from mpl_toolkits.mplot3d import Axes3D
import numpy as np
import matplotlib.pyplot as plt
from scipy import stats


# #############################################################################
# Create the data

e = np.exp(1)
np.random.seed(4)


def pdf(x):
    return 0.5 * (stats.norm(scale=0.25 / e).pdf(x)
                  + stats.norm(scale=4 / e).pdf(x))

y = np.random.normal(scale=0.5, size=(30000))
x = np.random.normal(scale=0.5, size=(30000))
z = np.random.normal(scale=0.1, size=len(x))

density = pdf(x) * pdf(y)
pdf_z = pdf(5 * z)

density *= pdf_z

a = x + y
b = 2 * y
c = a - b + z

norm = np.sqrt(a.var() + b.var())
a /= norm
b /= norm


# #############################################################################
# Plot the figures
def plot_figs(fig_num, elev, azim):
    fig = plt.figure(fig_num, figsize=(4, 3))
    plt.clf()
    ax = Axes3D(fig, rect=[0, 0, .95, 1], elev=elev, azim=azim)

    ax.scatter(a[::10], b[::10], c[::10], c=density[::10], marker='+', alpha=.4)
    Y = np.c_[a, b, c]

    # Using SciPy's SVD, this would be:
    # _, pca_score, V = scipy.linalg.svd(Y, full_matrices=False)

    pca = PCA(n_components=3)
    pca.fit(Y)
    pca_score = pca.explained_variance_ratio_
    V = pca.components_

    x_pca_axis, y_pca_axis, z_pca_axis = 3 * V.T
    x_pca_plane = np.r_[x_pca_axis[:2], - x_pca_axis[1::-1]]
    y_pca_plane = np.r_[y_pca_axis[:2], - y_pca_axis[1::-1]]
    z_pca_plane = np.r_[z_pca_axis[:2], - z_pca_axis[1::-1]]
    x_pca_plane.shape = (2, 2)
    y_pca_plane.shape = (2, 2)
    z_pca_plane.shape = (2, 2)
    ax.plot_surface(x_pca_plane, y_pca_plane, z_pca_plane)
    ax.w_xaxis.set_ticklabels([])
    ax.w_yaxis.set_ticklabels([])
    ax.w_zaxis.set_ticklabels([])


elev = -40
azim = -80
plot_figs(1, elev, azim)

elev = 30
azim = 20
plot_figs(2, elev, azim)

plt.show()

仔细看这两张图片, 在一个方向上可以发现数据是非常平滑的, 在另一个方向上数据是不平滑的, pca找的就是不平滑的数据方向
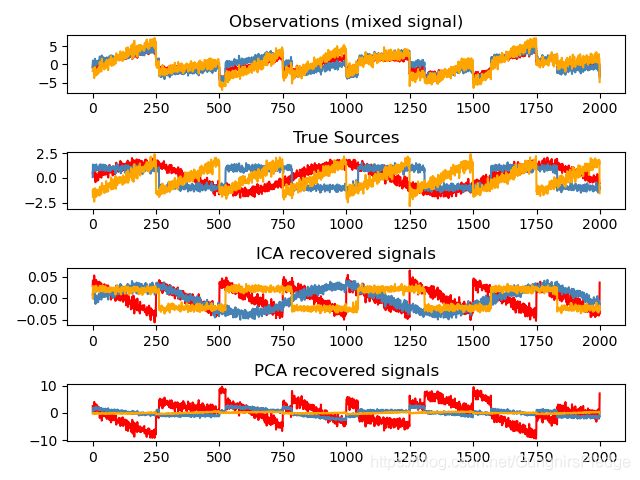
独立成分分析:Independent Component Analysis: ICA
就是找到独立信息最大的分布部分, 一般用来回复非高斯分布的独立信号:
print(__doc__)

import numpy as np
import matplotlib.pyplot as plt
from scipy import signal

from sklearn.decomposition import FastICA, PCA

# #############################################################################
# Generate sample data
np.random.seed(0)
n_samples = 2000
time = np.linspace(0, 8, n_samples)

s1 = np.sin(2 * time)  # Signal 1 : sinusoidal signal
s2 = np.sign(np.sin(3 * time))  # Signal 2 : square signal
s3 = signal.sawtooth(2 * np.pi * time)  # Signal 3: saw tooth signal

S = np.c_[s1, s2, s3]
S += 0.2 * np.random.normal(size=S.shape)  # Add noise

S /= S.std(axis=0)  # Standardize data
# Mix data
A = np.array([[1, 1, 1], [0.5, 2, 1.0], [1.5, 1.0, 2.0]])  # Mixing matrix
X = np.dot(S, A.T)  # Generate observations

# Compute ICA
ica = FastICA(n_components=3)
S_ = ica.fit_transform(X)  # Reconstruct signals
A_ = ica.mixing_  # Get estimated mixing matrix

# We can `prove` that the ICA model applies by reverting the unmixing.
assert np.allclose(X, np.dot(S_, A_.T) + ica.mean_)

# For comparison, compute PCA
pca = PCA(n_components=3)
H = pca.fit_transform(X)  # Reconstruct signals based on orthogonal components

# #############################################################################
# Plot results

plt.figure()

models = [X, S, S_, H]
names = ['Observations (mixed signal)',
         'True Sources',
         'ICA recovered signals',
         'PCA recovered signals']
colors = ['red', 'steelblue', 'orange']

for ii, (model, name) in enumerate(zip(models, names), 1):
    plt.subplot(4, 1, ii)
    plt.title(name)
    for sig, color in zip(model.T, colors):
        plt.plot(sig, color=color)

plt.tight_layout()
plt.show()
参考文献:
sklearn 官网教程


