使用Python进行图像读取、保存、显示
1.使用PIL进行读取、保存、显示
from PIL import Image
im = Image.open('9781789343731_Code/images/parrot.png')
print(im.width, im.height, im.mode, im.format, type(im))
# 486 362 RGB PNG
im.show()
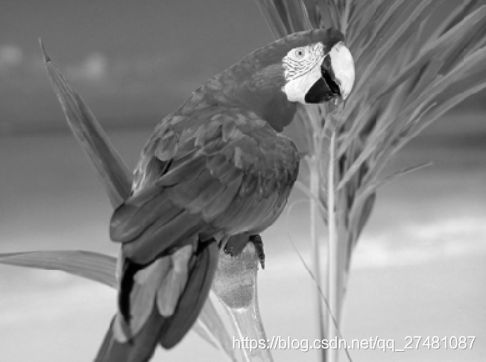
# 彩色图像转化为灰度图像
img_g = im.convert('L')
img_g.save('./parrot_gray.png') # 保存图像
# img_g.show()
Image.open('parrot_gray.png').show() # 显示图像

2.使用matplotlib读取、保存、显示图像
import matplotlib.image as mpimg
import matplotlib.pyplot as plt
im = mpimg.imread('9781789343731_Code/images/hill.png')
# print(im.shape, im.dtype, type(im))
# plt.imshow(im)
# plt.axis('off')
# plt.tight_layout()
# plt.savefig('./hill.png')
# plt.show()
# im = mpimg.imread('hill.png')
# print(im.shape, im.dtype, type(im))
# plt.imshow(im)
# plt.axis('off')
# # plt.tight_layout()
# # print(im1.shape, im1.dtype, type(im1))
# plt.savefig('./hill.png')
# plt.imshow(im)
# plt.show()
# (362, 486, 4) float32
# plt.figure(figsize=(10, 10))
# plt.imshow(im)
# plt.axis('off')
# plt.tight_layout()
# plt.show()
plt.imshow(im)
plt.axis('off')
plt.tight_layout()
# # print(im1.shape, im1.dtype, type(im1))
plt.savefig('./hill.png')
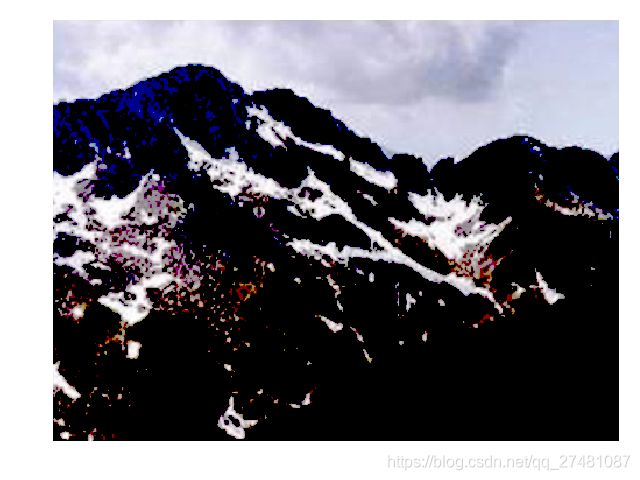
# 将图像更改为较暗图像
im1 = im.copy()
# print(im1.shape, im1.dtype, type(im1))
im1[im1 < 0.5] = 0
# print(im1.shape, im1.dtype, type(im1))
plt.imshow(im1)
plt.axis('off')
plt.tight_layout()
# # print(im1.shape, im1.dtype, type(im1))
plt.savefig('./hill_dark.png')
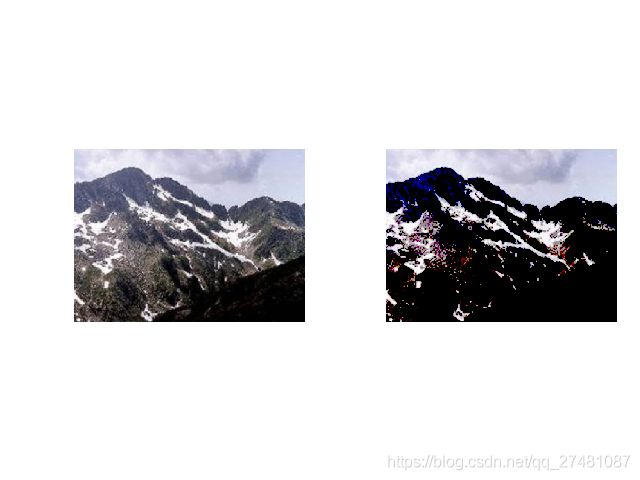
im2 = mpimg.imread('hill_dark.png')
im = mpimg.imread('hill.png')
# print(im2.shape, im2.dtype, type(im2))
#
# # =======================
plt.subplot(121)
plt.imshow(im)
plt.axis('off')
plt.tight_layout()
#
#
# # plt.figure(figsize=(10, 10))
plt.subplot(122)
plt.imshow(im2)
plt.axis('off')
plt.tight_layout()
# # 创建新的figure
# fig = plt.figure(figsize=(10, 10))
#
# # 绘制2x2两行两列共四个图,编号从1开始
# ax = fig.add_subplot(121)
# ax.imshow(im)
#
# ax = fig.add_subplot(122)
# # 使用自定义的colormap(灰度图)
# ax.imshow(im2)
plt.savefig('./hill_contrast.png')
plt.show()

3.使用scikit-image读取、保存和显示图像
import matplotlib.pyplot as plt
from skimage.io import imread, imsave, imshow, show, imread_collection, imshow_collection
from skimage import color, viewer, data
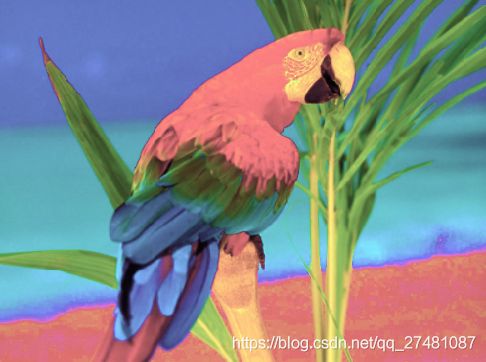
im = imread('./9781789343731_Code/images/parrot.png')
print(im.shape, im.dtype, type(im))
hsv = color.rgb2hsv(im)
hsv[:, :, 1] = 0.5
im1 = color.hsv2rgb(hsv)
imsave('./parrot_hsv.png', im1)
im = imread('./parrot_hsv.png')
plt.axis('off')
imshow(im)
show()
viewer = viewer.ImageViewer(im)
viewer.show()
# data 加载图片
im = data.astronaut()
plt.axis('off')
imshow(im)
show()
# 同时读取显示多个图片
# 同时加载多个图像
ic = imread_collection('./*.png')
imshow_collection(ic)
plt.show()
4.使用scipy的misc模块读取、保存和显示图像
import matplotlib.pyplot as plt
from scipy import misc

im = misc.face()
misc.imsave('face.png', im)
plt.imshow(im)
plt.axis('off')
plt.show()

im2 = misc.imread('9781789343731_Code/images/pepper.jpg')
print(type(im2), im2.shape, im.dtype)

import imageio

im3 = imageio.imread('9781789343731_Code/images/pepper.jpg')
print(type(im3), im3.shape, im3.dtype)
plt.imshow(im3)
plt.axis('off')
plt.show()