机器学习(19)——回归与聚类算法(补充)
目录
1 线性回归
1.1 线性回归的特征与目标的关系分析
1.2 线性回归的损失和优化原理
1.3 优化算法
1.4 线性回归API
1.5 波士顿房价预测
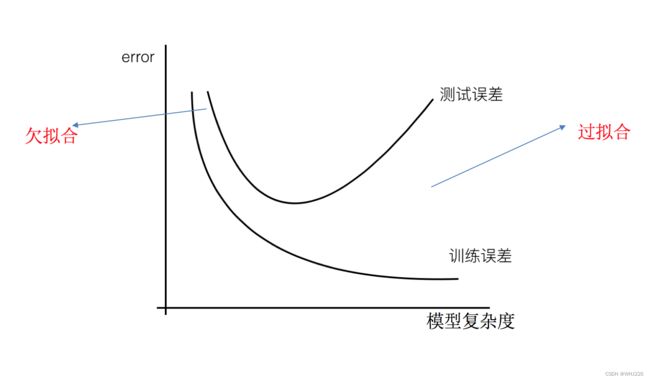
2 欠拟合与过拟合
2.1 定义
2.2 原因以及解决办法:
2.3 正则化类别
3 线性回归的改进-岭回归
4 分类算法-逻辑回归与二分类
4.1 逻辑回归的原理
4.2 损失以及优化
4.3 案例:癌症分类预测-良/恶性乳腺癌肿瘤预测
5 分类的评估方法
5.1 精确率与召回率
5.2 ROC曲线与AUC指标
5.3 模型保存和加载
6 无监督学习-K-means算法简要介绍
6.1 K-means算法
6.2 Kmeans性能评估指标
1 线性回归
线性回归(Linear regression)是利用回归方程(函数)对一个或多个自变量(特征值)和因变量(目标值)之间关系进行建模的一种分析方式。
- 特点:只有一个自变量的情况称为单变量回归,大于一个自变量情况的叫做多元回归。
那么怎么理解呢?我们来看几个例子:
- 期末成绩 = 0.7×考试成绩+0.3×平时成绩
- 房子价格 = 0.02×中心区域的距离 + 0.04×城市一氧化氮浓度 + (-0.12×自住房平均房价) + 0.254×城镇犯罪率
上面两个例子,我们看到特征值与目标值之间建立的一个关系,这个可以理解为回归方程。
1.1 线性回归的特征与目标的关系分析
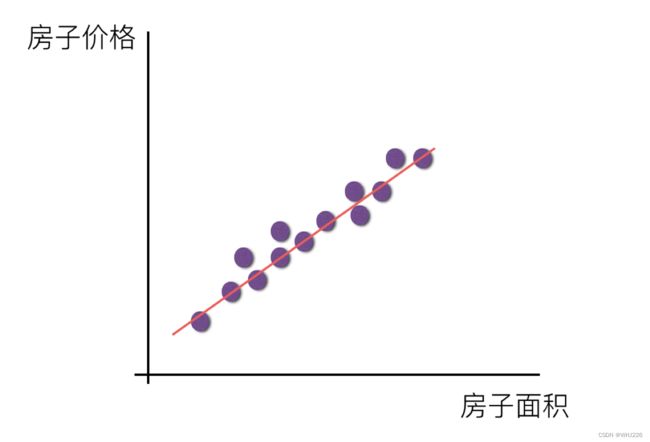
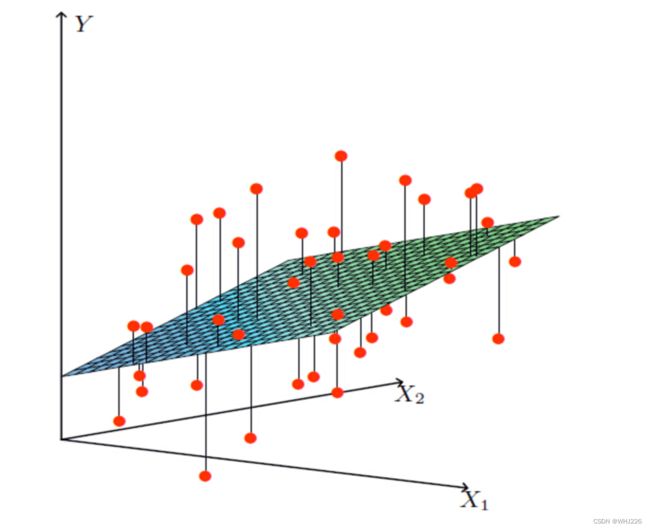
线性回归当中的关系有两种,一种是线性关系,另一种是非线性关系。在这里我们只能画一个平面更好去理解,所以都用单个特征举例子。
- 线性关系
注释:如果在单特征与目标值的关系呈直线关系,两个特征与目标值呈现平面的关系 。
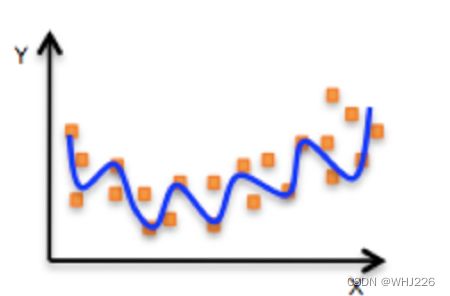
- 非线性关系
如果是非线性关系,那么回归方程可以理解为:
![]()
1.2 线性回归的损失和优化原理
假设刚才的房子例子,真实的数据之间存在这样的关系 :
真实关系:真实房子价格 = 0.02×中心区域的距离 + 0.04×城市一氧化氮浓度 + (-0.12×自住房平均房价) + 0.254×城镇犯罪率那么现在呢,我们随意指定一个关系(猜测):
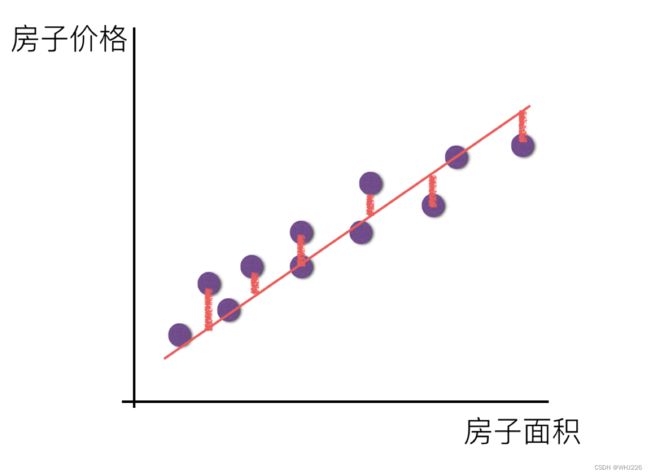
随机指定关系:预测房子价格 = 0.25×中心区域的距离 + 0.14×城市一氧化氮浓度 + 0.42×自住房平均房价 + 0.34×城镇犯罪率请问这样的话,会发生什么?真实结果与我们预测的结果之间是不是存在一定的误差呢?类似这样样子:
那么存在这个误差,我们将这个误差给衡量出来。
损失函数 :
总损失定义为:
- y_i为第i个训练样本的真实值
- h(x_i)为第i个训练样本特征值组合预测函数
- 又称最小二乘法
如何去减少这个损失,使我们预测的更加准确些?既然存在了这个损失,我们一直说机器学习有自动学习的功能,在线性回归这里更是能够体现。这里可以通过一些优化方法去优化(其实是数学当中的求导功能)回归的总损失!!!
拓展:线性回归的损失函数用最小二乘法,等价于当预测值与真实值的误差满足正态分布时的极大似然估计;岭回归的损失函数,是最小二乘法+L2范数,等价于当预测值与真实值的误差满足正态分布,且权重值也满足正态分布(先验分布)时的最大后验估计;LASSO的损失函数,是最小二乘法+L1范数,等价于等价于当预测值与真实值的误差满足正态分布,且且权重值满足拉普拉斯分布(先验分布)时的最大后验估计
1.3 优化算法
如何去求模型当中的W,使得损失最小?(目的是找到最小损失对应的W值)
线性回归经常使用的两种优化算法
- 正规方程(学霸型)
理解:X为特征值矩阵,y为目标值矩阵,直接求到最好的结果。
缺点:当特征过多过复杂时,求解速度太慢并且得不到结果。
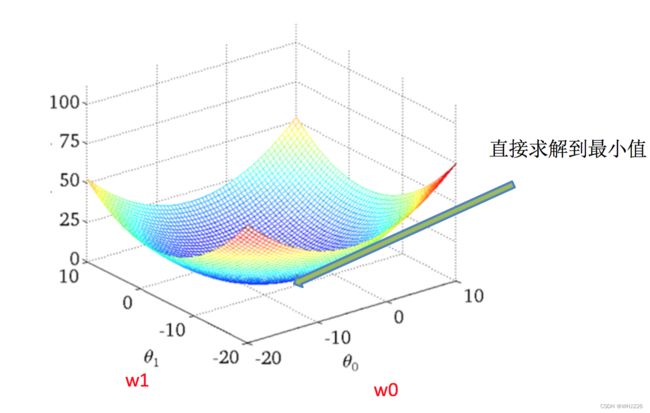
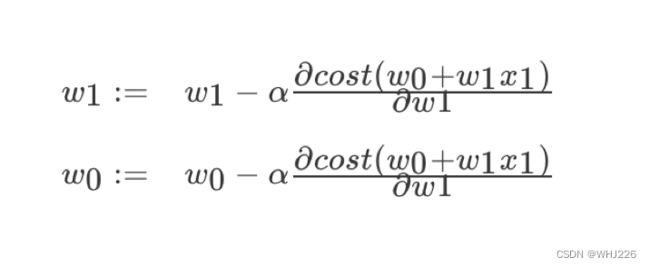
- 梯度下降(Gradient Descent)(努力型)
理解:α为学习速率,需要手动指定(超参数),α旁边的整体表示方向。
沿着这个函数下降的方向找,最后就能找到山谷的最低点,然后更新W值。
使用:面对训练数据规模十分庞大的任务 ,能够找到较好的结果。
1.4 线性回归API
- sklearn.linear_model.LinearRegression(fit_intercept=True)
- 通过正规方程优化
- fit_intercept:是否计算偏置
- LinearRegression.coef_:回归系数
- LinearRegression.intercept_:偏置
- sklearn.linear_model.SGDRegressor(loss="squared_loss", fit_intercept=True, learning_rate ='invscaling', eta0=0.01)
- SGDRegressor类实现了随机梯度下降学习,它支持不同的loss函数和正则化惩罚项来拟合线性回归模型。
- loss:损失类型
- loss=”squared_loss”: 普通最小二乘法
- fit_intercept:是否计算偏置
- learning_rate : string, optional
- 学习率填充
- 'constant': eta = eta0
- 'optimal': eta = 1.0 / (alpha * (t + t0)) [default]
- 'invscaling': eta = eta0 / pow(t, power_t)
- power_t=0.25:存在父类当中
- 对于一个常数值的学习率来说,可以使用learning_rate=’constant’ ,并使用eta0来指定学习率。
- SGDRegressor.coef_:回归系数
- SGDRegressor.intercept_:偏置
1.5 波士顿房价预测
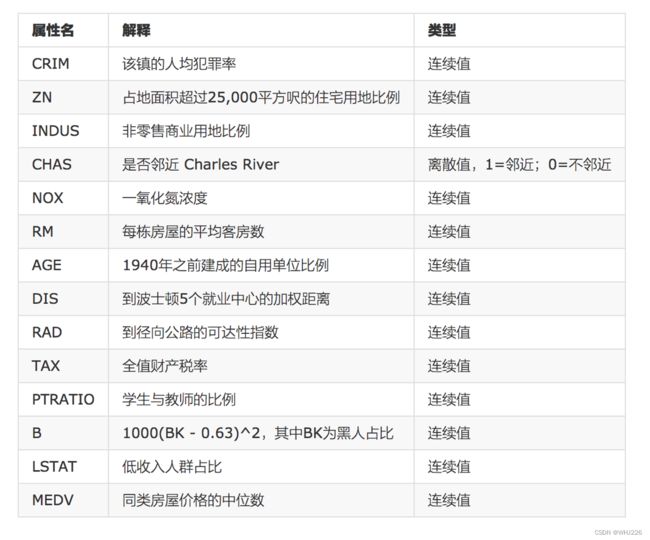
- 数据介绍
分析:
回归当中的数据大小不一致,是否会导致结果影响较大,因此需要做标准化处理。同时我们对目标值也需要做标准化处理。
- 数据分割与标准化处理
- 回归预测
- 线性回归的算法效果评估
回归性能评估:
均方误差(Mean Squared Error,MSE)评价机制:
注:y_i(下标)为预测值,![]() 为真实值。
为真实值。
sklearn.metrics.mean_squared_error(y_true, y_pred)
- 均方误差回归损失
- y_true:真实值
- y_pred:预测值
- return:浮点数结果
流程分析:
1)获取数据集
2)划分数据集
3)特征工程:标准化(无量纲化)
4)预估器流程
fit()--->模型
coef_
intercept_
5)模型评估
代码如下:
from sklearn.datasets import load_boston
from sklearn.model_selection import train_test_split
from sklearn.preprocessing import StandardScaler
from sklearn.linear_model import LinearRegression,SGDRegressor
from sklearn.metrics import mean_squared_error
def linear1():
    """
    正规方程的优化方法对波士顿房价进行预测
    :return:
    """
    # 1)获取数据
    boston = load_boston()

    # 2)划分数据集
    x_train, x_test, y_train, y_test = train_test_split(boston.data, boston.target, random_state=22)

    # 3)标准化
    transfer = StandardScaler()
    x_train = transfer.fit_transform(x_train)
    x_test = transfer.transform(x_test)  # 训练集fit,测试集不fit,因为实际我们不知道要分类的未知数据,所以标准化的平均值和标准差只能用测试集的

    # 4)预估器
    estimator = LinearRegression()
    estimator.fit(x_train, y_train)
    # 5)得出模型
    print("正规方程权重系数为:\n",estimator.coef_)
    print("正规方程偏置为:\n", estimator.intercept_)
    # 6)模型评估
    y_predict = estimator.predict(x_test)
    print("预测房价:\n",y_predict)
    error = mean_squared_error(y_test,y_predict)
    print("正规方程-均方误差为:\n",error)
    return None


def linear2():
    """
    梯度下降的优化方法对波士顿房价进行预测
    :return:
    """
    # 1)获取数据
    boston = load_boston()

    # 2)划分数据集
    x_train, x_test, y_train, y_test = train_test_split(boston.data, boston.target, random_state=22)

    # 3)标准化
    transfer = StandardScaler()
    x_train = transfer.fit_transform(x_train)
    x_test = transfer.transform(x_test)  # 训练集fit,测试集不fit,因为实际我们不知道要分类的未知数据,所以标准化的平均值和标准差只能用测试集的

    # 4)预估器
    estimator = SGDRegressor(learning_rate="constant",eta0=0.01,max_iter=10000,penalty="l1")
    estimator.fit(x_train, y_train)
    # 5)得出模型
    print("梯度下降权重系数为:\n", estimator.coef_)
    print("梯度下降偏置为:\n", estimator.intercept_)
    # 6)模型评估
    y_predict = estimator.predict(x_test)
    print("预测房价:\n", y_predict)
    error = mean_squared_error(y_test, y_predict)
    print("梯度下降-均方误差为:\n", error)
    return None

if __name__ == "__main__":
    #正规方程的优化方法对波士顿房价进行预测
    linear1()
    #梯度下降的优化方法对波士顿房价进行预测
    linear2()
运行结果如下:
正规方程权重系数为:
 [-0.64817766  1.14673408 -0.05949444  0.74216553 -1.95515269  2.70902585
 -0.07737374 -3.29889391  2.50267196 -1.85679269 -1.75044624  0.87341624
 -3.91336869]
正规方程偏置为:
 22.62137203166228
预测房价:
 [28.22944896 31.5122308  21.11612841 32.6663189  20.0023467  19.07315705
 21.09772798 19.61400153 19.61907059 32.87611987 20.97911561 27.52898011
 15.54701758 19.78630176 36.88641203 18.81202132  9.35912225 18.49452615
 30.66499315 24.30184448 19.08220837 34.11391208 29.81386585 17.51775647
 34.91026707 26.54967053 34.71035391 27.4268996  19.09095832 14.92742976
 30.86877936 15.88271775 37.17548808  7.72101675 16.24074861 17.19211608
  7.42140081 20.0098852  40.58481466 28.93190595 25.25404307 17.74970308
 38.76446932  6.87996052 21.80450956 25.29110265 20.427491   20.4698034
 17.25330064 26.12442519  8.48268143 27.50871869 30.58284841 16.56039764
  9.38919181 35.54434377 32.29801978 21.81298945 17.60263689 22.0804256
 23.49262401 24.10617033 20.1346492  38.5268066  24.58319594 19.78072415
 13.93429891  6.75507808 42.03759064 21.9215625  16.91352899 22.58327744
 40.76440704 21.3998946  36.89912238 27.19273661 20.97945544 20.37925063
 25.3536439  22.18729123 31.13342301 20.39451125 23.99224334 31.54729547
 26.74581308 20.90199941 29.08225233 21.98331503 26.29101202 20.17329401
 25.49225305 24.09171045 19.90739221 16.35154974 15.25184758 18.40766132
 24.83797801 16.61703662 20.89470344 26.70854061 20.7591883  17.88403312
 24.28656105 23.37651493 21.64202047 36.81476219 15.86570054 21.42338732
 32.81366203 33.74086414 20.61688336 26.88191023 22.65739323 17.35731771
 21.67699248 21.65034728 27.66728556 25.04691687 23.73976625 14.6649641
 15.17700342  3.81620663 29.18194848 20.68544417 22.32934783 28.01568563
 28.58237108]
正规方程-均方误差为:
 20.6275137630954

梯度下降权重系数为:
 [-0.79852674  1.75100149 -0.48911323  0.74446778 -2.09571123  2.66686724
 -0.40234432 -2.94871764  2.59459396 -1.50554794 -1.87990544  0.92162816
 -3.78518541]
梯度下降偏置为:
 [23.00057676]
预测房价:
 [27.07311949 31.61671867 21.28349086 32.71558736 19.69355955 18.71516632
 21.12157325 20.0053605  20.24218579 31.71375743 21.15396083 27.45254214
 14.2230875  18.35238895 35.67674045 18.90336349  8.36243175 18.08779923
 30.82703696 25.15480563 18.6448163  34.38008401 29.19047592 17.37308064
 34.66062548 26.79380308 37.63858526 29.76720628 18.3140392  16.27765147
 31.3345417  14.09519051 40.89753513  5.58897705 16.00614331 16.97948383
  6.3635786  20.01668016 41.79347452 29.67457659 25.51975858 17.3396252
 38.01725972  6.35717781 22.01997829 25.64151341 19.26434486 19.03902087
 17.04266041 25.06976046  7.53001588 28.64043754 30.79638142 15.68777934
  8.51615325 35.77472098 35.12790838 23.31232652 17.52335878 23.9866438
 23.83875204 24.16315717 20.20223361 39.48047311 26.10965787 19.22732378
 13.20916235  5.98612115 40.8697189  22.70336126 16.60182331 23.24388275
 40.94382196 23.03720142 37.15560591 27.00782703 23.52027301 19.8811675
 26.36985778 23.44073108 31.3236839  21.17908112 24.11769493 35.46192069
 26.60220392 20.81550251 29.09733212 22.65860499 26.07353529 18.3233885
 29.11489904 24.20096634 19.3581183  14.01136126 14.64122433 18.64459256
 25.03272003 15.75535779 20.5677834  25.63034842 20.07474133 17.23968841
 23.4606619  22.90796886 20.03563625 38.32034259 15.71339094 22.92880765
 34.88199044 32.91159621 20.48905641 27.08028691 21.39283244 17.83673121
 22.08295634 25.70259491 31.32575914 29.05214023 23.4425414  14.11719028
 13.93282     3.23550452 29.38693469 20.30109093 22.97991999 28.39126236
 27.44827487]
梯度下降-均方误差为:
 21.86650927852791
正规方程和梯度下降对比:
- 文字对比
| 梯度下降 | 正规方程 |
|---|---|
| 需要选择学习率 | 不需要 |
| 需要迭代求解 | 一次运算得出 |
| 特征数量较大可以使用 | 需要计算方程,时间复杂度高O( |
- 选择:
- 小规模数据:
- LinearRegression(不能解决拟合问题)
- 岭回归
- 大规模数据:SGDRegressor
- 小规模数据:
GD:
梯度下降(Gradient Descent),原始的梯度下降法需要计算所有样本的值才能够得出梯度,计算量大,所以后面才有会一系列的改进。
SGD:
随机梯度下降(Stochastic gradient descent)是一个优化方法,它在一次迭代时只考虑一个训练样本。
- SGD的优点是:
- 高效
- 容易实现
- SGD的缺点是:
- SGD需要许多超参数:比如正则项参数、迭代数。
- SGD对于特征标准化是敏感的。
SAG:
随机平均梯度法(Stochasitc Average Gradient),由于收敛的速度太慢,有人提出SAG等基于梯度下降的算法。
2 欠拟合与过拟合
2.1 定义
- 欠拟合
- 过拟合
分析
- 第一种情况:因为机器学习到的天鹅特征太少了,导致区分标准太粗糙,不能准确识别出天鹅。
- 第二种情况:机器已经基本能区别天鹅和其他动物了。然后,很不巧已有的天鹅图片全是白天鹅的,于是机器经过学习后,会认为天鹅的羽毛都是白的,以后看到羽毛是黑的天鹅就会认为那不是天鹅。
定义:
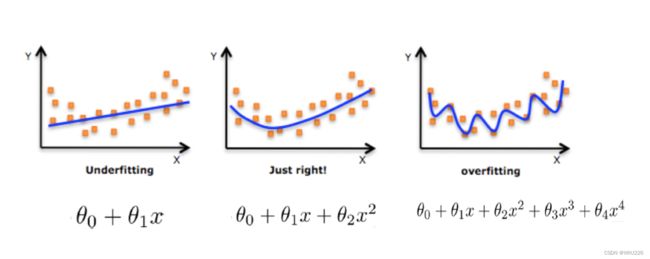
- 过拟合:一个假设在训练数据上能够获得比其他假设更好的拟合, 但是在测试数据集上却不能很好地拟合数据,此时认为这个假设出现了过拟合的现象。(模型过于复杂)
- 欠拟合:一个假设在训练数据上不能获得更好的拟合,并且在测试数据集上也不能很好地拟合数据,此时认为这个假设出现了欠拟合的现象。(模型过于简单)
那么是什么原因导致模型复杂?线性回归进行训练学习的时候模型会变得复杂,这里就对应前面所说的线性回归的两种关系,非线性关系的数据,也就是存在很多无用的特征或者现实中的事物特征跟目标值的关系并不是简单的线性关系。
2.2 原因以及解决办法:
- 欠拟合原因以及解决办法
- 原因:学习到数据的特征过少
- 解决办法:增加数据的特征数量
- 过拟合原因以及解决办法
- 原因:原始特征过多,存在一些嘈杂特征, 模型过于复杂是因为模型尝试去兼顾各个测试数据点
- 解决办法:
- 正则化
在这里针对回归,我们选择了正则化(施加约束)。但是对于其他机器学习算法如分类算法来说也会出现这样的问题,除了一些算法本身作用之外(决策树、神经网络),我们更多的也是自己去做特征选择,包括之前说的删除、合并一些特征。
如何解决?
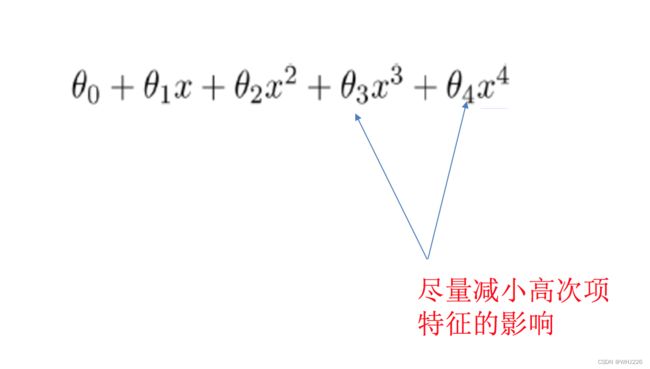
在学习的时候,数据提供的特征有些影响模型复杂度或者这个特征的数据点异常较多,所以算法在学习的时候尽量减少这个特征的影响(甚至删除某个特征的影响),这就是正则化。
注:调整的时候,算法并不知道某个特征影响,而是去调整参数得出优化的结果
2.3 正则化类别
- L2正则化
- 作用:可以使得其中一些W的值(权重)都很小,接近于0,从而削弱某个特征的影响。
- 优点:越小的参数说明模型越简单,越简单的模型则越不容易产生过拟合现象。
- Ridge回归
- L1正则化
- 作用:可以使得其中一些W的值直接为0,消除这个特征的影响。
- LASSO回归
3 线性回归的改进-岭回归
岭回归,其实也是一种线性回归。只不过在算法建立回归方程时候,加上正则化的限制,从而达到解决过拟合的效果。
sklearn.linear_model.Ridge — scikit-learn 1.1.2 documentation
API:
sklearn.linear_model.Ridge(alpha=1.0, fit_intercept=True,solver="auto", normalize=False)
- 具有L2正则化的线性回归
- alpha:正则化力度,也叫 λ
- λ取值:0~1 1~10
- solver:会根据数据自动选择优化方法
- sag:如果数据集、特征都比较大,选择该随机梯度下降优化
- normalize:数据是否进行标准化
- normalize=False:可以在fit之前调用preprocessing.StandardScaler标准化数据
- Ridge.coef_:回归权重
- Ridge.intercept_:回归偏置
Ridge方法相当于SGDRegressor(penalty='l2', loss="squared_loss"),只不过SGDRegressor实现了一个普通的随机梯度下降学习,推荐使用Ridge(实现了SAG)。
sklearn.linear_model.RidgeCV(_BaseRidgeCV, RegressorMixin)
- 具有L2正则化的线性回归,可以进行交叉验证
- coef_:回归系数
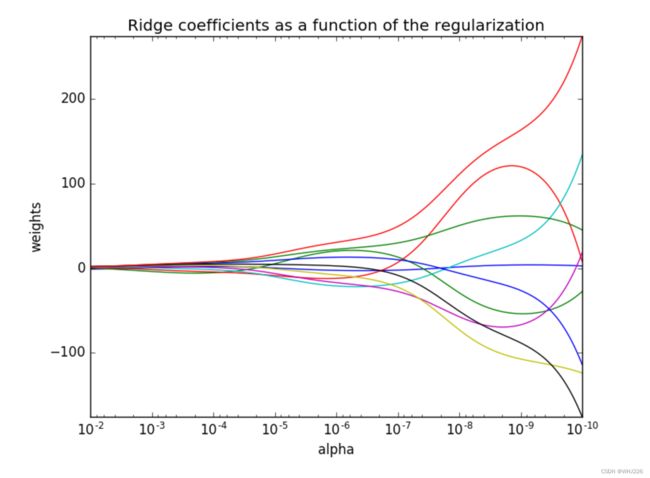
观察正则化程度的变化,对结果的影响?
- 正则化力度越大,权重系数会越小
- 正则化力度越小,权重系数会越大
代码如下:
from sklearn.datasets import load_boston
from sklearn.model_selection import train_test_split
from sklearn.preprocessing import StandardScaler
from sklearn.linear_model import LinearRegression,SGDRegressor,Ridge
from sklearn.metrics import mean_squared_error

def linear3():
    """
    岭回归对波士顿房价进行预测
    :return:
    """
    # 1)获取数据
    boston = load_boston()

    # 2)划分数据集
    x_train, x_test, y_train, y_test = train_test_split(boston.data, boston.target, random_state=22)

    # 3)标准化
    transfer = StandardScaler()
    x_train = transfer.fit_transform(x_train)
    x_test = transfer.transform(x_test)  # 训练集fit,测试集不fit,因为实际我们不知道要分类的未知数据,所以标准化的平均值和标准差只能用测试集的

    # 4)预估器
    estimator = Ridge(alpha=0.5,max_iter=10000)
    estimator.fit(x_train, y_train)
    # 5)得出模型
    print("岭回归权重系数为:\n", estimator.coef_)
    print("岭回归偏置为:\n", estimator.intercept_)
    # 6)模型评估
    y_predict = estimator.predict(x_test)
    print("预测房价:\n", y_predict)
    error = mean_squared_error(y_test, y_predict)
    print("岭回归-均方误差为:\n", error)
    return None

if __name__ == "__main__":
    #岭回归对波士顿房价进行预测
    linear3()
运行结果如下:
岭回归权重系数为:
 [-0.64193209  1.13369189 -0.07675643  0.74427624 -1.93681163  2.71424838
 -0.08171268 -3.27871121  2.45697934 -1.81200596 -1.74659067  0.87272606
 -3.90544403]
岭回归偏置为:
 22.62137203166228
预测房价:
 [28.22536271 31.50554479 21.13191715 32.65799504 20.02127243 19.07245621
 21.10832868 19.61646071 19.63294981 32.85629282 20.99521805 27.5039205
 15.55295503 19.79534148 36.87534254 18.80312973  9.39151837 18.50769876
 30.66823994 24.3042416  19.08011554 34.10075629 29.79356171 17.51074566
 34.89376386 26.53739131 34.68266415 27.42811508 19.08866098 14.98888119
 30.85920064 15.82430706 37.18223651  7.77072879 16.25978968 17.17327251
  7.44393003 19.99708381 40.57013125 28.94670553 25.25487557 17.75476957
 38.77349313  6.87948646 21.78603146 25.27475292 20.4507104  20.47911411
 17.25121804 26.12109499  8.54773286 27.48936704 30.58050833 16.56570322
  9.40627771 35.52573005 32.2505845  21.8734037  17.61137983 22.08222631
 23.49713296 24.09419259 20.15174912 38.49803353 24.63926151 19.77214318
 13.95001219  6.7578343  42.03931243 21.92262496 16.89673286 22.59476215
 40.75560357 21.42352637 36.88420001 27.18201696 21.03801678 20.39349944
 25.35646095 22.27374662 31.142768   20.39361408 23.99587493 31.54490413
 26.76213545 20.8977756  29.0705695  21.99584672 26.30581808 20.10938421
 25.47834262 24.08620166 19.90788343 16.41215513 15.26575844 18.40106165
 24.82285704 16.61995784 20.87907604 26.70640134 20.75218143 17.88976552
 24.27287641 23.36686439 21.57861455 36.78815164 15.88447635 21.47747831
 32.80013402 33.71367379 20.61690009 26.83175792 22.69265611 17.38149366
 21.67395385 21.67101719 27.6669245  25.06785897 23.73251233 14.65355067
 15.19441045  3.81755887 29.1743764  20.68219692 22.33163756 28.01411044
 28.55668351]
岭回归-均方误差为:
 20.641771606180907
4 分类算法-逻辑回归与二分类
逻辑回归(Logistic Regression)是机器学习中的一种分类模型,逻辑回归是一种分类算法,虽然名字中带有回归,但是它与回归之间有一定的联系和区别。由于算法的简单和高效,在实际中应用非常广泛。
应用场景:
- 广告点击率
- 是否为垃圾邮件
- 是否患病
- 金融诈骗
- 虚假账号
看到上面的例子,我们可以发现其中的特点,那就是都属于两个类别之间的判断,逻辑回归就是解决二分类问题的利器。
4.1 逻辑回归的原理
输入:
逻辑回归的输入是一个线性回归的结果。
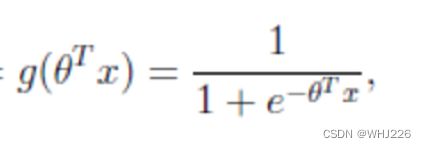
激活函数 :
- sigmoid函数
分析
- 线性回归的结果输入到sigmoid函数当中
- 输出结果:[0, 1]区间中的一个概率值,默认为0.5为阈值
逻辑回归最终的分类是通过属于某个类别的概率值来判断是否属于某个类别,并且这个类别默认标记为1(正例),另外的一个类别会标记为0(反例)。(方便损失计算)
输出结果解释(重要):假设有两个类别A,B,并且假设我们的概率值为属于A(1)这个类别的概率值。现在有一个样本的输入到逻辑回归后输出结果0.6,那么这个概率值超过0.5,意味着我们训练或者预测的结果就是A(1)类别。那么反之,如果得出结果为0.3那么,训练或者预测结果就为B(0)类别。
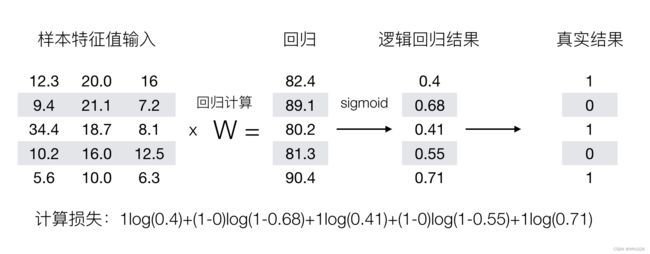
所以接下来我们回忆之前的线性回归预测结果我们用均方误差衡量,那如果对于逻辑回归,我们预测的结果不对该怎么去衡量这个损失呢?我们来看这样一张图。
那么如何去衡量逻辑回归的预测结果与真实结果的差异呢?
4.2 损失以及优化
损失:
逻辑回归的损失,称之为对数似然损失,公式如下:
- 分开类别:
怎么理解单个的式子呢?这个要根据log的函数图像来理解
- 综合完整损失函数
接下来我们呢就带入上面那个例子来计算一遍,就能理解意义了。
我们已经知道,log(P), P值越大,结果越小(P在0到1范围内),所以我们可以对着这个损失的式子去分析。
优化 :
同样使用梯度下降优化算法,去减少损失函数的值。这样去更新逻辑回归前面对应算法的权重参数,提升原本属于1类别的概率,降低原本是0类别的概率。
逻辑回归API:
sklearn.linear_model.LogisticRegression-scikit-learn中文社区
sklearn.linear_model.LogisticRegression(solver='liblinear', penalty=‘l2’, C = 1.0)
- solver:优化求解方式(默认开源的liblinear库实现,内部使用了坐标轴下降法来迭代优化损失函数)
- sag:根据数据集自动选择,随机平均梯度下降
- penalty:正则化的种类
- C:正则化力度
LogisticRegression方法相当于 SGDClassifier(loss="log", penalty=" "),SGDClassifier实现了一个普通的随机梯度下降学习,也支持平均随机梯度下降法(ASGD),可以通过设置average=True。而使用LogisticRegression(实现了SAG)。
4.3 案例:癌症分类预测-良/恶性乳腺癌肿瘤预测
- 数据介绍
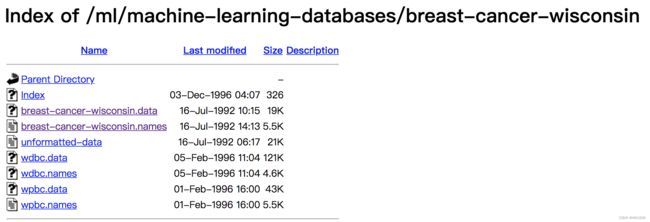
原始数据的下载地址:https://archive.ics.uci.edu/ml/machine-learning-databases/
数据描述
(1)699条样本,共11列数据,第一列用语检索的id,后9列分别是与肿瘤
相关的医学特征,最后一列表示肿瘤类型的数值。
(2)包含16个缺失值,用”?”标出。
流程分析:
1)获取数据
读取的时候加上names
2)数据处理
处理缺失值
3)数据集划分
4)特征工程
无量纲化-标准化
5)逻辑回归预估器
6)模型评估
代码如下:
import pandas as pd
import numpy as np
from sklearn.model_selection import train_test_split
from sklearn.preprocessing import StandardScaler
from sklearn.linear_model import LogisticRegression
from sklearn.metrics import mean_squared_error

#1、读取数据
column_name = ['Sample code number', 'Clump Thickness', 'Uniformity of Cell Size', 'Uniformity of Cell Shape',
                   'Marginal Adhesion', 'Single Epithelial Cell Size', 'Bare Nuclei', 'Bland Chromatin',
                   'Normal Nucleoli', 'Mitoses', 'Class'] #添加索引

data = pd.read_csv("breast-cancer-wisconsin.data",names=column_name)
# print(data)
#2、缺失值处理
#1)替换->np.nan
data = data.replace(to_replace='?', value=np.nan)
#2)删除缺失样本
data = data.dropna()
# data.isnull().any() #不存在缺失值
# print(data)
#3、划分数据集
#筛选特征值和目标值
x = data.iloc[:,1:-1]
y = data["Class"]
# x = data[column_name[1:10]]
# y = data[column_name[10]]
x_train, x_test, y_train, y_test = train_test_split(x, y)

#4、特征工程
#标准化
transfer = StandardScaler()
x_train = transfer.fit_transform(x_train)
x_test = transfer.transform(x_test)  # 训练集fit,测试集不fit,因为实际我们不知道要分类的未知数据,所以标准化的平均值和标准差只能用测试集的

#5、预估器
estimator = LogisticRegression()
estimator.fit(x_train, y_train)

#6、逻辑回归的模型参数:回归系数和偏置为:
print("岭回归权重系数为:\n", estimator.coef_)
print("岭回归偏置为:\n", estimator.intercept_)

#7、模型评估
y_predict = estimator.predict(x_test)
print("预测房价:\n", y_predict)
error = mean_squared_error(y_test, y_predict)
print("岭回归-均方误差为:\n", error)
运行结果如下:
岭回归权重系数为:
 [[ 1.03601449  0.45100605  0.8480087   0.79141768 -0.04211298  1.4374767
   0.56443843  0.7323914   0.96472402]]
岭回归偏置为:
 [-0.95347802]
预测房价:
 [2 2 2 4 4 2 2 2 2 2 2 4 2 4 2 4 2 4 2 2 2 4 2 2 2 2 2 2 4 2 2 4 2 2 2 2 2
 4 4 4 4 2 4 2 4 4 2 2 2 2 2 4 4 2 4 4 2 2 2 2 2 2 2 2 4 2 4 4 4 2 4 2 4 2
 2 4 2 2 2 2 2 2 4 4 2 2 2 4 2 4 4 4 4 4 4 2 4 2 4 4 4 2 2 2 2 2 2 2 2 2 2
 2 2 4 4 2 2 2 2 2 4 2 2 4 4 2 4 4 2 4 2 2 4 4 4 4 4 2 2 2 2 2 4 4 2 4 2 2
 4 2 4 2 4 2 2 4 2 4 2 2 4 4 4 2 2 2 4 2 2 2 2]
岭回归-均方误差为:
 0.0935672514619883
5 分类的评估方法
5.1 精确率与召回率
混淆矩阵:
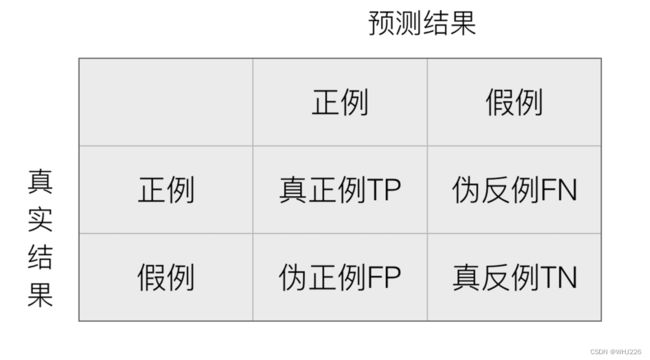
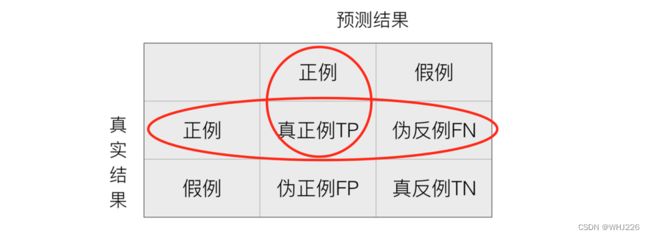
在分类任务下,预测结果(Predicted Condition)与正确标记(True Condition)之间存在四种不同的组合,构成混淆矩阵(适用于多分类)。
精确率(Precision)与召回率(Recall) :
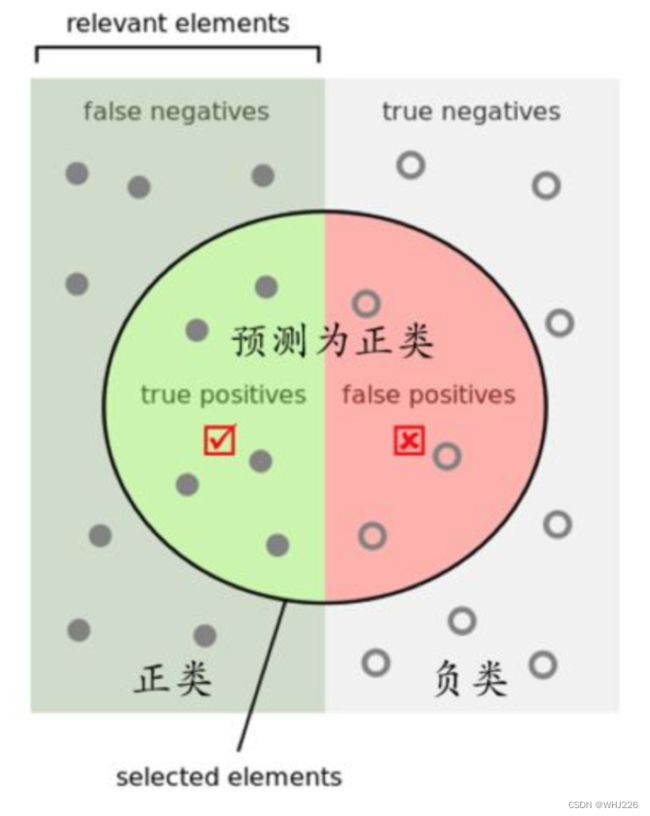
- 精确率:预测结果为正例样本中真实为正例的比例
- 召回率:真实为正例的样本中预测结果为正例的比例(查的全,对正样本的区分能力)
那么怎么更好理解这个两个概念呢?
还有其他的评估标准,F1-score,反映了模型的稳健型:
分类评估报告API:
- sklearn.metrics.classification_report(y_true, y_pred, labels=[], target_names=None )
-
- y_true:真实目标值
- y_pred:估计器预测目标值
- labels:指定类别对应的数字
- target_names:目标类别名称
- return:每个类别精确率与召回率
#查看精确率、召回率、F1-score
from sklearn.metrics import classification_report
print("精确率和召回率为:", classification_report(y_test, y_predict(), labels=[2, 4], target_names=['良性', '恶性']))
如果99个样本癌症,1个样本非癌症,样本不均衡
不管怎样我全都预测正例(默认癌症为正例)-------->不负责任的模型
准确率:99%
召回率:99/99=100%
精确率:99%
F1-score:2*99%/199%=99.497%
问题:如何衡量样本不均衡下的评估?
5.2 ROC曲线与AUC指标
- TPR = TP / (TP + FN)
- 所有真实类别为1的样本中,预测类别为1的比例
- FPR = FP / (FP + FN)
- 所有真实类别为0的样本中,预测类别为1的比例
ROC曲线:
- ROC曲线的横轴就是FPRate,纵轴就是TPRate,当二者相等时,表示的意义则是:对于不论真实类别是1还是0的样本,分类器预测为1的概率是相等的,此时AUC为0.5
AUC指标:
- AUC的概率意义是随机取一对正负样本,正样本得分大于负样本的概率
- AUC的最小值为0.5,最大值为1,取值越高越好
- AUC=1,完美分类器,采用这个预测模型时,不管设定什么阈值都能得出完美预测。绝大多数预测的场合,不存在完美分类器。
- 0.5
最终AUC的范围在[0.5, 1]之间,并且越接近1越好
AUC计算API :
from sklearn.metrics import roc_auc_score
- sklearn.metrics.roc_auc_score(y_true, y_score)
- 计算ROC曲线面积,即AUC值
- y_true:每个样本的真实类别,必须为0(反例)或1(正例)标记
- y_score:每个样本预测的概率值
5.3 模型保存和加载
from sklearn.externals import joblib
- 保存:joblib.dump(rf, 'test.pkl')
- 加载:estimator = joblib.load('test.pkl')
- 保存
# 使用线性模型进行预测
# 使用正规方程求解
lr = LinearRegression()
# 此时在干什么?
lr.fit(x_train, y_train)
# 保存训练完结束的模型
joblib.dump(lr, "test.pkl")- 加载
# 通过已有的模型去预测房价
model = joblib.load("test.pkl")
print("从文件加载进来的模型预测房价的结果:", std_y.inverse_transform(model.predict(x_test)))
代码如下:
import pandas as pd
import numpy as np
from sklearn.model_selection import train_test_split
from sklearn.preprocessing import StandardScaler
from sklearn.linear_model import LogisticRegression
from sklearn.metrics import mean_squared_error
from sklearn.metrics import roc_auc_score
import joblib
#1、读取数据
column_name = ['Sample code number', 'Clump Thickness', 'Uniformity of Cell Size', 'Uniformity of Cell Shape',
                   'Marginal Adhesion', 'Single Epithelial Cell Size', 'Bare Nuclei', 'Bland Chromatin',
                   'Normal Nucleoli', 'Mitoses', 'Class'] #添加索引

data = pd.read_csv("breast-cancer-wisconsin.data",names=column_name)
# print(data)
#2、缺失值处理
#1)替换->np.nan
data = data.replace(to_replace='?', value=np.nan)
#2)删除缺失样本
data = data.dropna()
# data.isnull().any() #不存在缺失值
# print(data)
#3、划分数据集
#筛选特征值和目标值
x = data.iloc[:,1:-1]
y = data["Class"]
# x = data[column_name[1:10]]
# y = data[column_name[10]]
x_train, x_test, y_train, y_test = train_test_split(x, y)

#4、特征工程
#标准化
transfer = StandardScaler()
x_train = transfer.fit_transform(x_train)
x_test = transfer.transform(x_test)  # 训练集fit,测试集不fit,因为实际我们不知道要分类的未知数据,所以标准化的平均值和标准差只能用测试集的


#5、预估器
# estimator = LogisticRegression()
# estimator.fit(x_train, y_train)
# #保存模型
# joblib.dump(estimator,"my_ridge.pkl")
#加载模型
estimator = joblib.load("my_ridge.pkl")

#6、逻辑回归的模型参数:回归系数和偏置为:
print("岭回归权重系数为:\n", estimator.coef_)
print("岭回归偏置为:\n", estimator.intercept_)

#7、模型评估
y_predict = estimator.predict(x_test)
print("预测房价:\n", y_predict)
error = mean_squared_error(y_test, y_predict)
print("岭回归-均方误差为:\n", error)

# 将y_test转换成 0 1
y_true = np.where(y_test > 3, 1 ,0)
print("AUC指标:", roc_auc_score(y_test, y_predict))
运行结果如下:
岭回归权重系数为:
 [[1.35915593 0.24599825 0.74467686 0.7265976  0.16886678 1.2364951
  0.84836347 0.48998894 0.57543839]]
岭回归偏置为:
 [-1.23554673]
预测房价:
 [4 4 2 2 2 2 4 2 2 2 2 4 2 2 2 2 2 2 2 2 2 4 2 2 2 2 4 2 4 2 2 4 2 2 4 4 4
 2 2 4 4 4 2 2 4 4 2 2 2 4 4 4 4 2 4 4 2 2 2 2 2 2 4 2 2 2 2 4 2 2 4 2 4 2
 2 2 2 2 2 4 2 4 2 4 2 2 4 2 2 2 2 4 2 4 2 2 4 4 4 4 4 2 2 2 2 2 4 4 2 4 2
 2 2 2 2 4 2 2 2 2 4 4 2 2 2 2 2 4 2 2 2 2 2 2 2 2 2 4 4 2 2 4 2 2 2 2 2 2
 2 4 2 4 2 2 4 2 4 2 4 4 4 2 4 2 2 2 2 2 2 2 4]
岭回归-均方误差为:
 0.11695906432748537
AUC指标: 0.9688871473354231
总结:
- AUC只能用来评价二分类
- AUC非常适合评价样本不平衡中的分类器性能
6 无监督学习-K-means算法简要介绍
6.1 K-means算法
无监督学习包含算法:
- 聚类
- K-means(K均值聚类)
- 降维
- PCA
K-means原理 :
我们先来看一下一个K-means的聚类效果图。
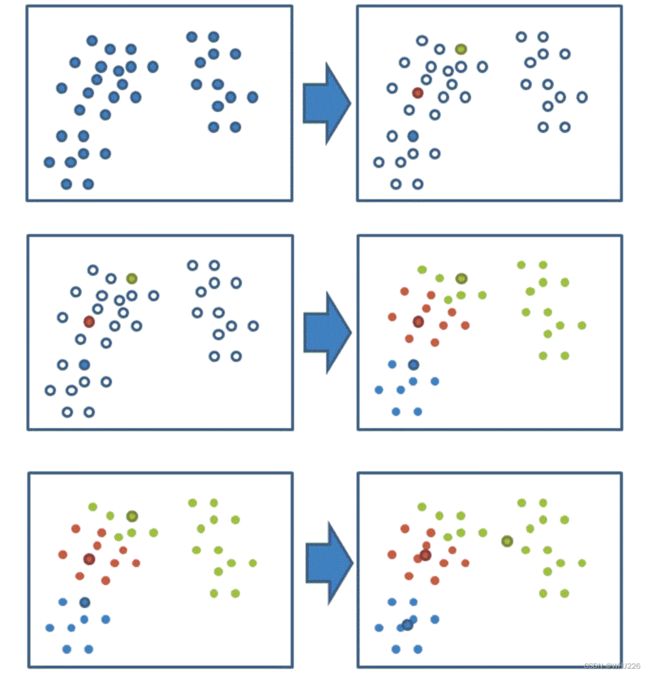
K-means聚类步骤 :
- 1、随机设置K个特征空间内的点作为初始的聚类中心
- 2、对于其他每个点计算到K个中心的距离,未知的点选择最近的一个聚类中心点作为标记类别
- 3、接着对着标记的聚类中心之后,重新计算出每个聚类的新中心点(平均值)
- 4、如果计算得出的新中心点与原中心点一样,那么结束,否则重新进行第二步过程
我们以一张图来解释效果
K-meansAPI:
sklearn.cluster.KMeans(n_clusters=8,init=‘k-means++’)
- k-means聚类
- n_clusters:开始的聚类中心数量
- init:初始化方法,默认为'k-means ++’
- labels_:默认标记的类型,可以和真实值比较(不是值比较)
6.2 Kmeans性能评估指标
轮廓系数:
注:对于每个点i 为已聚类数据中的样本 ,b_i 为i 到其它族群的所有样本的距离最小值,a_i 为i 到本身簇的距离平均值。最终计算出所有的样本点的轮廓系数平均值
轮廓系数值分析:
分析过程(我们以一个蓝1点为例)
-
1、计算出蓝1离本身族群所有点的距离的平均值a_i
-
2、蓝1到其它两个族群的距离计算出平均值红平均,绿平均,取最小的那个距离作为b_i
- 根据公式:极端值考虑:如果b_i >>a_i: 那么公式结果趋近于1;如果a_i>>>b_i: 那么公式结果趋近于-1
结论:
如果b_i>>a_i:趋近于1效果越好, b_i<
轮廓系数API:
sklearn.metrics.silhouette_score(X, labels)
- 计算所有样本的平均轮廓系数
- X:特征值
- labels:被聚类标记的目标值
总结:
- 特点分析:采用迭代式算法,直观易懂并且非常实用
- 缺点:容易收敛到局部最优解(多次聚类)
注意:聚类一般做在分类之前
机器学习(9)——特征工程(3)(补充)_WHJ226的博客-CSDN博客
机器学习(18)——分类算法(补充)_WHJ226的博客-CSDN博客
至此,3篇学习笔记——黑马程序员之Python机器学习。对之前有关机器学习的基础和算法结构进行补充。
数据链接如下(有用自取,数据较大):
链接:https://pan.baidu.com/s/1hnIiOZsS6r6e_bnoTGqhHQ
提取码:whj6

