用梯度下降的方式来拟合曲线
文章目录
-
- 1. 简述
- 2. 理论原理
-
- 以二次函数为例
- 整体的梯度下降步骤:
- 3. 编码实现
-
- 初始化权重矩阵
- 计算损失和梯度
- 更新权重
- 4. 结果
-
- 首先对上一篇文章中的真实数据拟合。
- 测试拟合高次曲线方程
-
- 数据是2阶的,拟合方程是2阶的
- 数据是4阶的,拟合方程也是4阶的。
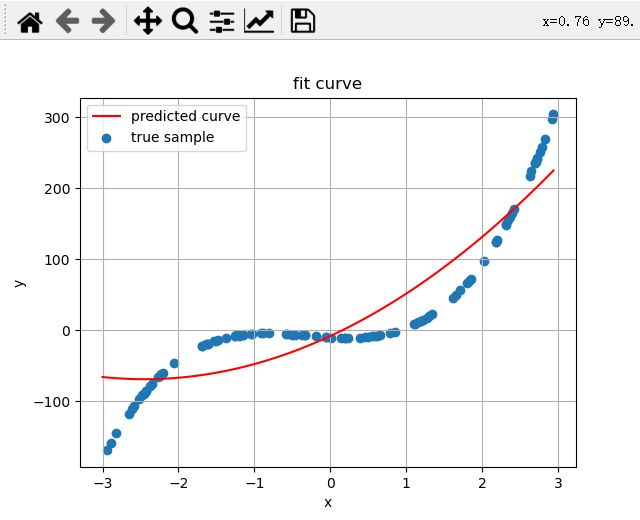
- 方程是4阶的,拟合方程是3阶的,(测试欠拟合)
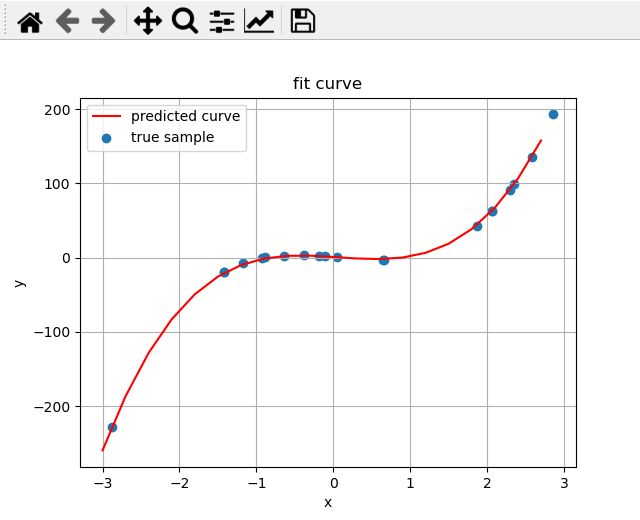
- 方程式4阶的,拟合方程是5阶的,(测试过拟合)
- 数据是2阶的,方程是4阶的 (测试过拟合)
- 5. 总结
- 6. 还有可做的可视化方向
- 完整源码
1. 简述
在之前的一篇文章opencv C++ 曲线拟合中为了拟合一条二次曲线,用超定方程的理论转为求最小二乘的方式来做,这是一个解析的方式求的解,也是全局最优的解。在深度学习中学到的函数是非常复杂的,不能保证是凸的,也没办法从解析的角度来计算一个最优解,这时最有效常用的方法就是梯度下降,为了加深对梯度下降的理解,所以这里以梯度下降来拟合多项式函数来探索一下。
2. 理论原理
以二次函数为例
设函数为 f ( x ) = a 0 + a 1 x + a 2 x 2 f(x)=a_0+a_1x+a_2x^2 f(x)=a0+a1x+a2x2,确定一组 a 0 , a 1 , a 2 a_0,a_1,a_2 a0,a1,a2的值,也就确定了二次函数,所以可以认为一组 a 0 , a 1 , a 2 a_0,a_1,a_2 a0,a1,a2值就是一个模型了。
样本为 ( x , y ) (x,y) (x,y), y ^ \hat{y} y^为模型的预测值,要评价一个模型好不好,我们可以用残差总和(loss)来表示,残差总和越小,模型越好。那我们的目标就是找一组 a 0 , a 1 , a 2 a_0,a_1,a_2 a0,a1,a2的值,使得下面的式子:
l o s s = Σ i = 1 N ∥ y i − y i ^ ∥ 2 2 loss = \Sigma_{i=1}^{N}\|y_i - \hat{y_i} \|_2^2 loss=Σi=1N∥yi−yi^∥22
最小即可。虽然在很多场合都会用MSE均方误差来做损失函数,但是为了方便手动计算梯度,就不用MSE了,两者回归出来的最优值是一样的。
设
W = [ a 0 a 1 a 2 ] W = \begin{bmatrix} a_0 \\ a_1 \\ a_2 \end{bmatrix} W= a0a1a2 , Z = [ 1 x x 2 ] Z = \begin{bmatrix} 1 \\ x \\ x^2 \end{bmatrix} Z= 1xx2 ,则 f ( x ) f(x) f(x)可以写为 f ( x ) = W T Z f(x)=W^TZ f(x)=WTZ
整体的梯度下降步骤:
- 初始化权重W
直接随机初始化 - 计算拟合损失
对每一组数据 z i z_i zi, y i y_i yi in (Z,Y), l o s s i = ( y i − y i ^ ) 2 = ( y i − W T z i ) 2 = ( y i − ( w 1 z i 1 + w 2 z i 2 + w 3 z i 3 ) ) 2 loss_i =(y_i-\hat {y_i})^2 = (y_i - W^T z_i)^2 = (y_i - (w_1z_{i1} + w_2z_{i2} + w_3z_{i3}))^2 lossi=(yi−yi^)2=(yi−WTzi)2=(yi−(w1zi1+w2zi2+w3zi3))2
l o s s i loss_i lossi对 W W W的梯度就是 ∇ = [ − 2 ( y i − ( w 1 z i 1 + w 2 z i 2 + w 3 z i 3 ) z i 1 − 2 ( y i − ( w 1 z i 1 + w 2 z i 2 + w 3 z i 3 ) z i 2 − 2 ( y i − ( w 1 z i 1 + w 2 z i 2 + w 3 z i 3 ) z i 3 ] \nabla = \begin{bmatrix} -2(y_i - (w_1z_{i1} + w_2z_{i2} + w_3z_{i3})z_{i1} \\ -2(y_i - (w_1z_{i1} + w_2z_{i2} + w_3z_{i3})z_{i2} \\ -2(y_i - (w_1z_{i1} + w_2z_{i2} + w_3z_{i3})z_{i3} \end{bmatrix} ∇= −2(yi−(w1zi1+w2zi2+w3zi3)zi1−2(yi−(w1zi1+w2zi2+w3zi3)zi2−2(yi−(w1zi1+w2zi2+w3zi3)zi3
4. 更新权重W
W t + 1 = W t − η ∇ W_{t+1}=W_t -\eta \nabla Wt+1=Wt−η∇, η \eta η为学习率;
5. 输入下一个数据,重复步骤2,直到误差小于一定值或者迭代次数达到设定上限。
3. 编码实现
初始化权重矩阵
    def init_weights(self, order_of_polynomial):
        """init_weights 按照多项式阶数生成一个 阶数行1列的权重矩阵
        例如;order_of_polynomial为3,则生成的W为

        [[random1],
         [random2],
         [random3]]

        Args:
            order_of_polynomial (_type_): _description_

        Returns:
            weights: 阶数行1列的权重矩阵
        """
        W = np.random.randn(order_of_polynomial, 1)
        W = np.array(W,dtype=np.float)
        return W
计算损失和梯度
loss_i = (yi-y_pred)**2

gradient_i = (-2*(yi-y_pred)*zi).T # 和zi维度一样,(n,) 后一个维度为空
更新权重
    def update(self, W, gradient, learning_rate):
        """update 更新权重

        Args:
            W (np array): nx1的array
            gradient (np array): nx1的array
            learning_rate (float): 学习率

        Returns:
            weights: 更新后的权重
        """
        W = W - learning_rate*gradient
        return W
4. 结果
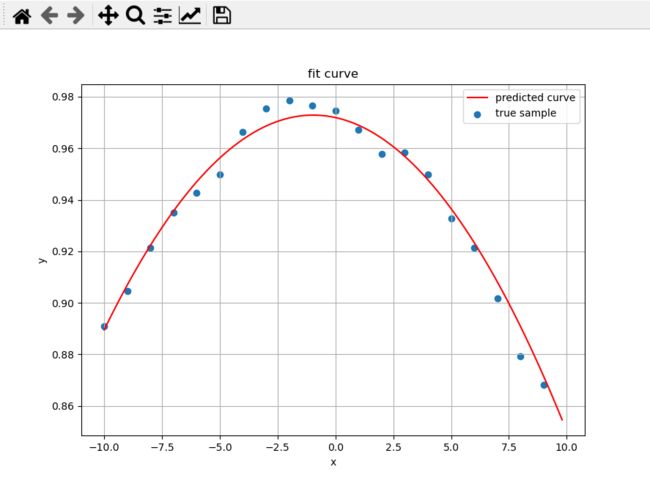
首先对上一篇文章中的真实数据拟合。
opencvC++曲线拟合
在epoches = 10000
learning_rate = 0.0001的条件下获得的结果。

权重矩阵:
W_best:[[ 0.97192164 -0.00196608 -0.00102088]]

在上一篇文章中用解析的方式球的的结果是
拟合方程:f(x) = [0.97301156] + ([-0.00231144]*x) + ([-0.00109041]*x^2)
从图像的拟合结果和对比最小二乘解的权重矩阵,可以发现最后的误差是很小的。
Wonderful!!!
测试拟合高次曲线方程
测试的样本我们可以先随机生成一个系数矩阵A,然后在x的某个区间内随机采样一些点X,用A和X来生成Y,这样的话我们用X,Y来拟合得到一个系数矩阵,和真实的A对比就知道误差怎么样了。
数据是2阶的,拟合方程是2阶的
8100/10000,loss: [3.51305315], min loss [3.51305315],learning rate : 1e-05
weights : [[-4.66950745  1.85807499]], W_best:[[-4.66950745  1.85807499]]
8200/10000,loss: [3.42047123], min loss [3.42047123],learning rate : 1e-05
weights : [[-4.67867211  1.8609997 ]], W_best:[[-4.67867211  1.8609997 ]]
8300/10000,loss: [3.33339115], min loss [3.33339115],learning rate : 1e-05
weights : [[-4.68756034  1.863836  ]], W_best:[[-4.68756034  1.863836  ]]
8400/10000,loss: [3.25148594], min loss [3.25148594],learning rate : 1e-05
weights : [[-4.69618048  1.86658659]], W_best:[[-4.69618048  1.86658659]]
8500/10000,loss: [3.17444808], min loss [3.17444808],learning rate : 1e-05
weights : [[-4.70454061  1.86925406]], W_best:[[-4.70454061  1.86925406]]
8600/10000,loss: [3.10198832], min loss [3.10198832],learning rate : 1e-05
weights : [[-4.71264857  1.87184095]], W_best:[[-4.71264857  1.87184095]]
8700/10000,loss: [3.0338346], min loss [3.0338346],learning rate : 1e-05
weights : [[-4.72051196  1.87434969]], W_best:[[-4.72051196  1.87434969]]
8800/10000,loss: [2.96973104], min loss [2.96973104],learning rate : 1e-05
weights : [[-4.72813815  1.87678267]], W_best:[[-4.72813815  1.87678267]]
8900/10000,loss: [2.90943694], min loss [2.90943694],learning rate : 1e-05
weights : [[-4.7355343   1.87914216]], W_best:[[-4.7355343   1.87914216]]
9000/10000,loss: [2.85272592], min loss [2.85272592],learning rate : 1e-05
weights : [[-4.74270734  1.88143041]], W_best:[[-4.74270734  1.88143041]]
9100/10000,loss: [2.79938505], min loss [2.79938505],learning rate : 1e-05
weights : [[-4.74966401  1.88364956]], W_best:[[-4.74966401  1.88364956]]
9200/10000,loss: [2.74921405], min loss [2.74921405],learning rate : 1e-05
weights : [[-4.75641082  1.88580172]], W_best:[[-4.75641082  1.88580172]]
9300/10000,loss: [2.70202456], min loss [2.70202456],learning rate : 1e-05
weights : [[-4.76295412  1.8878889 ]], W_best:[[-4.76295412  1.8878889 ]]
9400/10000,loss: [2.65763939], min loss [2.65763939],learning rate : 1e-05
weights : [[-4.76930002  1.88991308]], W_best:[[-4.76930002  1.88991308]]
9500/10000,loss: [2.61589189], min loss [2.61589189],learning rate : 1e-05
weights : [[-4.77545449  1.89187616]], W_best:[[-4.77545449  1.89187616]]
9600/10000,loss: [2.57662531], min loss [2.57662531],learning rate : 1e-05
weights : [[-4.78142331  1.89377998]], W_best:[[-4.78142331  1.89377998]]
9700/10000,loss: [2.53969223], min loss [2.53969223],learning rate : 1e-05
weights : [[-4.78721206  1.89562634]], W_best:[[-4.78721206  1.89562634]]
9800/10000,loss: [2.50495396], min loss [2.50495396],learning rate : 1e-05
weights : [[-4.79282619  1.89741698]], W_best:[[-4.79282619  1.89741698]]
9900/10000,loss: [2.47228008], min loss [2.47228008],learning rate : 1e-05
weights : [[-4.79827095  1.89915358]], W_best:[[-4.79827095  1.89915358]]
true weights:[-5  2],predicted weights:[[-4.80349946  1.90082118]]
数据是4阶的,拟合方程也是4阶的。
true weights:[-10 -9 6 -5],predicted weights:[[-9.94695159 -9.02171446 5.97634426 -5.00084477]]
方程是4阶的,拟合方程是3阶的,(测试欠拟合)
true weights:[-10 -6 9 10],predicted weights:[[-8.23658869 49.58531876 10.11229995]]
方程式4阶的,拟合方程是5阶的,(测试过拟合)
true weights:[ 1 -9 -2 10],predicted weights:[[ 0.96926572 -7.09732105 -1.80982351 9.71279898 -0.03855437]]
数据是2阶的,方程是4阶的 (测试过拟合)
true weights:[10 -5],predicted weights:[[ 8.15489344 -3.46121244 0.75647929 -0.39215996]]
5. 总结
对于欠拟合的系统,模型的容量无法完整的表示数据,对于过拟合的系统,模型容量比较富余,当增加增加样本后模型的泛化能力就可以提高。在上面的过拟合的例子中增加样本数就可以更好的拟合真实的多项式。
在阶次较高的数据中,当x比较大时,计算中容易产生nan,所以这里的梯度下降并不能完全解决多项式拟合的问题,主要是在数值计算上,初始化在某些地方模型不收敛。但是这个项目对于理解梯度下降是一个非常好的角度,手动计算梯度,手动更新权重…。
6. 还有可做的可视化方向
查看权重的走向:
以2阶的方程为例,设权重为w1,w2, 以w1和w2为平面坐标的两个轴,对平面上的每一点(每一个都表示一个权重矩阵)都计算一次模型对数据的拟合损失,这样可以得到一个loss(w1,w2)的函数,用mesh可视化这个二维函数就可以知道在不同地方的损失,标记best weights的移动位置就可以更形象的看到梯度下降导致的权重矩阵的走向了。
完整源码
import numpy as np
import matplotlib.pyplot as plt
import random


class MyModule():
    def __init__(self) -> None:
        pass

    def init_weights(self, order_of_polynomial):
        """init_weights 按照多项式阶数生成一个 阶数行1列的权重矩阵
        例如;order_of_polynomial为3,则生成的W为

        [[random1],
         [random2],
         [random3]]

        Args:
            order_of_polynomial (_type_): _description_

        Returns:
            weights: 阶数行1列的权重矩阵
        """
        W = np.random.randn(order_of_polynomial, 1)
        W = np.array(W,dtype=np.float)
        return W

    def update(self, W, gradient, learning_rate):
        """update 更新权重

        Args:
            W (np array): nx1的array
            gradient (np array): nx1的array
            learning_rate (float): 学习率

        Returns:
            weights: 更新后的权重
        """
        W = W - learning_rate*gradient
        return W

    def trans_to_struct_data(self, X, order_of_polynomial):
        """_trans_to_struct_data 把x转为范德蒙德矩阵形式的变量

        Args:
            X (np array): nx1
            order_of_polynomial (int): 多项式的阶数

        Returns:
            Z: np array,[[1,x,x^2,x^3,...,x^order_of_polynomial],...]
        """
        sample_num = X.shape[0]
        Z = np.zeros((sample_num, order_of_polynomial),dtype=np.float32)
        mul_item = np.ones((sample_num,))
        for i in range(order_of_polynomial):
            Z[:,i] = mul_item
            mul_item *= X
        return Z

    def fit(self,X, Y, order_of_polynomial, epoches=30, learning_rate=0.001):
        """fit 根据指定的阶数拟合曲线

        Args:
            X (_type_): _description_
            Y (_type_): _description_
            order_of_polynomial (): 拟合多项式的阶数,至少是一阶的
        """
        if order_of_polynomial < 1:
            raise ValueError("拟合多项式的阶数,至少是一阶的")

        W = self.init_weights(order_of_polynomial)
        W_best = W
        min_loss = 99999999999999
        Z = self.trans_to_struct_data(X, order_of_polynomial)
        for epoch in range(epoches):
            gradient = np.zeros((order_of_polynomial, 1)) # nx1的矩阵
            loss = 0.0
            for zi,yi in zip(Z,Y):
                # yi 是标量,一个数
                # zi 是一个样本,长为n的向量,numpy中没有像矩阵一样有两个维度
                # W 权重,nx1矩阵
                y_pred = np.dot(W.T, zi) # 预测值
                loss_i = (yi-y_pred)**2
                # gradient_i = np.array([2*zi]).T # 一维向量-2*zi转为矩阵后的转置,nx1

                gradient_i = (-2*(yi-y_pred)*zi).T # 和zi维度一样,(n,) 后一个维度为空
                gradient_i = np.array([gradient_i]).T # 增加一个维度,和gradient一致
                W = self.update(W,gradient_i,learning_rate)
                loss += loss_i
                gradient += gradient_i
            # W = self.update(W,gradient,learning_rate)
            if loss < min_loss:
                min_loss = loss
                W_best = W
            if epoch % 100 ==0:
                print(f"{epoch}/{epoches},loss: {loss}, min loss {min_loss},learning rate : {learning_rate}")
                print(f"weights : {W.T}, W_best:{W_best.T}")
        return W_best


def dataset_pool_n(n, sample_num=100, max_abs_x=1, if_rand=False):
    """生成随机多项式分布的样本

    Args:
        n (int): 阶数
        sample_num (int, optional): 生成的样本数量. Defaults to 100.
        max_abs_x (int, optional): x的最大值. Defaults to 1.
        if_rand (bool, optional): 为True时,在标准的数据上加随机波动,. Defaults to False.

    Returns:
        _type_: _description_
    """
    # 系数矩阵,标准的多项式系数
    A = [] # a0+a1x+a2x+...
    for i in range(n):
        A.append(random.randint(-10,10)) # 系数的绝对值在10以内,太大了的话次数高的数值太大
    A = np.array(A)

    # 随机生成一些x
    X = []
    for i in range(sample_num):
        x = 1 - 2*random.random()
        x *= max_abs_x
        X.append(x)
    Z = np.zeros((sample_num, n))
    mul_item = np.ones((sample_num,))
    for i in range(n):
        Z[:,i] = mul_item
        mul_item *= X

    # 用A和Z计算Y
    Y = []
    for zi in Z:
        y = np.dot(A,zi)
        if if_rand:
            y += + (0.5 - random.random())
        Y.append(y)
    return A,np.array(X),np.array(Y)


def dataset_pool_two():
    X = np.array([-10.,  -9.,  -8.,  -7.,  -6.,  -5.,  -4.,  -3.,  -2.,  -1.,   0.,
         1.,   2.,   3.,   4.,   5.,   6.,   7.,   8.,   9.], np.float)
    Y = np.array([0.890928, 0.904723, 0.921421, 0.935007, 0.94281 , 0.949828,
        0.966265, 0.975411, 0.978693, 0.97662 , 0.974468, 0.967101,
        0.957691, 0.958369, 0.949841, 0.932791, 0.9213  , 0.901874,
        0.879374, 0.868257], np.float)
    return X,Y


def main():

    order_of_polynomial_for_data_generation = 4 # 生成数据时用的阶数
    sample_num = 100 # 样本数量
    max_abs_x = 3 # x的最大值,当方程次数较高时,x值太大容易导致计算中产生nan
    if_rand = True # 为True时,在标准的数据上加随机波动,

    # X, Y = dataset_pool_linear()
    # X, Y = dataset_pool_two()
    A, X, Y = dataset_pool_n(order_of_polynomial_for_data_generation, sample_num, max_abs_x, if_rand)

    epoches = 10000
    learning_rate = 0.00001

    model = MyModule()
    order_of_polynomial_for_fit = 4 # 拟合数据时用的阶数
    W = model.fit(X,Y,order_of_polynomial_for_fit,epoches,learning_rate)

    print(f"true weights:{A},predicted weights:{W.T}")

    # 可视化
    X_axis = np.arange(-max_abs_x, max_abs_x,2*max_abs_x/sample_num)
    Z = model.trans_to_struct_data(X_axis,order_of_polynomial_for_fit)
    Y_pred = [np.dot(W.T,zi) for zi in Z]
    Y_pred = np.array(Y_pred)
    plt.scatter(X,Y,label="true sample")
    plt.plot(X_axis,Y_pred,c='red',label="predicted curve")
    plt.xlabel("x")
    plt.ylabel("y")
    plt.title("fit curve")
    plt.legend()
    plt.grid(True)
    plt.show()


if __name__ == '__main__':

    main()


