【Android】Simpleperf
Simpleperf如何工作
现代CPU有一个称为性能监测单元(PMU)的硬件组件。PMU有几个硬件计数器,计算发生了多少个cpu周期,执行了多少条指令,或发生了多少次高速缓存失误等事件。
Linux内核将这些硬件计数器包装成硬件perf事件。此外,Linux内核还提供独立于硬件的software events and tracepoint events。Linux内核通过perf_event_open系统调用将所有事件暴露给用户空间,该调用被simpleperf所使用。
Simpleperf有三个主要命令:stat, record and report.
stat命令给出了在一个时间段内被剖析的进程中发生了多少事件的摘要。下面是它的工作原理。
- 给予用户选项,simpleperf通过对内核进行系统调用来实现剖析。
- 内核在剖析的进程运行时启用计数器。
- 剖析之后,simpleperf从内核中读取计数器,并报告一个计数器摘要。
record命令记录了某个时间段内被剖析进程的样本。下面是它的工作原理。
- 给予用户选项,simpleperf通过对内核进行系统调用来实现剖析。
- Simpleperf在simpleperf和内核之间创建映射的缓冲区。
- 内核在剖析的进程运行时启用计数器。
- 每次发生一定数量的事件,内核都会向映射的缓冲区转储一个样本。
- Simpleperf从映射的缓冲区读取样本,并将剖析数据存储在一个名为perf.data的文件中。
report命令读取perf.data和被分析进程使用的任何共享库,并输出一份报告,显示时间花在哪里。
Commands
Simpleperf支持几个命令,列举如下:
The debug-unwind command: debug/test dwarf based offline unwinding, used for debugging simpleperf.
The dump command: dumps content in perf.data, used for debugging simpleperf.
The help command: prints help information for other commands.
The kmem command: collects kernel memory allocation information (will be replaced by Python scripts).
The list command: lists all event types supported on the Android device.
The record command: profiles processes and stores profiling data in perf.data.
The report command: reports profiling data in perf.data.
The report-sample command: reports each sample in perf.data, used for supporting integration of
                           simpleperf in Android Studio.
The stat command: profiles processes and prints counter summary.
每个命令支持不同的选项,可以通过帮助信息看到:
# List all commands.
$ simpleperf --help

# Print help message for record command.
$ simpleperf record --help
下面介绍最经常使用的命令,即list, stat, record and report.
The list command
list命令列出了设备上所有可用的events 。不同的设备可能支持不同的events ,因为它们有不同的硬件和内核。
$ simpleperf list
List of hw-cache events:
  branch-loads
  ...
List of hardware events:
  cpu-cycles
  instructions
  ...
List of software events:
  cpu-clock
  task-clock
  ...
在ARM/ARM64上,list命令还显示了一个原始事件的列表,它们是设备上的ARM PMU所支持的事件。内核已经将它们的一部分包装成硬件事件和hw-缓存事件。例如,raw-cpu-cycles被包装成cpu-cycles,raw-instruction-retired被包装成指令。如果我们想使用设备上支持的一些事件,但不幸的是没有被内核包装,那么原始事件就会被提供。
The stat command
stat命令用来获取被分析进程的事件计数器值。通过传递选项,我们可以选择使用哪些事件,监测哪些进程/线程,监测多长时间和打印间隔。
# Stat using default events (cpu-cycles,instructions,...), and monitor process 7394 for 10 seconds.
$ simpleperf stat -p 7394 --duration 10
Performance counter statistics:

#         count  event_name                # count / runtime
     16,513,564  cpu-cycles                # 1.612904 GHz
      4,564,133  stalled-cycles-frontend   # 341.490 M/sec
      6,520,383  stalled-cycles-backend    # 591.666 M/sec
      4,900,403  instructions              # 612.859 M/sec
         47,821  branch-misses             # 6.085 M/sec
  25.274251(ms)  task-clock                # 0.002520 cpus used
              4  context-switches          # 158.264 /sec
            466  page-faults               # 18.438 K/sec

Total test time: 10.027923 seconds.
Select events to stat
我们可以通过-e选择使用哪些事件。
# Stat event cpu-cycles.
$ simpleperf stat -e cpu-cycles -p 11904 --duration 10

# Stat event cache-references and cache-misses.
$ simpleperf stat -e cache-references,cache-misses -p 11904 --duration 10
当运行stat命令时,如果硬件事件的数量大于PMU中可用的硬件计数器的数量,内核会在事件之间共享硬件计数器,所以每个事件只被监测总时间的一部分。结果,显示的事件数小于实际发生的事件数。下面是一个例子。
# Stat using event cache-references, cache-references:u,....
$ simpleperf stat -p 7394 -e cache-references,cache-references:u,cache-references:k \
      -e cache-misses,cache-misses:u,cache-misses:k,instructions --duration 1
Performance counter statistics:

#   count  event_name           # count / runtime
  490,713  cache-references     # 151.682 M/sec
  899,652  cache-references:u   # 130.152 M/sec
  855,218  cache-references:k   # 111.356 M/sec
   61,602  cache-misses         # 7.710 M/sec
   33,282  cache-misses:u       # 5.050 M/sec
   11,662  cache-misses:k       # 4.478 M/sec
        0  instructions         #

Total test time: 1.000867 seconds.
simpleperf W cmd_stat.cpp:946] It seems the number of hardware events are more than the number of
available CPU PMU hardware counters. That will trigger hardware counter
multiplexing. As a result, events are not counted all the time processes
running, and event counts are smaller than what really happens.
Use --print-hw-counter to show available hardware counters.
在上面的例子中,我们监测了7个事件。每个事件只被监控了总时间的一部分。因为缓存引用的数量小于缓存引用:u(只在用户空间的缓存引用)和缓存引用:k(只在内核的缓存引用)的数量。指令的数量为零。打印结果后,simpleperf检查CPU是否有足够的硬件计数器来同时计算硬件事件。如果没有,它会打印出一个警告。
为了避免硬件计数器复用,我们可以使用simpleperf stat --print-hw-counter来显示每个CPU上的可用计数器。然后不要监测比可用计数器更多的硬件事件。
$ simpleperf stat --print-hw-counter
There are 2 CPU PMU hardware counters available on cpu 0.
There are 2 CPU PMU hardware counters available on cpu 1.
There are 2 CPU PMU hardware counters available on cpu 2.
There are 2 CPU PMU hardware counters available on cpu 3.
There are 2 CPU PMU hardware counters available on cpu 4.
There are 2 CPU PMU hardware counters available on cpu 5.
There are 2 CPU PMU hardware counters available on cpu 6.
There are 2 CPU PMU hardware counters available on cpu 7.
当计数器复用发生时,不能保证哪个事件在哪个时间被监测。如果我们想确保某些事件总是在同一时间被监测,我们可以使用–组。
# Stat using event cache-references, cache-references:u,....
$ simpleperf stat -p 7964 --group cache-references,cache-misses \
      --group cache-references:u,cache-misses:u --group cache-references:k,cache-misses:k \
      --duration 1
Performance counter statistics:

#     count  event_name           # count / runtime
  2,088,463  cache-references     # 181.360 M/sec
     47,871  cache-misses         # 2.292164% miss rate
  1,277,600  cache-references:u   # 136.419 M/sec
     25,977  cache-misses:u       # 2.033265% miss rate
    326,305  cache-references:k   # 74.724 M/sec
     13,596  cache-misses:k       # 4.166654% miss rate

Total test time: 1.029729 seconds.
simpleperf W cmd_stat.cpp:946] It seems the number of hardware events are more than the number of
...
Select target to stat
我们可以通过-p或-t选择要监控的进程或线程。监控一个进程与监控该进程中的所有线程是一样的。Simpleperf也可以分叉一个子进程来运行新的命令,然后监控这个子进程。
# Stat process 11904 and 11905.
$ simpleperf stat -p 11904,11905 --duration 10

# Stat thread 11904 and 11905.
$ simpleperf stat -t 11904,11905 --duration 10

# Start a child process running `ls`, and stat it.
$ simpleperf stat ls

# Stat the process of an Android application. This only works for debuggable apps on non-rooted
# devices.
$ simpleperf stat --app simpleperf.example.cpp

# Stat system wide using -a.
$ simpleperf stat -a --duration 10
决定统计多长时间
当监控现有的线程时,我们可以使用-duration来决定监控的时间。当监控一个运行新命令的子进程时,simpleperf会监控到该子进程结束。在这种情况下,我们可以在任何时候使用Ctrl-C来停止监控。
# Stat process 11904 for 10 seconds.
$ simpleperf stat -p 11904 --duration 10

# Stat until the child process running `ls` finishes.
$ simpleperf stat ls

# Stop monitoring using Ctrl-C.
$ simpleperf stat -p 11904 --duration 10
^C
如果你想写一个脚本来控制监控的时间,你可以向simpleperf发送SIGINT、SIGTERM、SIGHUP信号之一来停止监控。
决定打印间隔时间
在监控perf计数器时,我们也可以使用–interval来决定打印间隔时间。
# Print stat for process 11904 every 300ms.
$ simpleperf stat -p 11904 --duration 10 --interval 300

# Print system wide stat at interval of 300ms for 10 seconds. Note that system wide profiling needs
# root privilege.
$ su 0 simpleperf stat -a --duration 10 --interval 300
在systrace中显示计数器
Simpleperf也可以和systrace一起工作,在收集的跟踪中转储计数器。下面是一个做全系统统计的例子。
# Capture instructions (kernel only) and cache misses with interval of 300 milliseconds for 15
# seconds.
$ su 0 simpleperf stat -e instructions:k,cache-misses -a --interval 300 --duration 15
# On host launch systrace to collect trace for 10 seconds.
(HOST)$ external/chromium-trace/systrace.py --time=10 -o new.html sched gfx view
# Open the collected new.html in browser and perf counters will be shown up.
显示每个线程的事件计数
默认情况下,stat cmd 输出的是所有被监控目标的事件计数总和。但当使用 --per-thread 选项时,stat cmd 会输出被监控目标的每个线程的事件计数。它可以用来查找进程或系统中的繁忙线程。使用 --per-thread 选项时,stat cmd 为每个存在的线程打开一个 perf_event_file。如果被监控的线程创建了新的线程,那么新线程的事件计数将被默认添加到被监控的线程中,否则,如果同时使用–no-inherit选项,则会省略。
# Print event counts for each thread in process 11904. Event counts for threads created after
# stat cmd will be added to threads creating them.
$ simpleperf stat --per-thread -p 11904 --duration 1

# Print event counts for all threads running in the system every 1s. Threads not running will not
# be reported.
$ su 0 simpleperf stat --per-thread -a --interval 1000 --interval-only-values

# Print event counts for all threads running in the system every 1s. Event counts for threads
# created after stat cmd will be omitted.
$ su 0 simpleperf stat --per-thread -a --interval 1000 --interval-only-values --no-inherit
Show event count per core
默认情况下,stat cmd输出所有被监控的cpu内核的事件计数总和。但当使用 – per-core 选项时,stat cmd 会输出每个内核的事件计数。它可以用来查看事件在不同内核上的分布情况。当用–per-core选项说明非系统范围时,simpleperf为每个核心上的每个被监控的线程创建一个perf事件。当一个线程处于运行状态时,所有内核上的perf事件都被启用,但只有运行该线程的内核上的perf事件处于运行状态。因此,百分比的注释显示了一个核心上的运行时间/所有核心上的运行时间。注意,百分比仍然受到硬件计数器复用的影响。检查simpleperf日志输出,了解区分它的方法。
# Print event counts for each cpu running threads in process 11904.
# A percentage shows runtime_on_a_cpu / runtime_on_all_cpus.
$ simpleperf stat -e cpu-cycles --per-core -p 1057 --duration 3
Performance counter statistics:

# cpu        count  event_name   # count / runtime
  0      1,667,660  cpu-cycles   # 1.571565 GHz
  1      3,850,440  cpu-cycles   # 1.736958 GHz
  2      2,463,792  cpu-cycles   # 1.701367 GHz
  3      2,350,528  cpu-cycles   # 1.700841 GHz
  5      7,919,520  cpu-cycles   # 2.377081 GHz
  6    105,622,673  cpu-cycles   # 2.381331 GHz

Total test time: 3.002703 seconds.

# Print event counts for each cpu system wide.
$ su 0 simpleperf stat --per-core -a --duration 1

# Print cpu-cycle event counts for each cpu for each thread running in the system.
$ su 0 simpleperf stat -e cpu-cycles -a --per-thread --per-core --duration 1
The record command
record命令是用来转储被剖析进程的样本的。每个样本可以包含的信息有:样本产生的时间、自上次样本以来的事件数量、线程的程序计数器、线程的调用链。
通过传递选项,我们可以选择使用哪些事件,监测哪些进程/线程,以何种频率转储样本,监测多长时间,以及在哪里存储样本。
# Record on process 7394 for 10 seconds, using default event (cpu-cycles), using default sample
# frequency (4000 samples per second), writing records to perf.data.
$ simpleperf record -p 7394 --duration 10
simpleperf I cmd_record.cpp:316] Samples recorded: 21430. Samples lost: 0.
Select events to record
默认情况下,cpu-cycles事件被用来评估消耗的cpu周期。但我们也可以通过-e使用其他事件。
# Record using event instructions.
$ simpleperf record -e instructions -p 11904 --duration 10

# Record using task-clock, which shows the passed CPU time in nanoseconds.
$ simpleperf record -e task-clock -p 11904 --duration 10
Select target to record
record命令中选择目标的方法与select命令中的方法类似。
# Record process 11904 and 11905.
$ simpleperf record -p 11904,11905 --duration 10

# Record thread 11904 and 11905.
$ simpleperf record -t 11904,11905 --duration 10

# Record a child process running `ls`.
$ simpleperf record ls

# Record the process of an Android application. This only works for debuggable apps on non-rooted
# devices.
$ simpleperf record --app simpleperf.example.cpp

# Record system wide.
$ simpleperf record -a --duration 10
Set the frequency to record
我们可以通过-f或-c设置转储记录的频率。例如,-f 4000意味着当被监控的线程运行时,每秒钟转储大约4000条记录。如果一个被监控的线程在一秒钟内运行0.2s(它可以在其他时间被抢占或阻塞),simpleperf每秒钟就会转储大约4000 * 0.2 / 1.0 = 800条记录。另一种方法是使用-c。例如,-c 10000意味着每当10000个事件发生时就转储一条记录。
# Record with sample frequency 1000: sample 1000 times every second running.
$ simpleperf record -f 1000 -p 11904,11905 --duration 10

# Record with sample period 100000: sample 1 time every 100000 events.
$ simpleperf record -c 100000 -t 11904,11905 --duration 10
为了避免花费太多时间生成样本,内核>=3.10设置了用于生成样本的最大cpu时间百分比(默认为25%),并在达到该限制时降低最大允许的样本频率。Simpleperf使用-cpu-percent选项来调整它,但它需要root权限或在Android >= Q上。
# Record with sample frequency 10000, with max allowed cpu percent to be 50%.
$ simpleperf record -f 1000 -p 11904,11905 --duration 10 --cpu-percent 50
Decide how long to record
在record命令中决定监测多长时间的方法与stat命令中类似。
# Record process 11904 for 10 seconds.
$ simpleperf record -p 11904 --duration 10

# Record until the child process running `ls` finishes.
$ simpleperf record ls

# Stop monitoring using Ctrl-C.
$ simpleperf record -p 11904 --duration 10
^C
如果你想写一个脚本来控制监控的时间,你可以向simpleperf发送SIGINT、SIGTERM、SIGHUP信号之一来停止监控。
Set the path to store profiling data
默认情况下,simpleperf在当前目录下的perf.data中存储剖析数据。但可以用-o来改变路径。
# Write records to data/perf2.data.
$ simpleperf record -p 11904 -o data/perf2.data --duration 10
Record call graphs
调用图是一棵显示函数调用关系的树。下面是一个例子。
main() {
    FunctionOne();
    FunctionTwo();
}
FunctionOne() {
    FunctionTwo();
    FunctionThree();
}
a call graph:
    main-> FunctionOne
       |    |
       |    |-> FunctionTwo
       |    |-> FunctionThree
       |
       |-> FunctionTwo
调用图显示了一个函数如何调用其他函数,而反向调用图显示了一个函数如何被其他函数调用。要显示一个调用图,我们需要首先记录它,然后报告它。
有两种方法来记录调用图,一种是记录基于dwarf的调用图,另一种是记录基于堆栈帧的调用图。记录基于dwarf的调用图需要支持本地二进制文件的调试信息。而记录基于堆栈框架的调用图则需要对堆栈框架寄存器的支持。
# Record a dwarf based call graph
$ simpleperf record -p 11904 -g --duration 10

# Record a stack frame based call graph
$ simpleperf record -p 11904 --call-graph fp --duration 10
这里有一些关于记录call图的建议。
下面是我们对基于dwarf调用图和基于堆栈框架的调用图的经验。
基于dwarf呼叫图:
- 需要支持二进制文件中的调试信息。
- 在ARM和ARM64上表现正常,对于完全编译的Java代码和C++代码都是如此。
- 每个样本只能解开64K的堆栈。所以通常不能显示完整的火焰图。但对于用户来说,可能足以识别热点地区。
- 比基于堆栈帧的调用图需要更多的CPU时间。所以建议采样频率为1000赫兹。因此,每秒钟最多只能有1000个样本。
基于堆栈框架的调用图:
- 需要对堆栈框架寄存器的支持。
- 在ARM上不太行得通。因为ARM缺少寄存器,而且ARM和THUMB代码有不同的堆栈框架寄存器。所以内核不能解开包含ARM/THUMB代码的用户栈。
- 在ARM64上完全编译的Java代码上也不能很好地工作。因为ART编译器没有保留堆栈框架寄存器。
- 在ARM64上对native程序进行剖析时,效果很好。一个例子是对surfaceacelinger进行剖析。而且在工作良好的情况下,通常会显示完整的火焰图。
- 比基于dwarf的呼叫图占用更少的CPU时间。所以采样频率可以是4000赫兹或更高。
因此,如果您需要对ARM上的代码进行剖析或对完全编译的Java代码进行剖析,基于dwarf的调用图可能更好。如果您需要对ARM64上的C++代码进行剖析,基于堆栈框架的调用图可能更好。毕竟,您总是可以先尝试基于dwarf的调用图,因为当正确给出未剥离的二进制文件时,它总是产生合理的结果。如果它的效果不够好,那么可以尝试基于堆栈帧的调用图来代替。
Record both on CPU time and off CPU time
Simpleperf是一个CPU剖析器,它只在一个线程在CPU上运行时产生样本。但有时我们想知道线程的时间是在CPU外度过的(比如被其他线程抢占,在IO中受阻或等待某些事件)。为了支持这一点,simpleperf在record命令中增加了一个–trace-offcpu选项。当使用–trace-offcpu时,simpleperf会做以下事情:
- 只有cpu-clock/task-clock事件被允许与-trace-offcpu一起使用。这让simpleperf为cpu-clock事件生成on-cpu样本。
- Simpleperf也监控sched:sched_switch事件,每次被监控的线程被安排离开cpu时,都会产生一个sched_switch样本。
- Simpleperf也记录上下文切换记录。因此,它知道线程何时被安排回到一个cpu上。
simpleperf为一个线程收集的样本和上下文切换记录如下所示:
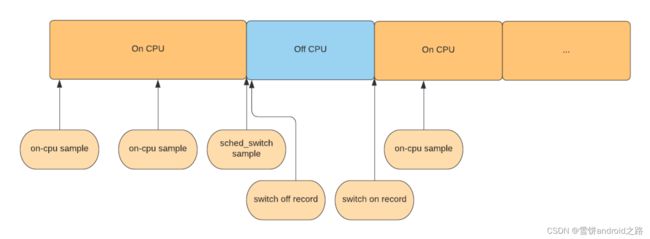
这里我们有两种类型的样本:
- 为cpu-clock事件生成的on-cpu样本。每个样本中的周期值意味着有多少纳秒花在cpu上(对于这个样本的调用链)。
- off-cpu (sched_switch) 为sched:sched_switch事件产生的样本。周期值是由simpleperf计算的下一个开关记录的时间戳减去当前样本的时间戳。因此,每个样本中的周期值意味着有多少纳秒是在关闭cpu时度过的(对于这个样本的调用链)。
注:在现实中,开机记录和样本可能会丢失。为了减少准确性的损失,我们计算一个非CPU样本的周期为下一个开关记录或样本的时间戳减去当前样本的时间戳。
当通过python脚本报告时,simpleperf_report_lib.py提供SetTraceOffCpuMode()方法来控制如何报告样本:
- on-cpu模式:只报告on-cpu样本。
- off-cpu模式:只报告关闭cpu的样本。
- on-off-cpu模式:同时报告on-cpu和off-cpu的样本,可以按事件名称分割。
- mixed-on-off-cpu模式:在同一事件名称下报告on-cpu和off-cpu样本。
如果不设置,将使用混合-on-off-cpu模式来报告。
当使用 report_html.py, inferno 和 report_sample.py 时,可以通过 --trace-offcpu 选项设置报告模式。
下面是一些记录和报告跟踪offcpu配置文件的例子。
# Check if --trace-offcpu is supported by the kernel (should be available on kernel >= 4.2).
$ simpleperf list --show-features
trace-offcpu
...

# Record with --trace-offcpu.
$ simpleperf record -g -p 11904 --duration 10 --trace-offcpu -e cpu-clock

# Record system wide with --trace-offcpu.
$ simpleperf record -a -g --duration 3 --trace-offcpu -e cpu-clock

# Record with --trace-offcpu using app_profiler.py.
$ ./app_profiler.py -p com.google.samples.apps.sunflower \
    -r "-g -e cpu-clock:u --duration 10 --trace-offcpu"

# Report on-cpu samples.
$ ./report_html.py --trace-offcpu on-cpu
# Report off-cpu samples.
$ ./report_html.py --trace-offcpu off-cpu
# Report on-cpu and off-cpu samples under different event names.
$ ./report_html.py --trace-offcpu on-off-cpu
# Report on-cpu and off-cpu samples under the same event name.
$ ./report_html.py --trace-offcpu mixed-on-off-cpu
The report command
报告命令用于报告由记录命令产生的剖析数据。报告包含一个样本条目表。每个样本条目都是报告中的一行。报告命令将属于同一进程、线程、库、函数的样本归入同一样本条目。然后根据样本条目的事件计数对样本条目进行排序。
通过传递选项,我们可以决定如何过滤掉不感兴趣的样本,如何将样本分组为样本条目,以及在哪里找到剖析数据和二进制文件。
下面是一个例子。记录被分组为4个样本条目,每个条目是一行。有几列,每列显示属于一个样本条目的信息。第一列是 “开销”,它显示了当前样本条目中的事件在总事件中的百分比。由于perf事件是cpu-cycles,overhead是每个函数中使用的CPU周期的百分比。
# Reports perf.data, using only records sampled in libsudo-game-jni.so, grouping records using
# thread name(comm), process id(pid), thread id(tid), function name(symbol), and showing sample
# count for each row.
$ simpleperf report --dsos /data/app/com.example.sudogame-2/lib/arm64/libsudo-game-jni.so \
      --sort comm,pid,tid,symbol -n
Cmdline: /data/data/com.example.sudogame/simpleperf record -p 7394 --duration 10
Arch: arm64
Event: cpu-cycles (type 0, config 0)
Samples: 28235
Event count: 546356211

Overhead  Sample  Command    Pid   Tid   Symbol
59.25%    16680   sudogame  7394  7394  checkValid(Board const&, int, int)
20.42%    5620    sudogame  7394  7394  canFindSolution_r(Board&, int, int)
13.82%    4088    sudogame  7394  7394  randomBlock_r(Board&, int, int, int, int, int)
6.24%     1756    sudogame  7394  7394  @plt
设置读取剖析数据的路径
默认情况下,报告命令从当前目录下的 perf.data 读取剖析数据。但可以用-i来改变路径。
$ simpleperf report -i data/perf2.data
设置查找二进制文件的路径
为了报告函数符号,simpleperf需要读取被监控进程使用的可执行二进制文件以获得符号表和调试信息。默认情况下,这些路径是被监控进程在记录时使用的可执行二进制文件。然而,这些二进制文件在报告时可能不存在,或者不包含符号表和调试信息。所以我们可以使用-symfs来重定向这些路径。
# In this case, when simpleperf wants to read executable binary /A/b, it reads file in /A/b.
$ simpleperf report

# In this case, when simpleperf wants to read executable binary /A/b, it prefers file in
# /debug_dir/A/b to file in /A/b.
$ simpleperf report --symfs /debug_dir

# Read symbols for system libraries built locally. Note that this is not needed since Android O,
# which ships symbols for system libraries on device.
$ simpleperf report --symfs $ANDROID_PRODUCT_OUT/symbols
Filter samples
在报告时,会发生并非所有的记录都是感兴趣的。报告命令支持四个过滤器来选择感兴趣的样本。
# Report records in threads having name sudogame.
$ simpleperf report --comms sudogame

# Report records in process 7394 or 7395
$ simpleperf report --pids 7394,7395

# Report records in thread 7394 or 7395.
$ simpleperf report --tids 7394,7395

# Report records in libsudo-game-jni.so.
$ simpleperf report --dsos /data/app/com.example.sudogame-2/lib/arm64/libsudo-game-jni.so
Group samples into sample entries
报告命令使用–排序来决定如何对样本条目进行分组。
# Group records based on their process id: records having the same process id are in the same
# sample entry.
$ simpleperf report --sort pid

# Group records based on their thread id and thread comm: records having the same thread id and
# thread name are in the same sample entry.
$ simpleperf report --sort tid,comm

# Group records based on their binary and function: records in the same binary and function are in
# the same sample entry.
$ simpleperf report --sort dso,symbol

# Default option: --sort comm,pid,tid,dso,symbol. Group records in the same thread, and belong to
# the same function in the same binary.
$ simpleperf report
Report call graphs
要报告通话图,请确保剖析数据与通话图一起记录,如这里。
simpleperf report -g
举例
simpleperf record -a -g --duration 10 --exclude-perf -o /sdcard/perf.log2

adb pull /sdcard/perf.log2

cp   perf.log2  system/extras/simpleperf/scripts/
./report_html.py -i ./perf.log2 如果这个命令运行出错,应该是python脚本的问题,需安装对应脚本,例如 sudo apt install python3.9,查看脚本python3.9 --version ,运行
python3.9 report_html.py -i ./perf13.log2
最终会生成report.html
| 参考链接 |
| Executable commands reference |
| Scripts reference |
| simpleperf |