Matlab基础
Matlab基础
- 目录
-
- Matlab变量
-
- 特殊常量
- 变量的命名规则
- 变量定义与赋值
- 变量的显示
- 变量的存取
- 变量的清楚
- 变量的检查
- 数组和矩阵
-
- 一维数组的创建和元素提取
-
- 一维数组的创建
- 一维数组的提取
- 二维数组的创建与元素提取
-
- 二维数组的创建
- 二维矩阵元素提取
- 字符数组和空数组
- 矩阵的基本算术运算
- 数据可视化
-
- 二维可视化
-
- 颜色、标记、线形、坐标轴标注和范围
- 标题和图例标注
- hold
- 双纵坐标、多子图绘制
- 三维数据可视化
- mesh、surf、动图
- 程序设计
-
- 基本语法
- 函数
- 其他常用命令
- 数据分析函数库
- 其他数学分析函数
目录
Matlab变量
特殊常量
变量的命名规则
变量定义与赋值
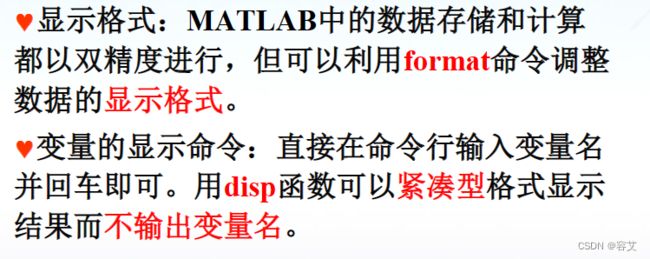
变量的显示
A = magic(3)
disp('这是一个三行三列的魔方')
disp(A)


A =

     8     1     6
     3     5     7
     4     9     2

这是一个三行三列的魔方
     8     1     6
     3     5     7
     4     9     2


A = magic(3);
disp('这是一个三行三列的魔方')
disp(A)


这是一个三行三列的魔方
     8     1     6
     3     5     7
     4     9     2

%区别数值加;则不显示
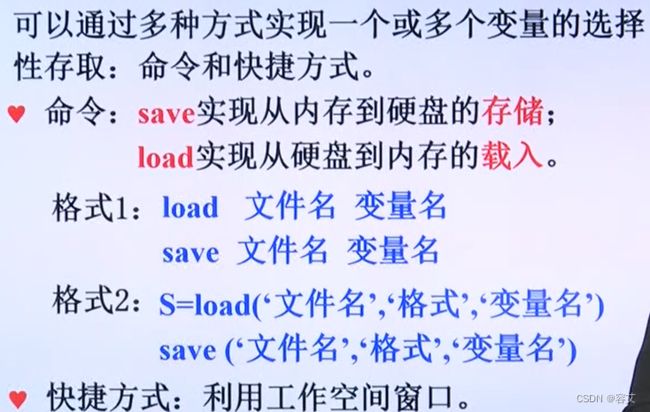
变量的存取
变量的清楚
变量的检查
A = magic(3)
who A
whos A

A =

     8     1     6
     3     5     7
     4     9     2


您的变量为:

A

  Name      Size            Bytes  Class     Attributes

  A         3x3                72  double
数组和矩阵
一维数组的创建和元素提取
一维数组的创建
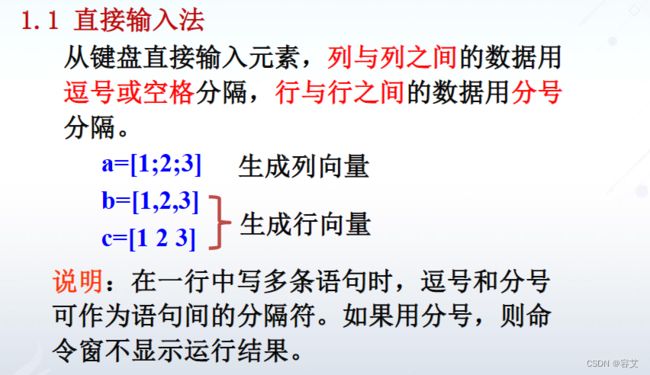
- 直接输入法
%直接输入法
a = [1;2;3;] %列向量
b = [1,2,3]
c = [1 2 3] %行向量


a =

     1
     2
     3


b =

     1     2     3


c =

     1     2     3
a = 1:2:6
b = 1:10

a =

     1     3     5


b =

     1     2     3     4     5     6
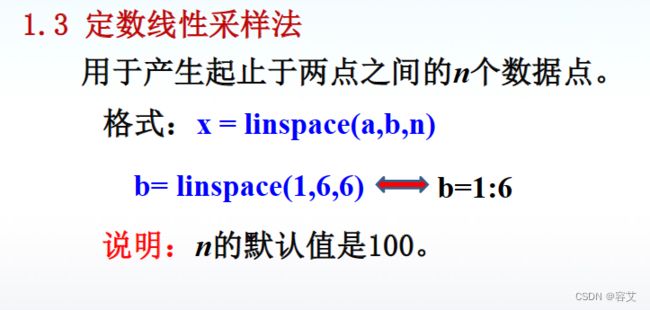
a = linspace(1,6,6)
b = linspace(1,10,5)

a =

     1     2     3     4     5     6


b =

    1.0000    3.2500    5.5000    7.7500   10.0000
a = 1:1:3
b = linspace(5,20,4)
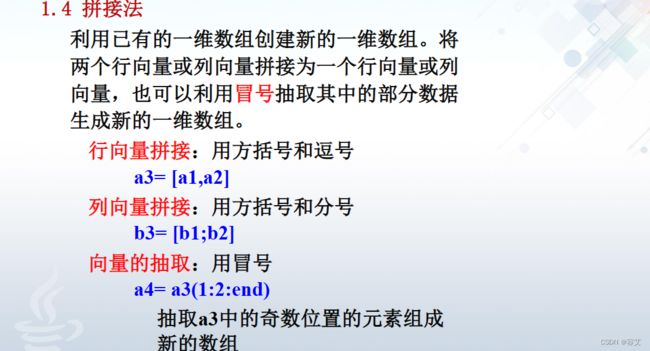
c = [a,b]
d = [a';b']
e = a(1:2:end)
f = a(2:2:end)

a =

     1     2     3


b =

     5    10    15    20


c =

     1     2     3     5    10    15    20


d =

     1
     2
     3
     5
    10
    15
    20


e =

     1     3


f =

     2
一维数组的提取
二维数组的创建与元素提取
二维数组的创建
a = [1,2,3;4,5,6;7,8,9]

a =

     1     2     3
     4     5     6
     7     8     9
二维矩阵元素提取
a = [1,2,3;4,5,6;7,8,9]
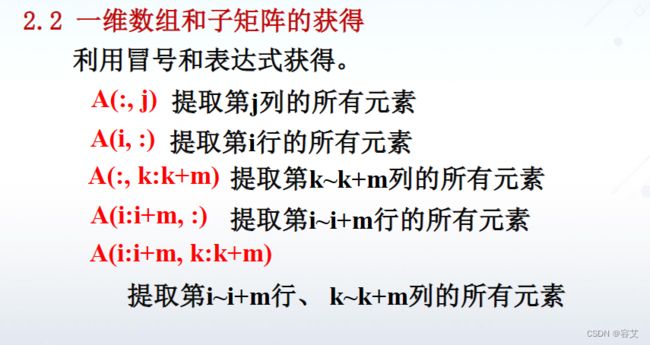
a1 = a(:,2)
a2 = a(1,:)
a3 = a(:,2:3)
a4 = a(1:2,:)
a5 = a(1:2,1:2)

a =

     1     2     3
     4     5     6
     7     8     9


a1 =

     2
     5
     8


a2 =

     1     2     3


a3 =

     2     3
     5     6
     8     9


a4 =

     1     2     3
     4     5     6


a5 =

     1     2
     4     5
字符数组和空数组
s1 = 'welcome to';
s2 = ' Beijing';
s3 = [s1,s2];
s4 = ['welcome to',s2];
disp(s3)
disp(s4)

welcome to Beijing
welcome to Beijing
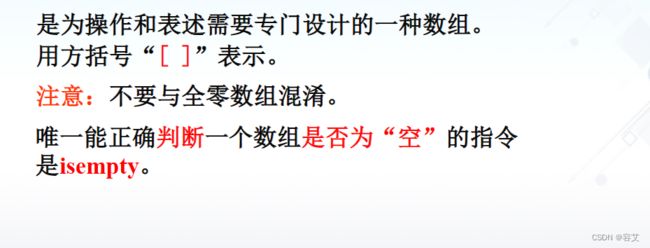
- 空数组介绍
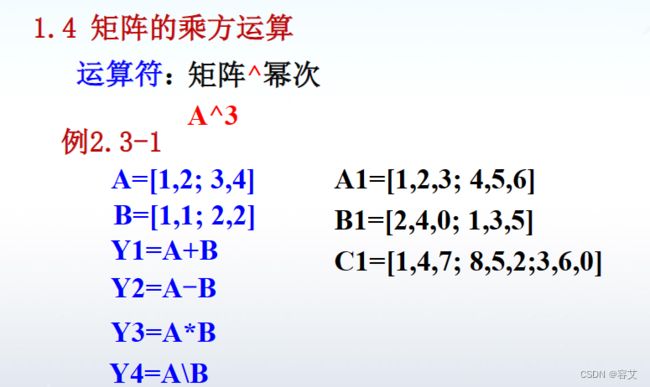
矩阵的基本算术运算
数据可视化
二维可视化
颜色、标记、线形、坐标轴标注和范围
颜色为英文首字母
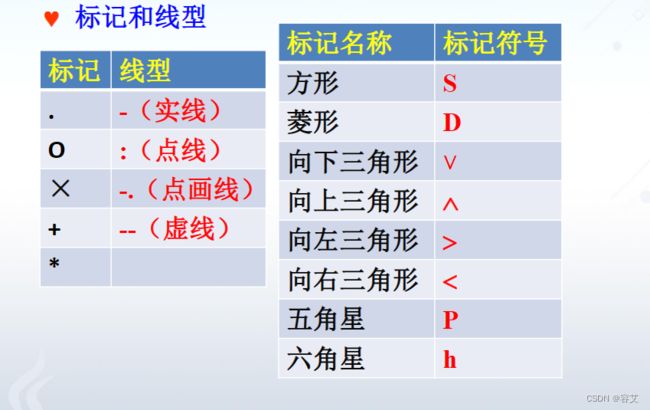
标记和线型
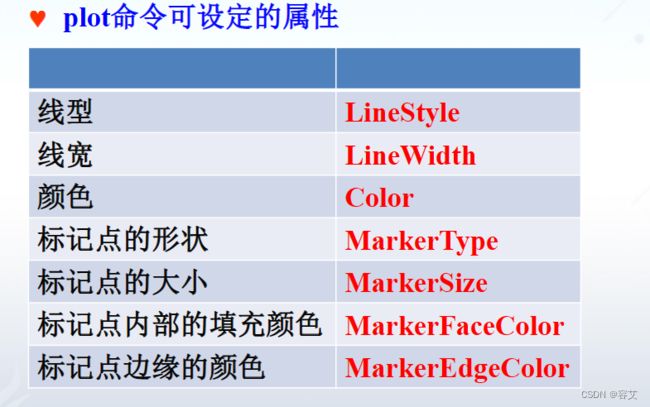
plot可设置的属性
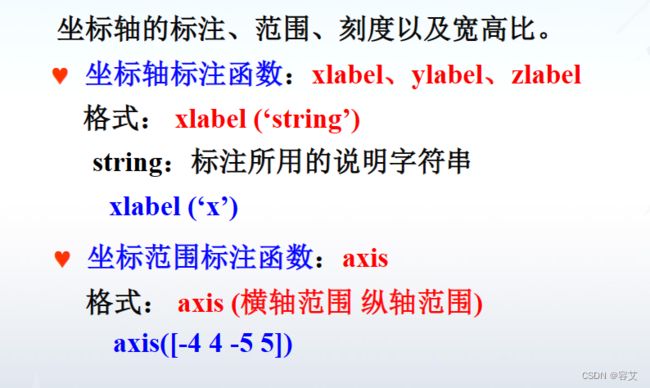
坐标轴标注和范围
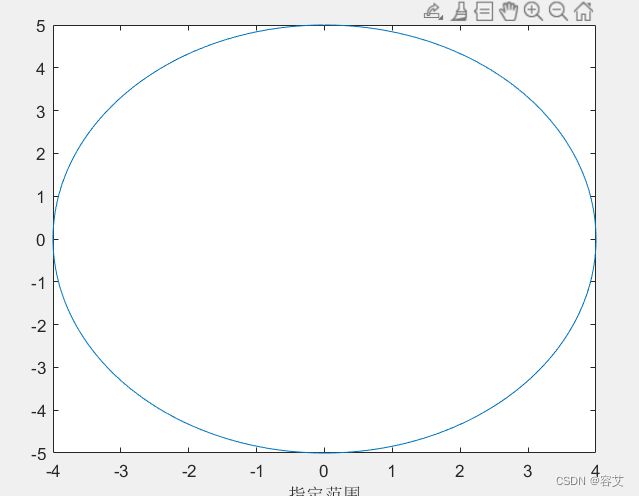
实例
t = 0:0.02:2*pi;
x = 4*sin(t);
y = 5*cos(t);
plot(x,y)
xlabel('指定范围')
axis([-4 4 -5 5])
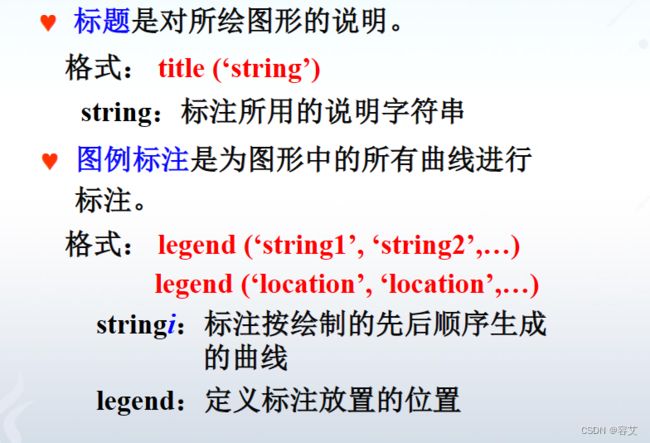
标题和图例标注
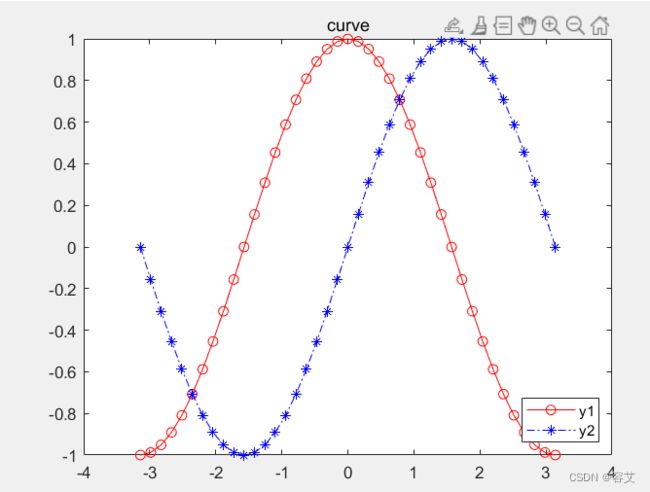
实例
x = -pi:pi/20:pi;
y1 = cos(x);
y2 = sin(x);
plot(x,y1,'-ro',x,y2,'-.b*')
title('curve')
legend('y1','y2','location','southeast')
hold
hold on/off 主要用来保存图像
双纵坐标、多子图绘制
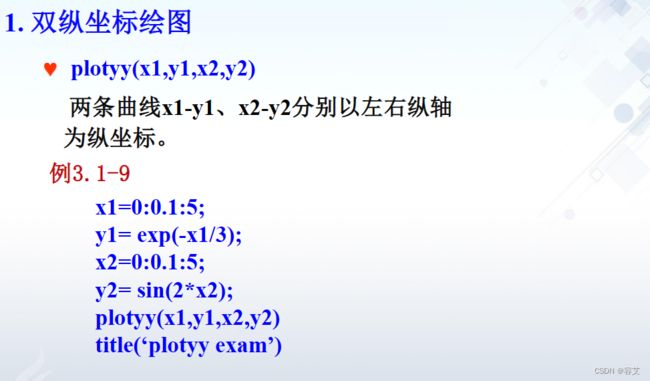
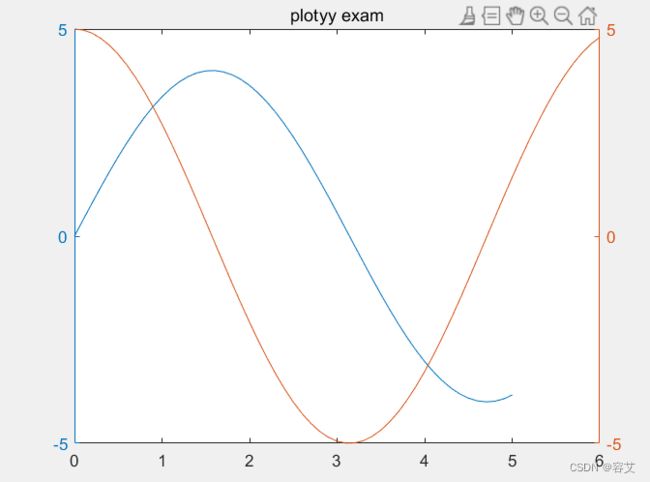
双纵坐标
x = 0:0.1:5;
y = 4*sin(x);
x1 = 0:0.1:6;
y1 = 5*cos(x1);
plotyy(x,y,x1,y1)
title('plotyy exam')
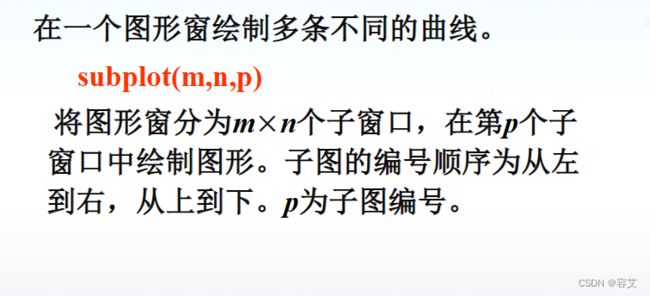
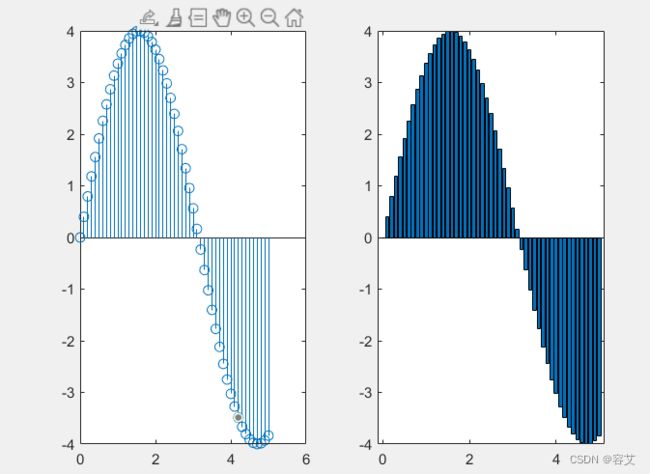
多子图绘制
x = 0:0.1:5;
y = 4*sin(x);
subplot(1,2,1),stem(x,y)
title('stem(x,y)')
subplot(1,2,2),bar(x,y)
多图绘制
x = 0:0.1:5;
y = 4*sin(x);
figure(1)
plot(x,y,'+b')
figure(2)
plot(x,y,'*r')
三维数据可视化
x = 0:pi/20:pi;
y = sin(x);
z = cos(x);
plot3(x,y,z)
title('plot3 exam')
grid%给图片加上网格
- grid:给图片加上网格
mesh、surf、动图
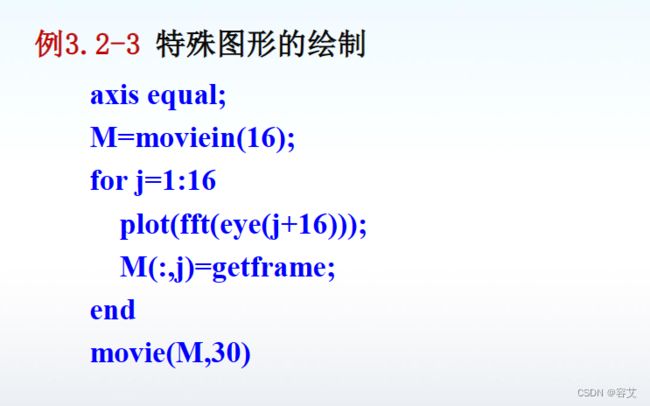
动图例子
大多数用不上,后续如果深入学习,则进行补充
程序设计
基本语法
- 顺序结构
- 选择结构
- 循环结构
以下为:
程序控制结构详情
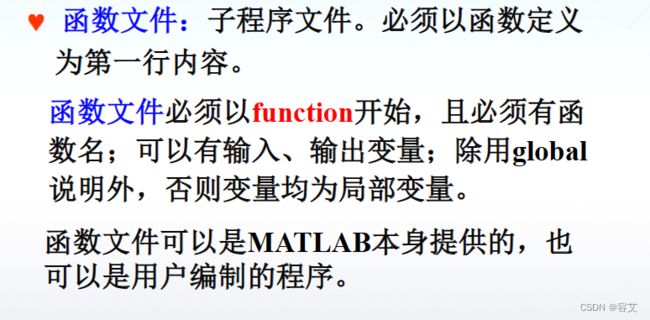
函数
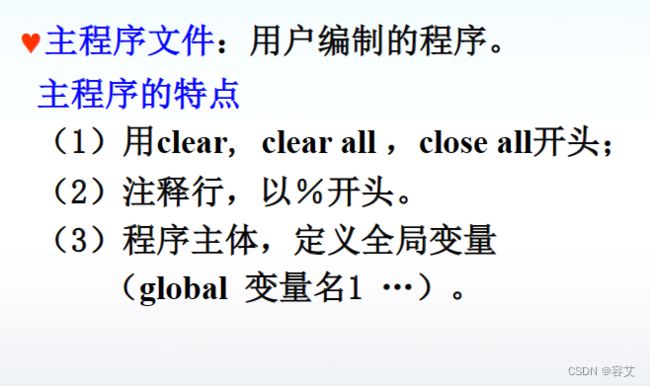
主程序的特点
用户定义的函数
y = hum(3);
disp(y)
function y = hum(x)
y = 1./((x-0.3).^2+0.01)+1./((x-0.9).^2+0.04)-6;
end

   -5.6383
其他常用命令
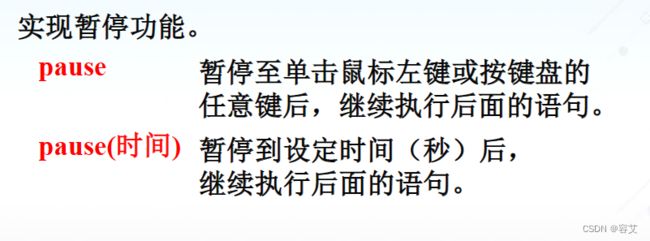
- pause
- input
pause命令
input命令
数据分析函数库
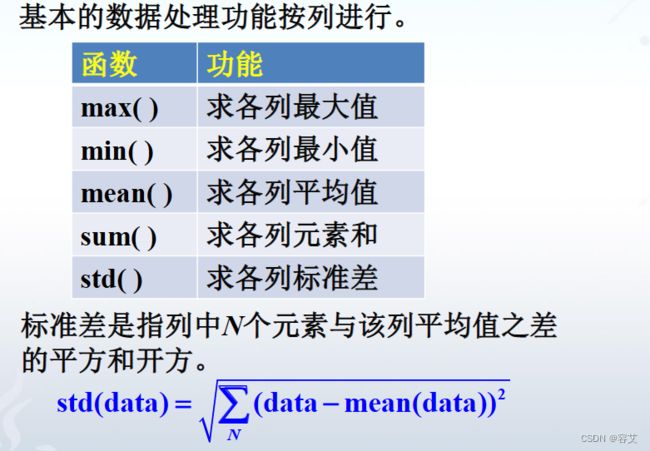
- 基本的数据分析
- 随机函数
- 相关性分析函数
基本的数据分析
随机函数
相关性分析函数
其他数学分析函数
- 多项式函数库
- 非线性函数分析及函数的数值分析
- 线性微分方程的解
后续补充!!!


