使用ggplot2画 点图、箱线图、小提琴图、蜂窝图、云雨图
使用ggplot2画 点图、箱线图、小提琴图、蜂窝图、云雨图
加载包
library(tidyverse)
library(cowplot)
library(ggrepel)
library(ggsci)
library(ggsignif) # 计算相关性
library(ggbeeswarm) #蜂窝
library(gghalves) #云雨
准备数据集
data(iris) #常用数据集,研究花萼的长度不同物种有何差异
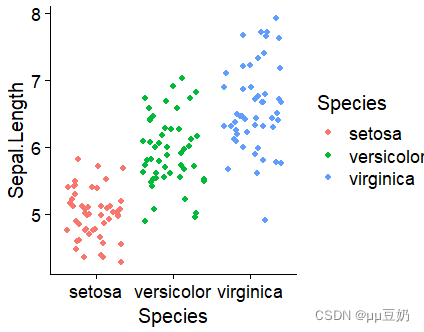
点图
ggplot(data = iris,aes(x = Species,y = Sepal.Length))+
  geom_point(position = 'jitter',aes(color = Species))+
  theme_cowplot()
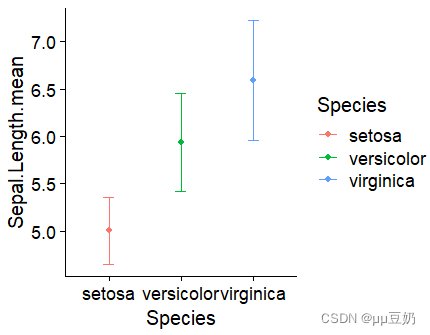
errbar
iris_sum <- group_by(iris,Species) %>%
  summarise(Sepal.Length.mean = mean(Sepal.Length),
            Sepal.Length.sd = sd(Sepal.Length))


ggplot(data = iris_sum , aes(x = Species,y = Sepal.Length.mean))+
  geom_point(aes(color = Species))+
  geom_errorbar(aes(ymin = Sepal.Length.mean - Sepal.Length.sd,
                    ymax = Sepal.Length.mean + Sepal.Length.sd,
                    color = Species),width = 0.15)+
  theme_cowplot()
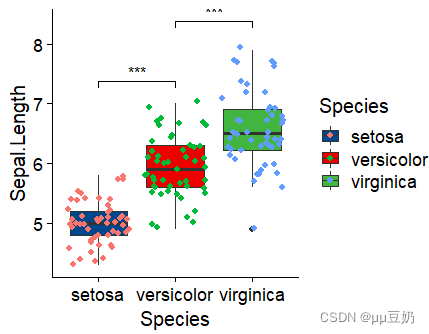
箱线图
ggplot(data = iris , aes(x = Species,y = Sepal.Length))+
  geom_boxplot(aes(fill = Species))+
  geom_point(aes(color = Species),position = 'jitter')+  #jitter 是点的一个摆动
  geom_signif(
    comparisons = list(c("setosa","versicolor"),
                       c("versicolor","virginica")),
    y_position = c(7.2,8.2),
    map_signif_level = T
  )+
  scale_fill_lancet()+
  theme_cowplot()
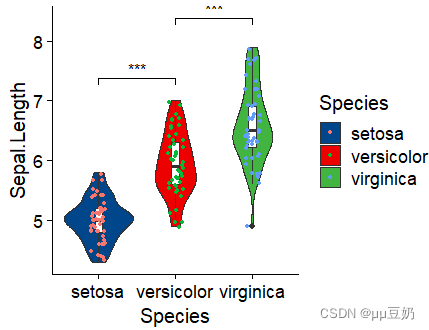
小提琴图
ggplot(data = iris , aes(x = Species,y = Sepal.Length))+
  geom_violin(aes(fill = Species))+
  geom_boxplot(width =0.1)+
  geom_point(aes(color = Species),position = position_jitter(width =  0.1),
             size = 0.8)+
  geom_signif(
    comparisons = list(c("setosa","versicolor"),
                       c("versicolor","virginica")),
    y_position = c(7.2,8.2),
    map_signif_level = T
  )+
  scale_fill_lancet()+
  theme_cowplot()
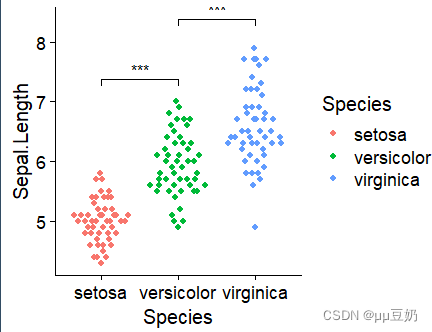
蜂窝图
ggplot(data = iris , aes(x = Species,y = Sepal.Length))+
  geom_quasirandom(aes(color = Species))+
  geom_signif(
    comparisons = list(c("setosa","versicolor"),
                       c("versicolor","virginica")),
    y_position = c(7.2,8.2),
    map_signif_level = T
  )+
  scale_fill_lancet()+
  theme_cowplot()
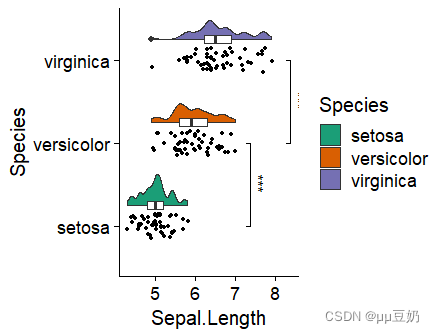
云雨图
ggplot(data = iris , aes(x = Species,y = Sepal.Length))+
  geom_half_violin(aes(fill = Species),
                   side = 'r',  #云的方向
                   adjust = 1/2, #平滑程度
                   position = position_nudge(x=0.25,y=0))+
  geom_boxplot(width =0.1,position = position_nudge(x=0.25,y=0))+
  geom_point(position = position_jitter(width = 0.15),
             size = 0.8)+
  geom_signif(
    comparisons = list(c("setosa","versicolor"),
                       c("versicolor","virginica")),
    y_position = c(7.2,8.2),
    map_signif_level = T
  )+
  scale_fill_brewer(palette = 'Dark2')+
  theme_cowplot() +
  coord_flip()   #逆时针旋转
两组数据分布小提琴两侧
ggplot(data = iris , aes(x = Species,y = Sepal.Length))+
  geom_half_violin(fill = 'red',
                   side = 'r',  #云的方向
                   adjust = 1/2, #平滑程度
                  )+
  geom_half_violin(aes(y = Petal.Length),fill ='blue',
                   side = 'l',
                   adjust = 1/2)+
  scale_fill_brewer(palette = 'Dark2')+
  theme_cowplot()+
  coord_flip()
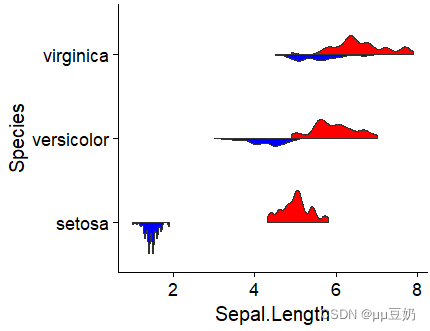
因为数据不好所以看起来有点怪异,请君见谅。
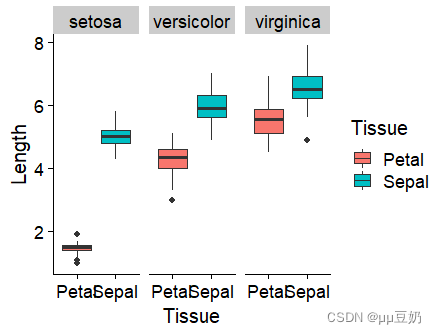
比较同一物种花萼和花瓣的长度
iris_tidy <- select(iris,Sepal = Sepal.Length,Petal = Petal.Length,Species)%>%
  gather(key = Tissue ,value = Length ,Sepal,Petal)

head(iris_tidy)

ggplot(data = iris_tidy, aes(x =Tissue,y=Length))+
  geom_boxplot(aes(fill = Tissue))+
  facet_grid(~Species)+ #写波浪线后代表以x轴分面,写在前以y轴来分。
  theme_cowplot()
小结
星期五了,过的好快,明天是中秋节与教师节,提前祝大家中秋快乐,祝坚守在一线的老师们教师节快乐,劳动最光荣,学习最美丽,望君多点赞,有啥问题直接留言,我很乐意解决大家的问题,和志同道合的人一起冲,很快乐。哈哈哈哈哈哈哈哈哈。