用python做Cox分析的三个库的介绍和体验
用python做Cox分析的三个常见库的介绍和体验
跟时间相关的数据分析(预测模型),一个是时间序列(X随时间变化),另外一个就是Cox(y随时间变化),都有专门的包,statsmodel、lifelines和scikit-survival 是python中做Cox分析常见的三个文库,各有特点,所以充分了解和应用这三个库是有助于做好Cox分析。
注意 请选择本人发布的镜像:survival-imbalance-auto-sklearn以运行该项目。
目录
statsmodels: 从统计学的角度来展示各种cox类数据相关的参数
lifelines:更加丰富的单因素和回归模型,特点在于可视化
scikit-survival:提供非线性生存模型和变量筛选的cox模型(弹性网络等),主要作用是构建Cox预测模型
statsmodels
具体来说,这个库特点在于提供cox分析相关的各种统计学参数,比如生存曲线比较的p值, 或变量的参数及其置信区间等,相关内容可以参见statsmodels文档,总体来说这个库对cox着墨不多,仅提供了生存函数和经典的cox分析,没有看到其提供风险函数等功能。
生存函数(KM曲线)及其检验
import statsmodels.api as sm
import pandas as pd
# data = sm.datasets.get_rdataset("flchain", "survival").data
data=pd.read_csv('/home/mw/project/data.csv')
print(data)
df = data.loc[data.sex == "F", :]
sf = sm.SurvfuncRight(df["futime"], df["death"])
output:
      Unnamed: 0  age sex  sample.yr  kappa  lambda  flc.grp  creatinine  \
0              0   97   F       1997  5.700   4.860       10         1.7
1              1   92   F       2000  0.870   0.683        1         0.9
2              2   94   F       1997  4.360   3.850       10         1.4
3              3   92   F       1996  2.420   2.220        9         1.0
4              4   93   F       1996  1.320   1.690        6         1.1
...          ...  ...  ..        ...    ...     ...      ...         ...
7869        7869   52   F       1995  1.210   1.610        6         1.0
7870        7870   52   F       1999  0.858   0.581        1         0.8
7871        7871   54   F       2002  1.700   1.720        8         NaN
7872        7872   53   F       1995  1.710   2.690        9         NaN
7873        7873   50   F       1998  1.190   1.250        4         0.7

      mgus  futime  death      chapter
0        0      85      1  Circulatory
1        0    1281      1    Neoplasms
2        0      69      1  Circulatory
3        0     115      1  Circulatory
4        0    1039      1  Circulatory
...    ...     ...    ...          ...
7869     0    4997      0          NaN
7870     0    3652      0          NaN
7871     0    2507      0          NaN
7872     0    4982      0          NaN
7873     0    3995      0          NaN

[7874 rows x 12 columns]
#logrank test
stat, pv = sm.duration.survdiff(data.futime, data.death, data.sex)
# Fleming-Harrington with p=1, i.e. weight by pooled survival time
stat, pv = sm.duration.survdiff(data.futime, data.death, data.sex, weight_type='fh', fh_p=1)

# Gehan-Breslow, weight by number at risk
stat, pv = sm.duration.survdiff(data.futime, data.death, data.sex, weight_type='gb')

# Tarone-Ware, weight by the square root of the number at risk
stat, pv = sm.duration.survdiff(data.futime, data.death, data.sex, weight_type='tw')
print(stat,pv)
output:
3.3382091480008587 0.06768824289512954
经典的Cox分析
import statsmodels.api as sm
import statsmodels.formula.api as smf

del data["chapter"]
data = data.dropna()
data["lam"] = data["lambda"]
data["female"] = (data["sex"] == "F").astype(int)
data["year"] = data["sample.yr"] - min(data["sample.yr"])
status = data["death"].values

mod = smf.phreg("futime ~ 0 + age + female + creatinine + "
                "np.sqrt(kappa) + np.sqrt(lam) + year + mgus",
                data, status=status, ties="efron")
rslt = mod.fit()
print(rslt.summary())
output:
/opt/conda/lib/python3.8/site-packages/statsmodels/duration/hazard_regression.py:414: UserWarning: PHReg formulas should not include any '0' or '1' terms
  warnings.warn("PHReg formulas should not include any '0' or '1' terms")
                           Results: PHReg
====================================================================
Model:                      PH Reg         Sample size:         6524
Dependent variable:         futime         Num. events:         1962
Ties:                       Efron
--------------------------------------------------------------------
                log HR log HR SE   HR      t    P>|t|  [0.025 0.975]
--------------------------------------------------------------------
age             0.1012    0.0025 1.1065 40.9289 0.0000 1.1012 1.1119
female         -0.2817    0.0474 0.7545 -5.9368 0.0000 0.6875 0.8280
creatinine      0.0134    0.0411 1.0135  0.3271 0.7436 0.9351 1.0985
np.sqrt(kappa)  0.4047    0.1147 1.4988  3.5288 0.0004 1.1971 1.8766
np.sqrt(lam)    0.7046    0.1117 2.0230  6.3056 0.0000 1.6251 2.5183
year            0.0477    0.0192 1.0489  2.4902 0.0128 1.0102 1.0890
mgus            0.3160    0.2532 1.3717  1.2479 0.2121 0.8350 2.2532
====================================================================
Confidence intervals are for the hazard ratios
小结:这个库还有一个特点就是可以在函数内使用类似R语言的方程,从而提供了很多的变化。与另外两个库相比,其生存分析的函数功能不够丰富,例如没有风险函数;可视化功能不够强大,lifelines内建了许多可视化的图。
lifelines
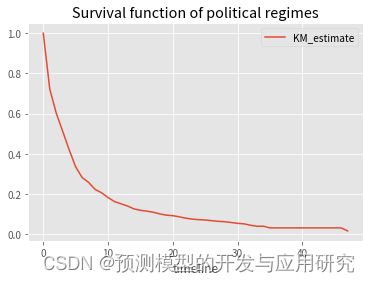
这个库是在statsmodel基础上的一个丰富, 令人印象深刻的是其可视化功能, 另外生存数据的单变量分析模型和回归模型方面也引入了更多的模型。相关内容可参见文档
from lifelines.datasets import load_dd
data = load_dd()
data.head()
T = data["duration"]
E = data["observed"]

from lifelines import KaplanMeierFitter
kmf = KaplanMeierFitter()
kmf.fit(T, event_observed=E)
<lifelines.KaplanMeierFitter:"KM_estimate", fitted with 1808 total observations, 340 right-censored observations>

from matplotlib import pyplot as plt
plt.style.use('ggplot')
kmf.survival_function_.plot()
plt.title('Survival function of political regimes');
累计风险函数
from lifelines import NelsonAalenFitter
naf = NelsonAalenFitter()
naf.fit(T,event_observed=E)

print(naf.cumulative_hazard_.head())
naf.plot_cumulative_hazard()
          NA_estimate
timeline
0.0          0.000000
1.0          0.325912
2.0          0.507356
3.0          0.671251
4.0          0.869867
<matplotlib.axes._subplots.AxesSubplot at 0x7f0e25ad8c70>
小结: 其它的图形包括QQ图, 样本示意图(类似流星雨的那种图),这个库还有一个特点就是处理“左删失”数据(没研究过)。
scikit-survival
这个库的功能显然是为了预测, 其提供了像随机生存森林等非线性的模型,以及Lasso、Ridge和弹性网络模型的Cox版本用于筛选变量。
各方面原因,这里只展示简单功能。
import pandas as pd
import matplotlib.pyplot as plt
import numpy as np
%matplotlib inline

from sklearn.model_selection import train_test_split
from sklearn.preprocessing import OrdinalEncoder
from sksurv.ensemble import GradientBoostingSurvivalAnalysis
from sksurv.datasets import load_gbsg2
from sklearn.preprocessing import OneHotEncoder
from sksurv.ensemble import RandomSurvivalForest
from sksurv.linear_model import CoxPHSurvivalAnalysis

X, y = load_gbsg2()
grade_str = X.loc[:, "tgrade"].astype(object).values[:, np.newaxis]
grade_num = OrdinalEncoder(categories=[["I", "II", "III"]]).fit_transform(grade_str)
X_no_grade = X.drop("tgrade", axis=1)

Xt=pd.get_dummies(X_no_grade,columns=['horTh','menostat'],drop_first=True)
# X_no_grade[['horTh','menostat']] = OneHotEncoder(dropfirst=True).fit_transform(X_no_grade[['horTh','menostat']])

Xt.loc[:,"tgrade"] = grade_num
print(Xt)
random_state = 20
X_train, X_test, y_train, y_test = train_test_split(
    Xt, y, test_size=0.25, random_state=random_state)

estimator = CoxPHSurvivalAnalysis().fit(X_train, y_train)
chf_funcs = estimator.predict_cumulative_hazard_function(X_test)

for fn in chf_funcs:
    plt.step(fn.x, fn(fn.x), where="post")

plt.ylim(0, 1)
plt.show()


