回归预测 | MATLAB实现INFO-ELM向量加权算法优化极限学习机多输入单输出回归预测
回归预测 | MATLAB实现INFO-ELM向量加权算法优化极限学习机多输入单输出回归预测
目录
-
- 回归预测 | MATLAB实现INFO-ELM向量加权算法优化极限学习机多输入单输出回归预测
-
- 效果一览
- 基本介绍
- 程序设计
- 参考资料
效果一览
基本介绍
1.MATLAB实现INFO-ELM向量加权算法优化极限学习机多输入单输出回归预测;
2.输入7个特征,输出1个,即多输入单输出;
3.运行环境Matlab2018及以上,运行主程序main即可,其余为函数文件无需运行,所有程序放在一个文件夹,data为数据集;
4.INFO-ELM向量加权算法优化极限学习机权值和偏置,命令窗口输出RMSE、MAE、R2、MAPE等评价指标。
程序设计
- 完整程序和数据下载方式1(资源处直接下载):MATLAB实现INFO-ELM向量加权算法优化极限学习机多输入单输出回归预测
- 完整程序和数据下载方式2(订阅《ELM极限学习机》专栏,同时可阅读《ELM极限学习机》专栏收录的所有内容,数据订阅后私信我获取):MATLAB实现INFO-ELM向量加权算法优化极限学习机多输入单输出回归预测
- 完整程序和数据下载方式3(订阅《智能学习》专栏,同时获取《智能学习》专栏收录程序6份,数据订阅后私信我获取):MATLAB实现INFO-ELM向量加权算法优化极限学习机多输入单输出回归预测
%%  优化参数设置
Particles_no =  6;                                  % 种群数量
Max_iter     = 50;                                  % 设定最大迭代次数
dim = hiddennum * inputnum + hiddennum;             % 优化参数个数
lb  = -1 * ones(1, dim);                            % 优化参数目标下限
ub  =  1 * ones(1, dim);                            % 优化参数目标上限

%%  优化算法
fobj = @(x)fun(x, p_train, t_train, hiddennum);
[Best_pos,Best_score, curve] = INFO(Particles_no, Max_iter, lb, ub, dim, fobj);

%%  获取最优权值
w1 = Best_pos(1 : inputnum * hiddennum);
B1 = Best_pos(inputnum * hiddennum + 1 : inputnum * hiddennum + hiddennum);

IW = reshape(w1, hiddennum, inputnum);
B  = reshape(B1, hiddennum, 1);

%%  网络训练
[IW, B, LW, TF, TYPE] = elmtrain(p_train, t_train, 'sig', 0, IW, B);

%%  网络预测
T_sim1 = elmpredict(p_train, IW, B, LW, TF, TYPE);
T_sim2 = elmpredict(p_test , IW, B, LW, TF, TYPE);

%%  均方根误差
error1 = sqrt(sum((T_sim1 - T_train).^2) ./ M);
error2 = sqrt(sum((T_sim2 - T_test ).^2) ./ N);

%%  绘图
figure
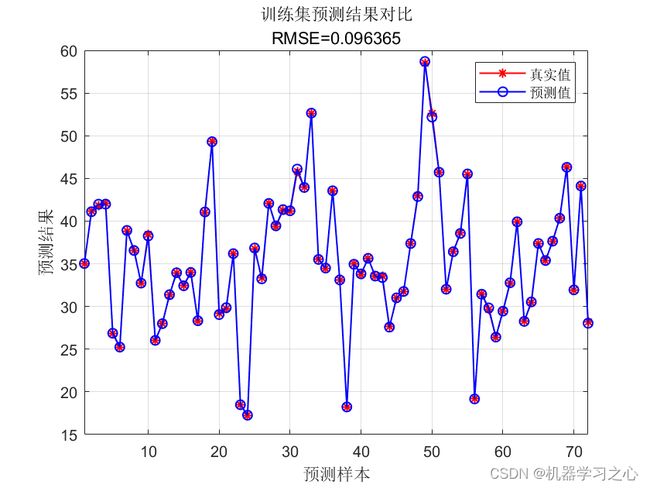
plot(1: M, T_train, 'r-*', 1: M, T_sim1, 'b-o', 'LineWidth', 1)
legend('真实值','预测值')
xlabel('预测样本')
ylabel('预测结果')
string = {'训练集预测结果对比'; ['RMSE=' num2str(error1)]};
title(string)
xlim([1, M])
grid

figure
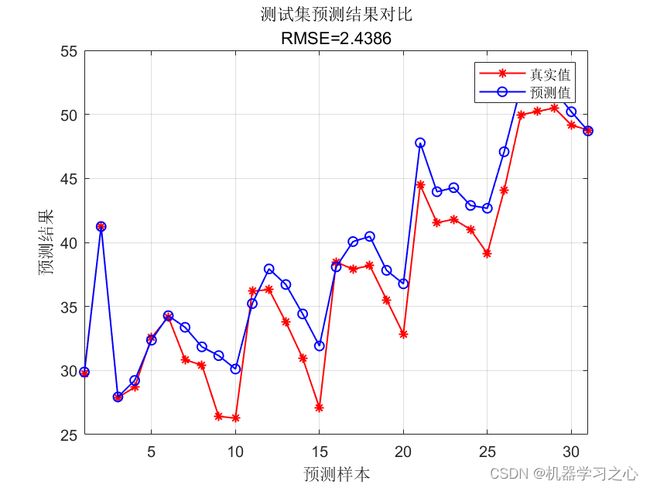
plot(1: N, T_test, 'r-*', 1: N, T_sim2, 'b-o', 'LineWidth', 1)
legend('真实值','预测值')
xlabel('预测样本')
ylabel('预测结果')
string = {'测试集预测结果对比';['RMSE=' num2str(error2)]};
title(string)
xlim([1, N])
grid

%%  适应度曲线
figure;
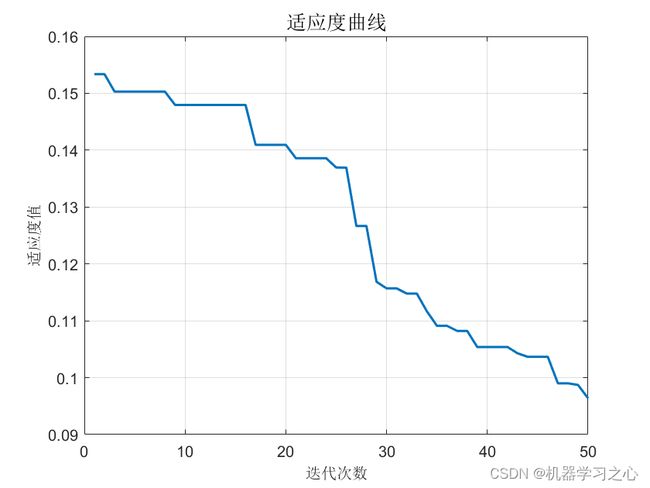
plot(1 : length(curve), curve, 'LineWidth', 1.5);
title('适应度曲线', 'FontSize', 13);
xlabel('迭代次数', 'FontSize', 10);
ylabel('适应度值', 'FontSize', 10);
grid
%%  相关指标计算
%  R2
R1 = 1 - norm(T_train - T_sim1)^2 / norm(T_train - mean(T_train))^2;
R2 = 1 - norm(T_test -  T_sim2)^2 / norm(T_test -  mean(T_test ))^2;

disp(['训练集数据的R2为:', num2str(R1)])
disp(['测试集数据的R2为:', num2str(R2)])

%  MAE
mae1 = sum(abs(T_sim1 - T_train)) ./ M ;
mae2 = sum(abs(T_sim2 - T_test )) ./ N ;

disp(['训练集数据的MAE为:', num2str(mae1)])
disp(['测试集数据的MAE为:', num2str(mae2)])

%  MBE
mbe1 = sum(T_sim1 - T_train) ./ M ;
mbe2 = sum(T_sim2 - T_test ) ./ N ;

disp(['训练集数据的MBE为:', num2str(mbe1)])
disp(['测试集数据的MBE为:', num2str(mbe2)])
%-------------------------------------------------------------------------------------------------------------------------
function [Best_pos,Best_Cost,curve,avcurve]=INFO(pop,Max_iter,lb,ub,dim,fobj)
%% Initialization
        Cost=zeros(pop,1);
        M=zeros(pop,1);

        X=initialization(pop,dim,ub,lb);

        for i=1:pop
           Cost(i) = fobj(X(i,:));
           M(i)=Cost(i);
        end

        [~, ind]=sort(Cost);
        Best_pos = X(ind(1),:);
        Best_Cost = Cost(ind(1));

        Worst_Cost = Cost(ind(end));
        Worst_X = X(ind(end),:);

        I=randi([2 5]);
        Better_X=X(ind(I),:);
        Better_Cost=Cost(ind(I));

%% Main Loop of INFO
        for it=1:Max_iter
            alpha=2*exp(-4*(it/Max_iter));                                                           % Eqs. (5.1) & % Eq. (9.1)

            M_Best=Best_Cost;
            M_Better=Better_Cost;
            M_Worst=Worst_Cost;

            for i=1:pop

               % Updating rule stage
                del=2*rand*alpha-alpha;                                                           % Eq. (5)
                sigm=2*rand*alpha-alpha;                                                          % Eq. (9)

                % Select three random solution
                A1=randperm(pop);
                A1(A1==i)=[];
                a=A1(1);b=A1(2);c=A1(3);

                e=1e-25;
                epsi=e*rand;

                omg = max([M(a) M(b) M(c)]);
                MM = [(M(a)-M(b)) (M(a)-M(c)) (M(b)-M(c))];

                W(1) = cos(MM(1)+pi)*exp(-(MM(1))/omg);                                           % Eq. (4.2)
                W(2) = cos(MM(2)+pi)*exp(-(MM(2))/omg);                                           % Eq. (4.3)
                W(3)= cos(MM(3)+pi)*exp(-(MM(3))/omg);                                            % Eq. (4.4)
                Wt = sum(W);

                WM1 = del.*(W(1).*(X(a,:)-X(b,:))+W(2).*(X(a,:)-X(c,:))+ ...                      % Eq. (4.1)
                    W(3).*(X(b,:)-X(c,:)))/(Wt+1)+epsi;

                omg = max([M_Best M_Better M_Worst]);
                MM = [(M_Best-M_Better) (M_Best-M_Better) (M_Better-M_Worst)];

                W(1) = cos(MM(1)+pi)*exp(-MM(1)/omg);                                             % Eq. (4.7)
                W(2) = cos(MM(2)+pi)*exp(-MM(2)/omg);                                             % Eq. (4.8)
                W(3) = cos(MM(3)+pi)*exp(-MM(3)/omg);                                             % Eq. (4.9)
                Wt = sum(W);

                WM2 = del.*(W(1).*(Best_pos-Better_X)+W(2).*(Best_pos-Worst_X)+ ...                   % Eq. (4.6)
                    W(3).*(Better_X-Worst_X))/(Wt+1)+epsi;

                % Determine MeanRule
                r = unifrnd(0.1,0.5);
                MeanRule = r.*WM1+(1-r).*WM2;                                                     % Eq. (4)

                if rand<0.5
                    z1 = X(i,:)+sigm.*(rand.*MeanRule)+randn.*(Best_pos-X(a,:))/(M_Best-M(a)+1);
                    z2 = Best_pos+sigm.*(rand.*MeanRule)+randn.*(X(a,:)-X(b,:))/(M(a)-M(b)+1);
                else                                                                              % Eq. (8)
                    z1 = X(a,:)+sigm.*(rand.*MeanRule)+randn.*(X(b,:)-X(c,:))/(M(b)-M(c)+1);
                    z2 = Better_X+sigm.*(rand.*MeanRule)+randn.*(X(a,:)-X(b,:))/(M(a)-M(b)+1);
                end

               % Vector combining stage
                u=zeros(1,dim);
                for j=1:dim
                    mu = 0.05*randn;
                    if rand <0.5
                        if rand<0.5
                            u(j) = z1(j) + mu*abs(z1(j)-z2(j));                                   % Eq. (10.1)
                        else
                            u(j) = z2(j) + mu*abs(z1(j)-z2(j));                                   % Eq. (10.2)
                        end
                    else
                        u(j) = X(i,j);                                                            % Eq. (10.3)
                    end
                end

                % Local search stage
                if rand<0.5
                    L=rand<0.5;v1=(1-L)*2*(rand)+L;v2=rand.*L+(1-L);                              % Eqs. (11.5) & % Eq. (11.6)
                    Xavg=(X(a,:)+X(b,:)+X(c,:))/3;                                                % Eq. (11.4)
                    phi=rand;
                    Xrnd = phi.*(Xavg)+(1-phi)*(phi.*Better_X+(1-phi).*Best_pos);                   % Eq. (11.3)
                    Randn = L.*randn(1,dim)+(1-L).*randn;
                    if rand<0.5
                        u = Best_pos + Randn.*(MeanRule+randn.*(Best_pos-X(a,:)));                    % Eq. (11.1)
                    else
                        u = Xrnd + Randn.*(MeanRule+randn.*(v1*Best_pos-v2*Xrnd));                  % Eq. (11.2)
                    end

                end

                % Check if new solution go outside the search space and bring them back
                New_X= BC(u,lb,ub);
                New_Cost = fobj(New_X);

                if New_Cost<Cost(i)
                    X(i,:)=New_X;
                    Cost(i)=New_Cost;
                    M(i)=Cost(i);
                    if Cost(i)<Best_Cost
                        Best_pos=X(i,:);
                        Best_Cost = Cost(i);
                    end
                end
            end

            % Determine the worst solution
            [~, ind]=sort(Cost);
            Worst_X=X(ind(end),:);
            Worst_Cost=Cost(ind(end));
            % Determine the better solution
            I=randi([2 5]);
            Better_X=X(ind(I),:);
            Better_Cost=Cost(ind(I));
            % Update Convergence_curve
            curve(it)=Best_Cost;
            avcurve(it)=sum(curve)/length(curve);
            % Show Iteration Information
            %disp(['Iteration ' num2str(it) ',: Best Cost = ' num2str(Best_Cost)]);
        end

end


function X = BC(X,lb,ub)
Flag4ub=X>ub;
Flag4lb=X<lb;
X=(X.*(~(Flag4ub+Flag4lb)))+ub.*Flag4ub+lb.*Flag4lb;
end
参考资料
[1] https://blog.csdn.net/kjm13182345320/article/details/129215161
[2] https://blog.csdn.net/kjm13182345320/article/details/128105718


