flume 进阶 Ganglia 部署(十二)
规划安装
hadoop100: web gmetad gmod epel-release
hadoop101: gmod epel-release
hadoop102: gmod epel-release
安装
三台都安装
sudo yum -y install epel-release
sudo yum -y install ganglia-gmond
在hadoop100安装
sudo yum -y install ganglia-gmetad
sudo yum -y install ganglia-web
修改配置
以下只在hadoop100操作
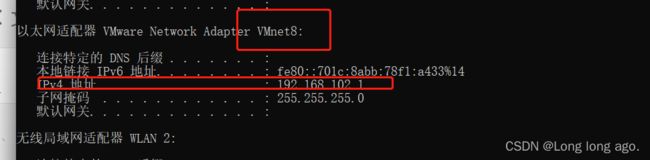
查看虚拟机的ip
vim /etc/httpd/conf.d/ganglia.conf
# Ganglia monitoring system php web frontend
#
Alias /ganglia /usr/share/ganglia
/ganglia>
 # Require local
# 通过 windows 访问 ganglia,需要配置 Linux 对应的主机(windows)ip 地址
 Require ip 192.168.102.1
 # Require ip 10.1.2.3
 # Require host example.org
</Location>

sudo vim /etc/ganglia/gmetad.conf
data_source "my cluster" hadoop100

以下在三台机器都要修改,且配置是一样的,分发就好
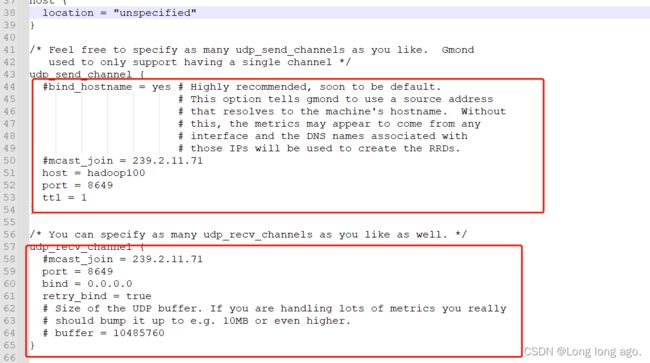
sudo vim /etc/ganglia/gmond.conf
网上的配置都是这样是吧,文件是这个样子,也能启动成功,但是有坑
// 以下为要修改部分
cluster {
  name = "my cluster" //要对应
  owner = "unspecified"
  latlong = "unspecified"
  url = "unspecified"
}
udp_send_channel {
  #bind_hostname = yes # Highly recommended, soon to be default. # This option tells gmond to use a source address # that resolves to the machine's hostname.  Without # this, the metrics may appear to come from any # interface and the DNS names associated with # those IPs will be used to create the RRDs.
  # mcast_join = 239.2.11.71
  host = hadoop100
  port = 8649
  ttl = 1
}
udp_recv_channel {
  # mcast_join = 239.2.11.71
  port = 8649
  bind = 0.0.0.0
  retry_bind = true
  # Size of the UDP buffer. If you are handling lots of metrics you really
  # should bump it up to e.g. 10MB or even higher.
  # buffer = 10485760
}
启动
sudo systemctl start gmond
sudo systemctl start httpd
sudo systemctl start gmetad
访问
http://hadoop100/ganglia/
发现提示
You don’t have permission to access /ganglia on this server.
在hadoop100执行
sudo chmod -R 777 /var/lib/ganglia
重新启动如果还会报
vim /etc/httpd/conf.d/ganglia.conf
# Ganglia monitoring system php web frontend
#
Alias /ganglia /usr/share/ganglia
/ganglia>
 # Require local
# 通过 windows 访问 ganglia,需要配置 Linux 对应的主机(windows)ip 地址
 Require all granted
 # Require ip 10.1.2.3
 # Require host example.org
</Location>
重新启动,发现启动成功了
ganglia启动成功,但是没有souce,gmond也没报错
查看gmetad状态发现报
May 18 06:23:21 hadoop100 gmetad[44225]: data_thread() got no answer from any [my cluster] datasource
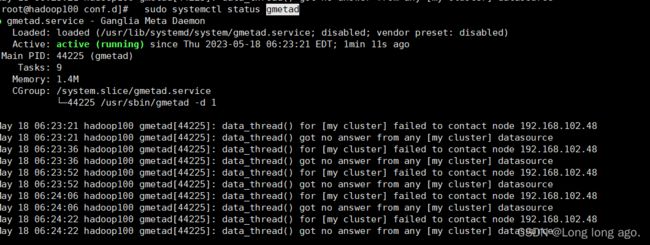
这是因为gmond配置错误
在修改gmond文件,不要覆盖文件,因为版本不同可能文件也不同,修改指定地方就可以
sudo vim /etc/ganglia/gmond.conf

完整配置如下
/* This configuration is as close to 2.5.x default behavior as possible
   The values closely match ./gmond/metric.h definitions in 2.5.x */
globals {
  daemonize = yes
  setuid = yes
  user = ganglia
  debug_level = 0
  max_udp_msg_len = 1472
  mute = no
  deaf = no
  allow_extra_data = yes
  host_dmax = 86400 /*secs. Expires (removes from web interface) hosts in 1 day */
  host_tmax = 20 /*secs */
  cleanup_threshold = 300 /*secs */
  gexec = no
  # By default gmond will use reverse DNS resolution when displaying your hostname
  # Uncommeting following value will override that value.
  # override_hostname = "mywebserver.domain.com"
  # If you are not using multicast this value should be set to something other than 0.
  # Otherwise if you restart aggregator gmond you will get empty graphs. 60 seconds is reasonable
  send_metadata_interval = 0 /*secs */

}

/*
 * The cluster attributes specified will be used as part of the
 * tag that will wrap all hosts collected by this instance.
 */
cluster {
  name = "my cluster"
  owner = "unspecified"
  latlong = "unspecified"
  url = "unspecified"
}

/* The host section describes attributes of the host, like the location */
host {
  location = "unspecified"
}

/* Feel free to specify as many udp_send_channels as you like.  Gmond
   used to only support having a single channel */
udp_send_channel {
  #bind_hostname = yes # Highly recommended, soon to be default.
                       # This option tells gmond to use a source address
                       # that resolves to the machine's hostname.  Without
                       # this, the metrics may appear to come from any
                       # interface and the DNS names associated with
                       # those IPs will be used to create the RRDs.
  #mcast_join = 239.2.11.71
  host = hadoop100
  port = 8649
  ttl = 1
}

/* You can specify as many udp_recv_channels as you like as well. */
udp_recv_channel {
  #mcast_join = 239.2.11.71
  port = 8649
  bind = 0.0.0.0
  retry_bind = true
  # Size of the UDP buffer. If you are handling lots of metrics you really
  # should bump it up to e.g. 10MB or even higher.
  # buffer = 10485760
}

/* You can specify as many tcp_accept_channels as you like to share
   an xml description of the state of the cluster */
tcp_accept_channel {
  port = 8649
  # If you want to gzip XML output
  gzip_output = no
}

/* Channel to receive sFlow datagrams */
#udp_recv_channel {
#  port = 6343
#}

/* Optional sFlow settings */
#sflow {
# udp_port = 6343
# accept_vm_metrics = yes
# accept_jvm_metrics = yes
# multiple_jvm_instances = no
# accept_http_metrics = yes
# multiple_http_instances = no
# accept_memcache_metrics = yes
# multiple_memcache_instances = no
#}

/* Each metrics module that is referenced by gmond must be specified and
   loaded. If the module has been statically linked with gmond, it does
   not require a load path. However all dynamically loadable modules must
   include a load path. */
modules {
  module {
    name = "core_metrics"
  }
  module {
    name = "cpu_module"
    path = "modcpu.so"
  }
  module {
    name = "disk_module"
    path = "moddisk.so"
  }
  module {
    name = "load_module"
    path = "modload.so"
  }
  module {
    name = "mem_module"
    path = "modmem.so"
  }
  module {
    name = "net_module"
    path = "modnet.so"
  }
  module {
    name = "proc_module"
    path = "modproc.so"
  }
  module {
    name = "sys_module"
    path = "modsys.so"
  }
}

/* The old internal 2.5.x metric array has been replaced by the following
   collection_group directives.  What follows is the default behavior for
   collecting and sending metrics that is as close to 2.5.x behavior as
   possible. */

/* This collection group will cause a heartbeat (or beacon) to be sent every
   20 seconds.  In the heartbeat is the GMOND_STARTED data which expresses
   the age of the running gmond. */
collection_group {
  collect_once = yes
  time_threshold = 20
  metric {
    name = "heartbeat"
  }
}

/* This collection group will send general info about this host*/
collection_group {
  collect_every = 60
  time_threshold = 60
  metric {
    name = "cpu_num"
    title = "CPU Count"
  }
  metric {
    name = "cpu_speed"
    title = "CPU Speed"
  }
  metric {
    name = "mem_total"
    title = "Memory Total"
  }
  metric {
    name = "swap_total"
    title = "Swap Space Total"
  }
  metric {
    name = "boottime"
    title = "Last Boot Time"
  }
  metric {
    name = "machine_type"
    title = "Machine Type"
  }
  metric {
    name = "os_name"
    title = "Operating System"
  }
  metric {
    name = "os_release"
    title = "Operating System Release"
  }
  metric {
    name = "location"
    title = "Location"
  }
}

/* This collection group will send the status of gexecd for this host
   every 300 secs.*/
/* Unlike 2.5.x the default behavior is to report gexecd OFF. */
collection_group {
  collect_once = yes
  time_threshold = 300
  metric {
    name = "gexec"
    title = "Gexec Status"
  }
}

/* This collection group will collect the CPU status info every 20 secs.
   The time threshold is set to 90 seconds.  In honesty, this
   time_threshold could be set significantly higher to reduce
   unneccessary  network chatter. */
collection_group {
  collect_every = 20
  time_threshold = 90
  /* CPU status */
  metric {
    name = "cpu_user"
    value_threshold = "1.0"
    title = "CPU User"
  }
  metric {
    name = "cpu_system"
    value_threshold = "1.0"
    title = "CPU System"
  }
  metric {
    name = "cpu_idle"
    value_threshold = "5.0"
    title = "CPU Idle"
  }
  metric {
    name = "cpu_nice"
    value_threshold = "1.0"
    title = "CPU Nice"
  }
  metric {
    name = "cpu_aidle"
    value_threshold = "5.0"
    title = "CPU aidle"
  }
  metric {
    name = "cpu_wio"
    value_threshold = "1.0"
    title = "CPU wio"
  }
  metric {
    name = "cpu_steal"
    value_threshold = "1.0"
    title = "CPU steal"
  }
  /* The next two metrics are optional if you want more detail...
     ... since they are accounted for in cpu_system.
  metric {
    name = "cpu_intr"
    value_threshold = "1.0"
    title = "CPU intr"
  }
  metric {
    name = "cpu_sintr"
    value_threshold = "1.0"
    title = "CPU sintr"
  }
  */
}

collection_group {
  collect_every = 20
  time_threshold = 90
  /* Load Averages */
  metric {
    name = "load_one"
    value_threshold = "1.0"
    title = "One Minute Load Average"
  }
  metric {
    name = "load_five"
    value_threshold = "1.0"
    title = "Five Minute Load Average"
  }
  metric {
    name = "load_fifteen"
    value_threshold = "1.0"
    title = "Fifteen Minute Load Average"
  }
}

/* This group collects the number of running and total processes */
collection_group {
  collect_every = 80
  time_threshold = 950
  metric {
    name = "proc_run"
    value_threshold = "1.0"
    title = "Total Running Processes"
  }
  metric {
    name = "proc_total"
    value_threshold = "1.0"
    title = "Total Processes"
  }
}

/* This collection group grabs the volatile memory metrics every 40 secs and
   sends them at least every 180 secs.  This time_threshold can be increased
   significantly to reduce unneeded network traffic. */
collection_group {
  collect_every = 40
  time_threshold = 180
  metric {
    name = "mem_free"
    value_threshold = "1024.0"
    title = "Free Memory"
  }
  metric {
    name = "mem_shared"
    value_threshold = "1024.0"
    title = "Shared Memory"
  }
  metric {
    name = "mem_buffers"
    value_threshold = "1024.0"
    title = "Memory Buffers"
  }
  metric {
    name = "mem_cached"
    value_threshold = "1024.0"
    title = "Cached Memory"
  }
  metric {
    name = "swap_free"
    value_threshold = "1024.0"
    title = "Free Swap Space"
  }
}

collection_group {
  collect_every = 40
  time_threshold = 300
  metric {
    name = "bytes_out"
    value_threshold = 4096
    title = "Bytes Sent"
  }
  metric {
    name = "bytes_in"
    value_threshold = 4096
    title = "Bytes Received"
  }
  metric {
    name = "pkts_in"
    value_threshold = 256
    title = "Packets Received"
  }
  metric {
    name = "pkts_out"
    value_threshold = 256
    title = "Packets Sent"
  }
}

/* Different than 2.5.x default since the old config made no sense */
collection_group {
  collect_every = 1800
  time_threshold = 3600
  metric {
    name = "disk_total"
    value_threshold = 1.0
    title = "Total Disk Space"
  }
}

collection_group {
  collect_every = 40
  time_threshold = 180
  metric {
    name = "disk_free"
    value_threshold = 1.0
    title = "Disk Space Available"
  }
  metric {
    name = "part_max_used"
    value_threshold = 1.0
    title = "Maximum Disk Space Used"
  }
}

include ("/etc/ganglia/conf.d/*.conf")
重新启动
效果
