学习记录 -- Accurate and fast cell marker gene identification with COSG
文章目录
- brief
- 代码演示
-
-
- 安装
- 实操
-
- 个人感受
brief
单细胞数据分析当中,细胞聚类分群完成之后,我们希望得知每一个细胞类群是什么细胞,也就是细胞类型注释。
通常情况下,我们可以找到细胞类群间表达量存在差异的基因,我们认为可以标识细胞类的marker 基因就在 DE之中 ,最好是只在这一个细胞类群中表达的DE,大概率就是marker。
当利用 top rank DE 作为 marker gene 对照现存的marker list或相关数据库来做我们自己的细胞类型注释,可能存在一些问题。比如一个细胞数目比较多的类群和一个细胞数目比较少的类群都表达XXX gene,XXX gene在统计学意义上是 细胞数目较多类群的DE,rank也会比较靠前。如果XXX gene是maker ,那对应的小类群细胞也应该是某种意义上的相同细胞,不过在统计学意义上XXX gene不是小类群的DE,更不会被识别为marker。
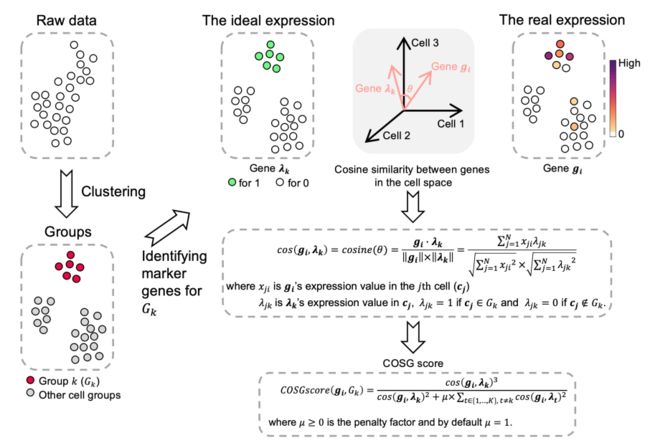
COSG的作者认为,如果细胞类群特异性表达的基因为marker,那么其他的marker gene应该存在类似的表达模式,同时目标细胞类群和其它细胞类群之间呈现出不同的表达模式。个人认为这里的表达模式可以简单理解为是共表达或者高度线性相关。
-
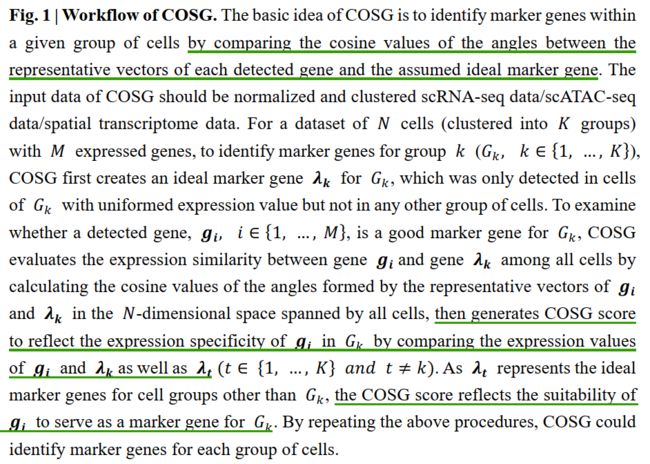
第一步:基于现有的分群情况,COSG首先对每个细胞类群 Gk 鉴定出一个 artificial gene λk,这个基因的表达特征是:只在目标细胞类群中表达,且不在其它任何一个细胞类群中有表达。
-
第二步:假设一共有k个细胞,那么每个基因的表达情况就是一个 k维的向量 gi(在每个细胞中的表达量作为一个维度,对于k维向量的大部分元素值为0,对于计算余弦值好像没多少影响)。
-
第三步计算 gi 在目标细胞类群中与该目标类群artificial gene λk 的表达向量之间的夹角;再计算 gi 与 其它细胞类群的artificial gene λt 的表达向量之间的夹角。
-
第四步:循环计算细胞类群 Gk 中的每个 gi 与 **λk**之间的余弦值,选取余弦值小的 gi 作为待选marker。
-
第五步:在其他细胞类群中循环上述第三四步的过程。
代码演示
安装
# install.packages('remotes')
remotes::install_github(repo = 'genecell/COSGR')
实操
# 先利用 ifnb单细胞数据集走一道 seurat提供的分析流程

# split the dataset into a list of two seurat objects (stim and CTRL)
ifnb.list <- SplitObject(ifnb, split.by = "stim")

# normalize and identify variable features for each dataset independently
ifnb.list <- lapply(X = ifnb.list, FUN = function(x) {
  x <- NormalizeData(x)
  x <- FindVariableFeatures(x, selection.method = "vst", nfeatures = 2000)
})

# select features that are repeatedly variable across datasets for integration
features <- SelectIntegrationFeatures(object.list = ifnb.list)
immune.anchors <- FindIntegrationAnchors(object.list = ifnb.list, anchor.features = features)
immune.combined <- IntegrateData(anchorset = immune.anchors)

DefaultAssay(immune.combined) <- "integrated"

# Run the standard workflow for visualization and clustering
immune.combined <- ScaleData(immune.combined, verbose = FALSE)
immune.combined <- RunPCA(immune.combined, npcs = 30, verbose = FALSE)
immune.combined <- RunUMAP(immune.combined, reduction = "pca", dims = 1:30)
immune.combined <- FindNeighbors(immune.combined, reduction = "pca", dims = 1:30)
immune.combined <- FindClusters(immune.combined, resolution = 0.5)

# For performing differential expression after integration, we switch back to the original data
DefaultAssay(immune.combined) <- "RNA"

seurat_marker_to_all <- FindMarkers(immune.combined, ident.1 = 1, verbose = FALSE,only.pos = T)
head(seurat_marker_to_all[order(seurat_marker_to_all$avg_log2FC,decreasing = T),], n = 15)
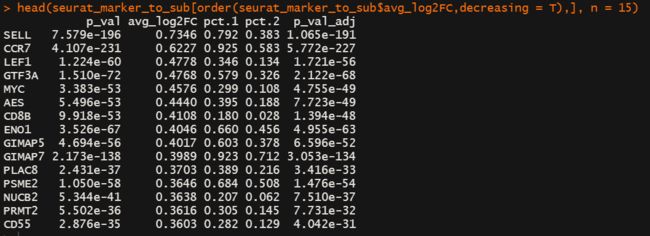
seurat_marker_to_sub <- FindMarkers(immune.combined, ident.1 = 1, ident.2 = 2, verbose = FALSE,only.pos = T)
head(seurat_marker_to_sub[order(seurat_marker_to_sub$avg_log2FC,decreasing = T),], n = 15)
# 我们利用Seurat的聚类结果以及COSG工具试试看 marker gene的结果
library(COSG)
# Run COSG:
marker_cosg_all <- cosg(
  immune.combined,
  groups='all',
  assay='RNA',
  slot='data',
  mu=10,
  remove_lowly_expressed=TRUE,
  expressed_pct=0.25,
  n_genes_user=100)

marker_cosg_sub <- cosg(
  immune.combined,
  groups=c(1,2),
  assay='RNA',
  slot='data',
  mu=10,
  remove_lowly_expressed=TRUE,
  expressed_pct=0.25,
  n_genes_user=100)

head(cbind(marker_cosg_all$names[,2],marker_cosg_all$scores[,2]),n = 15)
head(cbind(marker_cosg_sub$names[,2],marker_cosg_sub$scores[,2]),n = 15)
个人感受
从上面的结果来看呢!!!
我们使用了seurat中FindMarkers函数,
结果1是 把gene from target cluster 与 gene from all others cells进行比较,
结果2 把gene from target cluster 与 gene from other subcluster 进行比较,
结果1和 结果2 相比很稳定。
使用COSG时,把group设置为all,表示gene from target cluster 与 gene from all others cells进行比较,结果与seurat的结果也蛮相似的。
但是当我把group 设置为c(1,2)时,类似于 gene from target cluster 与 gene from other subcluster 进行比较,得到的结果完全不一样了。
相同软件内部结果不一样,不同软件的结果更不一样了,所以这个COSG工具的group设置蛮重要的。
究其根本原因,笔者认为是 group变少了 所以那个 cluster unique gene 或者说是前文提到的 λk 选择变了,导致结果差异很大。
那为什么Seurat 中 gene from target cluster 与 gene from other subcluster 进行比较与 gene from target cluster 与 gene from all others cells进行比较的结果稳定呢?


