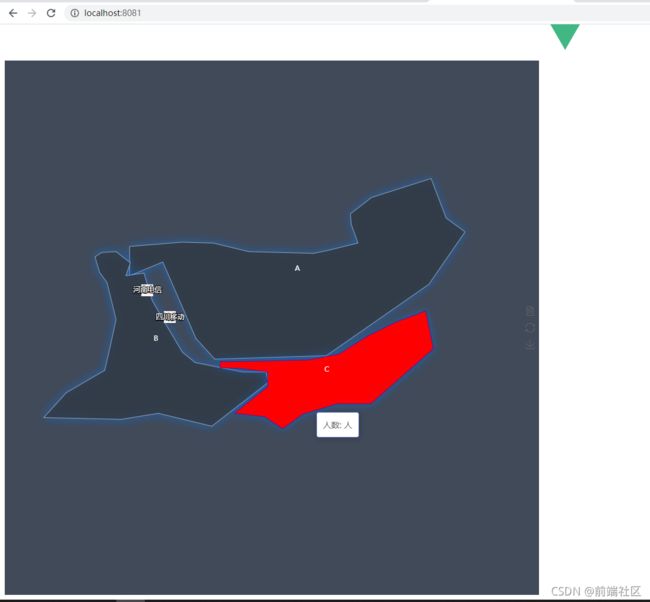
echarts地图自定义区域(并添加标记)
一、安装echarts
npm i echarts --save
二、引入注册
// main.js
import * as echarts from 'echarts';
Vue.prototype.$echarts = echarts
三、绘制自定义区域并下载geojson
1、打开网站 http://geojson.io/
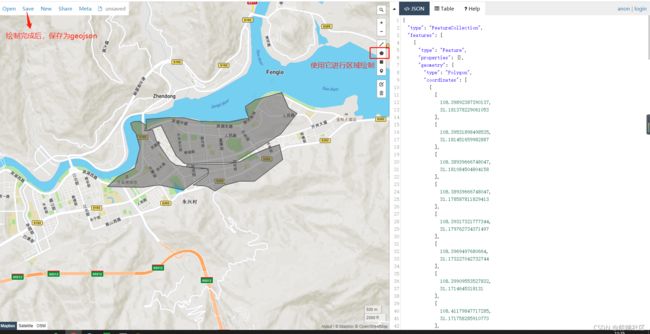
2、项目中新建map.json,将geojson的内容复制到map.json里面
四、使用
1、将map.json引入到当前页面
import map from "../assets/map.json"
2、注册地图
this.mychart = this.$echarts.init(document.getElementById("mychart"));
this.$echarts.registerMap("china", map);
五、标点实现
注意:symbol如果是网络图片要以image://为开头
var markPointData = [{
	name: "四川移动",
	coord: [
		108.393982, 31.175037 //坐标,通过高德
	],
	selected: false,
	symbol: 'image://https://img1.baidu.com/it/u=777884207,2018784782&fm=26&fmt=auto&gp=0.jpg', // 标注图片地址路径
	symbolSize: 20,
}, {
	name: "河南电信",
	coord: [
		108.391429, 31.177332
	],
	selected: false,
	symbol: 'image://https://img1.baidu.com/it/u=777884207,2018784782&fm=26&fmt=auto&gp=0.jpg', // 标注图片地址路径
	symbolSize: 20,
}];

//series代码块
series:[
	{
		name: 'mark',
		type: 'map',
		mapType: 'china',
		hoverable: false,
		roam: true,
		data: [],
		markPoint: { //图标标注。
			label: {
				normal: {
					show: true,
					formatter: function(params) { //标签内容       如果只显示图片则隐藏
						return params.name;
					},
				},
			},
			itemStyle: {
				normal: {
					color: 'none'
				},
			},
			data: markPointData
		}

	}
]
五、完成代码
<template>
	<div id="mychart" style="width: 900px;height: 900px;"></div>
</template>

<script>
	import chila from "../assets/china.json"
	export default {
		mounted() {
			this.$nextTick(() => {
				this.mychart = this.$echarts.init(document.getElementById("mychart"));
				this.$echarts.registerMap("china", chila);

				var features = chila.features;
				var empty = [];
				features.forEach((item, i) => {
					empty.push({
						id: i + 1,
						name: item.properties.name,
					});
				})
				var markPointData = [{
					name: "四川移动",
					coord: [
						108.393982, 31.175037 //坐标,通过高德
					],
					selected: false,
					symbol: 'image://https://img1.baidu.com/it/u=777884207,2018784782&fm=26&fmt=auto&gp=0.jpg', // 标注图片地址路径
					symbolSize: 20,
				}, {
					name: "河南电信",
					coord: [
						108.391429, 31.177332
					],
					selected: false,
					symbol: 'image://https://img1.baidu.com/it/u=777884207,2018784782&fm=26&fmt=auto&gp=0.jpg', // 标注图片地址路径
					symbolSize: 20,
				}];
				let option = {
					backgroundColor: "#404a59",
					tooltip: {
						trigger: "item",
						formatter: function(val) {
							return "人数: 人";
						},
					},
					toolbox: {
						show: true,
						orient: "vertical",
						left: "right",
						top: "center",
						feature: {
							dataView: {
								readOnly: false
							},
							restore: {},
							saveAsImage: {},
						},
					},
					series: [{
							type: "map",
							mapType: "china", // 自定义扩展图表类型
							label: {
								show: true,
							},
							center: [108.412361, 31.170204], //当前视角的中心点
							zoom: 250, //当前视角的缩放比例
							itemStyle: {
								normal: {
									areaColor: "#323c48",
									borderColor: "white",
									label: {
										show: true,
										color: "white",
									},
									shadowColor: 'rgba(0, 120, 255, 0.5)', //外发光
									shadowBlur: 15
								},
								emphasis: {
									borderColor: "blue",
									areaColor: "red",
									label: {
										show: true,
										color: "white",
									},
								},
							},
							roam: true,
							data: empty,
							markPoint: { //图标标注。
								label: {
									normal: {
										show: true,
										formatter: function(params) { //标签内容       如果只显示图片则隐藏
											return params.name;
										},
									},
								},
								itemStyle: {
									normal: {
										color: 'none'
									},
								},
								data: markPointData
							},
						},
						{
							name: 'mark',
							type: 'map',
							mapType: 'china',
							hoverable: false,
							roam: true,
							data: [],
							markPoint: { //图标标注。
								label: {
									normal: {
										show: true,
										formatter: function(params) { //标签内容       如果只显示图片则隐藏
											return params.name;
										},
									},
								},
								itemStyle: {
									normal: {
										color: 'none'
									},
								},
								data: markPointData
							}

						}
					],
				};
				this.mychart.on("click", function(params) { //单击
					console.log(params);
				});
				this.mychart.setOption(option);
			})
		}
	}
</script>

<!-- Add "scoped" attribute to limit CSS to this component only -->
<style scoped>

</style>
六、效果图