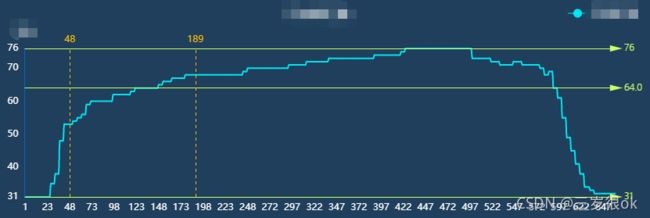
echarts动态设置y轴刻度的最大值、最小值、平均值

如上图所示,我需要给我的曲线绘制y轴的刻度线,分别为最大值(76)、平均值(64.0)、最小值(31)。
根据不同条件展示不同的数据,因此,我的x,y轴数据都需要是动态的
思路如下:
1- 初始化图形(关键用到:特殊值 ‘dataMin’)
2- 根据条件查询数据之后通过setOption赋值给series中的data
3- 在没有设置y轴坐标轴yMax和yMin的前提下获取y轴坐标最大值,这个值由echarts自动生成
根据echarts本身自带的函数,可自动获取所需数值
方法一:获取y轴刻度的方法:
1.获取Y轴最大值/最小值的方法:
Y轴最大值
var yMax = myChart.getModel().getComponent('yAxis').axis.scale._extent[1];
Y轴最小值
var yMin = myChart.getModel().getComponent('yAxis').axis.scale._extent[0];

X轴最小值
var xMin = myChart.getModel().getComponent('xAxis').axis.scale._extent[0];
X轴最大值
var xMax = myChart.getModel().getComponent('xAxis').axis.scale._extent[1];
关键在于 _extent;
_extent:得到的结果是一个数组
2.获取范围的方法:(ps:人家真的写的很不错)
参考文档:https://blog.csdn.net/yixiongmao/article/details/104202890
方法二:设置特殊值 ‘dataMin’,取数据在该轴上的最小/大值作为最小/大刻度。
参考文档:https://www.w3cschool.cn/echarts_tutorial/echarts_tutorial-no3h2cul.html
@@@---------------------------------------------------------------------分割线
以下是我的代码~ 虽然不必要的代码很多,但是为了以后我翻看,还是都放了上来,关于最大值,最小值,和平均值关键还在在 yAxis和series的markline这里~
//初始化加载页面
var seriesData = [];
var myChart = echarts.init(document.getElementById(id));
        var myOption = {
            title: {
                text: "",
                textStyle: {
                    color: 'white',
                    fontWeight: 400,
                    fontSize: 16
                },
                left: 'center',
                top: '0%'
            },
            tooltip: {
                trigger: "axis",
                axisPointer: {
                    lineStyle: {
                        color: "#dddc6b"
                    }
                },
                formatter: function (params) {
                    return params[0].seriesName + '
' + params[0].marker + ' ' + params[0].data[0] + ' : ' + params[0].data[1];
                }
            },
            legend: {
                x: "right",
                textStyle: {
                    color: "white",
                    fontSize: 12
                },
            },
            grid: {
                top: '20%',
                bottom: '5%',
                left: '2%',
                right: '4%',
                containLabel: true
            },
            xAxis: [{
                id: 'x0',
                type: "category",
                boundaryGap: true,
                axisLabel: {
                    textStyle: {
                        color: "#FFF",
                        fontSize: 12
                    }
                },
                axisLine: {
                    lineStyle: {
                        color: "#0066CC"
                    }
                },
                axisTick: {
                    show: false
                },
            }, {
                axisPointer: {
                    show: false
                },
                axisLine: {
                    show: false
                },
                position: "bottom",
                offset: 20
            }],
            yAxis: [{
                id: '2',
                name: yName,
                nameTextStyle: {
                    color: '#FFF',
                    fontSize: 12,
                },
                type: "value",
                min: 'dataMin',
                max: 'dataMax',
                axisTick: {
                    show: false
                },
                axisLine: {
                    lineStyle: {
                        color: "#0066CC"
                    }
                },
                axisLabel: {
                    formatter: '{value}',
                    textStyle: {
                        color: "#FFF",
                        fontSize: 12
                    }
                },
                splitLine: {
                    show: false
                }
            }],
            series: [{
				id:'serie0',
                type: 'line',
                z: 1,
                data: seriesData,
                symbolSize: 1,
                symbol: 'circle',
                smooth: true,
                itemStyle: {
                    normal: {
                        color: 'rgba(0,245,255,0.9)'
                    }
                },
                markLine: {
                    symbol: ['none', 'triangle'],
                    silent: true,
                    label: {
                        show: true,
                        distance: 10,
                        fontWeight: "lighter"
                    },
                    data: [{
                        type: 'max',
                        lineStyle: {
                            normal: {
                                type: "solid",
                                width: 1,
                                color: '#CCFF66'
                            }
                        }
                    }, {
                        type: 'average',
                        lineStyle: {
                            normal: {
                                type: "solid",
                                width: 1,
                                color: '#CCFF66'
                            }
                        }
                    }, {
                        type: 'min',
                        lineStyle: {
                            normal: {
                                type: "solid",
                                width: 1,
                                color: '#CCFF66'
                            }
                        }
                    }]
                },
            }, {
                id: 'vline',
                z: 2,
                data: seriesData,
                type: 'line',
                // 隐藏series
                symbolSize: 0,
                showSymbol: false,
                lineStyle: {
                    width: 0,
                    color: 'rgba(0, 0, 0, 0)'
                }
            }]
        };
接下来,将值传过去,刻度线markline就生成啦~~
    //data是传入的值~
    var myChart = echarts.getInstanceByDom($('#' + id)[0]);
    if (!myChart) return false;
	myChart.setOption({
	       series: [
			{
				id:'serie0',
				data:data
			}
		  ]
	    });
		myChart.resize();
完毕!