ggplot2绘图颜色
文章目录
-
- 摘要
- 前言
- 离散变量
-
- 默认定义scale_fill_discrete()
- 色环系统 scale_fill_hue()
- 灰度系统scale_fill_grey()
- 调色板scale_fill_brewer()
- 连续变量
-
- 默认scale_fill_continous
- 梯度scale_fill_gradient
- 色板scale_fill_distiller/fermenter
- 其它
-
- 色盲色板
- 完全自定义
摘要
推荐使用colorspace包,或者ggsci包中的色板进行配色。
- scale_(fill/color)(continous/discrete/binned)(sequential/diverging/qualitative/divergingx)
前言
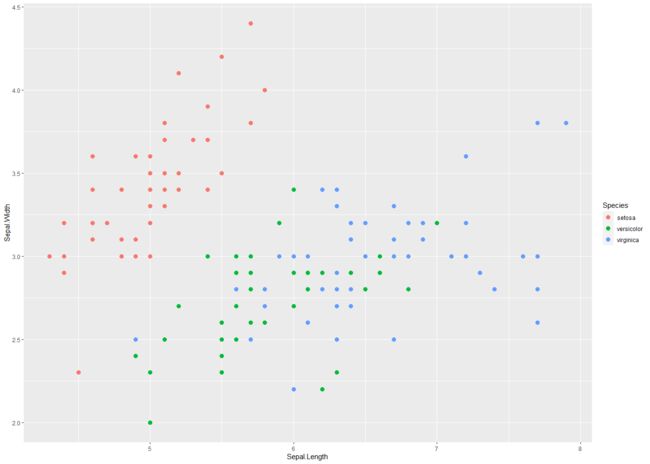
ggplot图形绘制中经常用到颜色映射aes,常见的有aes(color=var)或者aes(fill=var)进行边框或者填充色的绘制。比如:
library(tidyverse)

iris %>% ggplot()+
  geom_point(aes(Sepal.Length,Sepal.Width,color=Species),size=3)
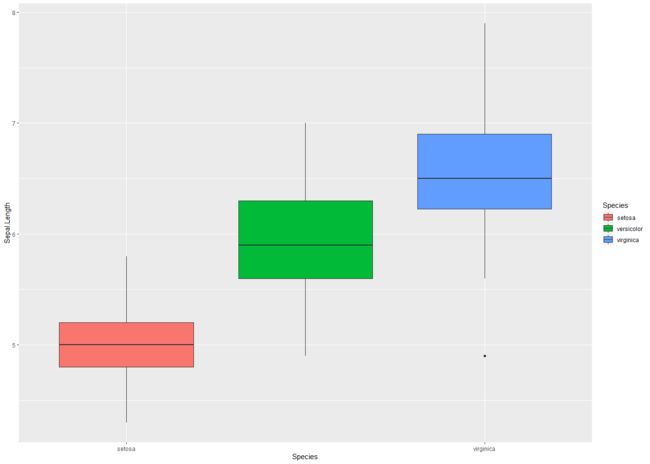
上图用到了color边框线的映射,有时候也会用到fill填充色映射,比如:
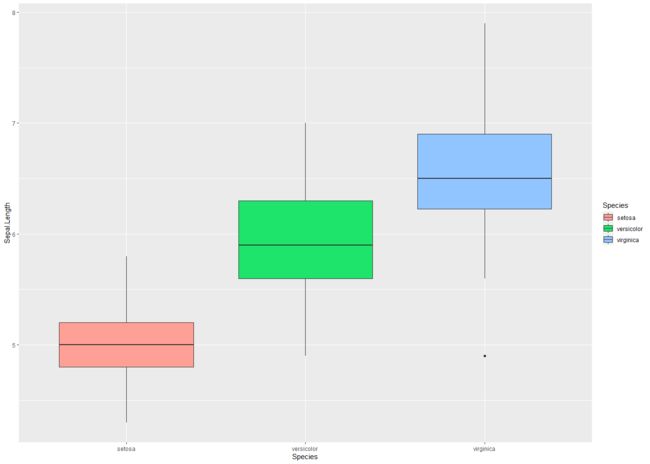
p=iris %>% ggplot(aes(x=Species,y=Sepal.Length))+
  geom_boxplot(aes(fill=Species))
p
但是此处的颜色类型均为系统默认,没有自定义形式,而ggplot图形系统中,则可以利用scale_fill_xxx形式对颜色梯度进行自定义。下文中color与fill实际是一致的。
离散变量
默认定义scale_fill_discrete()
如果希望改变次序,则要调用scale_x_discrete中的limits参数。
# 柱子数量不变,排序不变,legend不变
p+scale_x_discrete(breaks=c("virginica","setosa"))
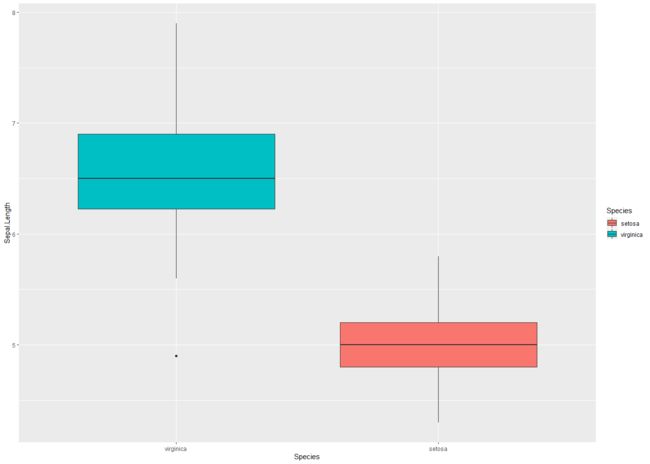
# 柱子数量改变,排序改变,legend改变
p+scale_x_discrete(limits=c("virginica","setosa"))
## Warning: Removed 50 rows containing missing values (stat_boxplot).
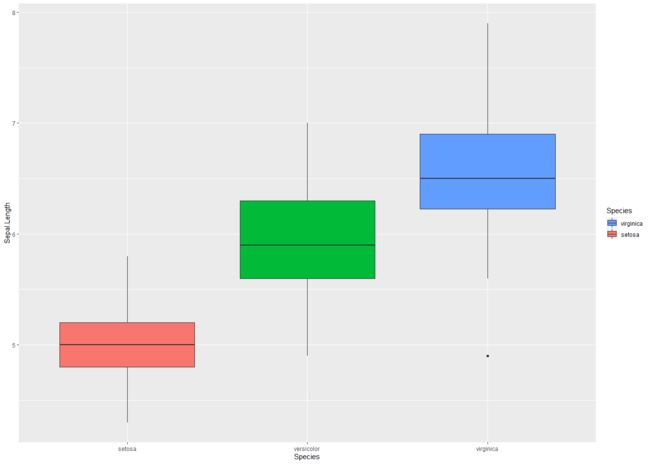
#图形不变,legend处排序变化,颜色不变
p+scale_fill_discrete(breaks=c("virginica","setosa"))
#图形不变,legend处排序变化,颜色发生变化
p+scale_fill_discrete(limits=c("virginica","setosa"))
色环系统 scale_fill_hue()
默认情况下,离散比例的颜色围绕HSL色环均匀分布。例如,如果有两种颜色,那么它们将从圆圈上的相对点中选择;如果有三种颜色,它们在色环上将相隔 120° 等等。
默认颜色选择使用 scale_fill_hue() 和 scale_colour_hue(),hue颜色系统有修改:
- h 色相,实际是色环角度0-360
- c 饱和度,0-100
- l 亮度,0-100
例如:
p+scale_fill_hue(h=c(120,360))
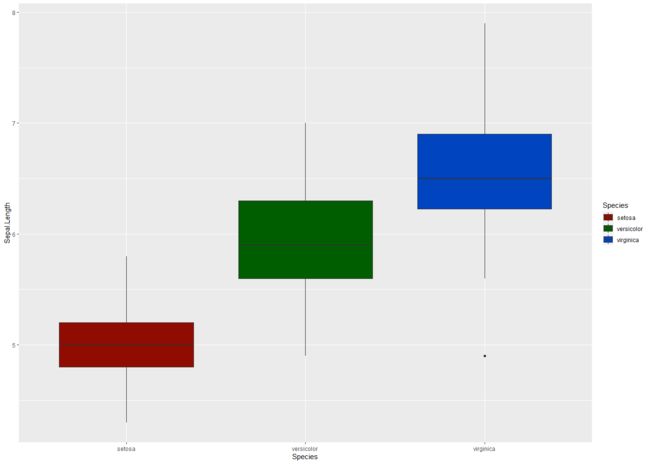
p+scale_fill_hue(l=80)#设置亮度(l默认45)
p+scale_fill_hue(l=30)#设置亮度(l默认45)
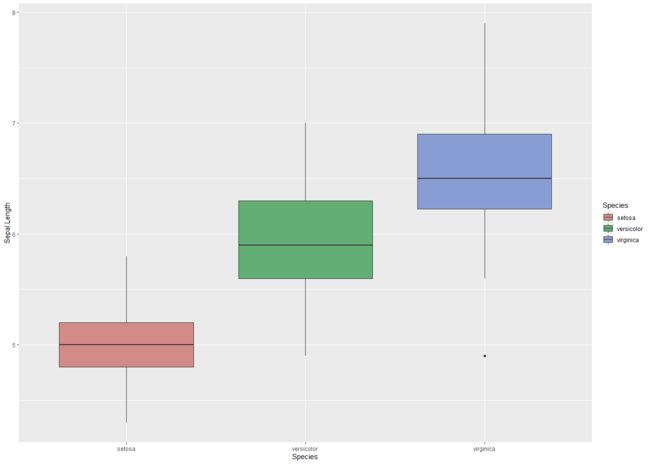
p+scale_fill_hue(c=50)#设置饱和度(c默认100)
p+scale_fill_hue(c=100)#设置饱和度(c默认100)
灰度系统scale_fill_grey()
p+scale_fill_grey(start=0.2,end=0.8)
调色板scale_fill_brewer()
RColorBrewer包中有多个色板可供选择:
RColorBrewer::display.brewer.all()
RColorBrewer中有3套色板,type参数,分别为:
- Sequential(seq): 用于表示数值梯度,用于呈现有序的数值信息,数值越高颜色越深,越低颜色越浅。
- qualitative(qual):用于呈现分类信息,颜色之间一般对比鲜明。
- diverging(div): 分歧,用于呈现有序/连续的数值信息,这些数值围绕着一个中心值,比中心值越大的方向用一种渐变色,比中心值越小用另一种渐变色。
对于离散变量映射,则有:
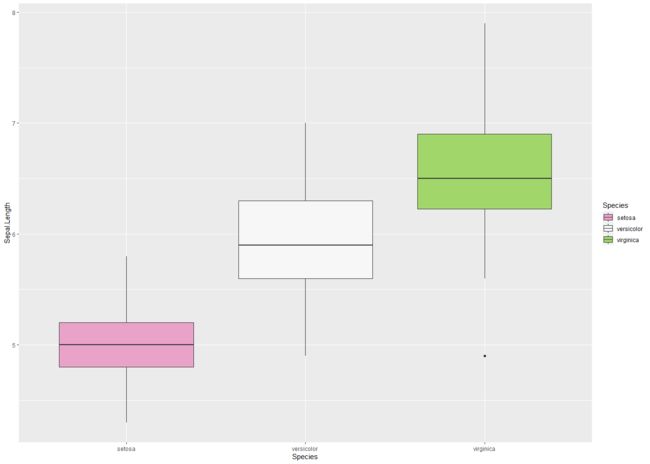
p+scale_fill_brewer(type="seq",palette = 2)
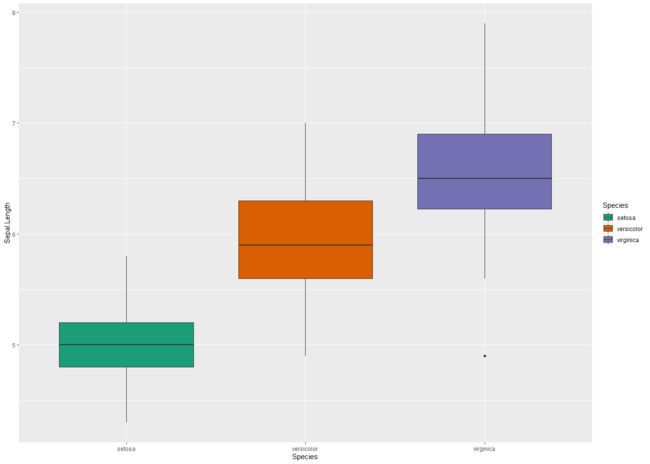
p+scale_fill_brewer(type="qual",palette = 2)
p+scale_fill_brewer(type="div",palette = 2)
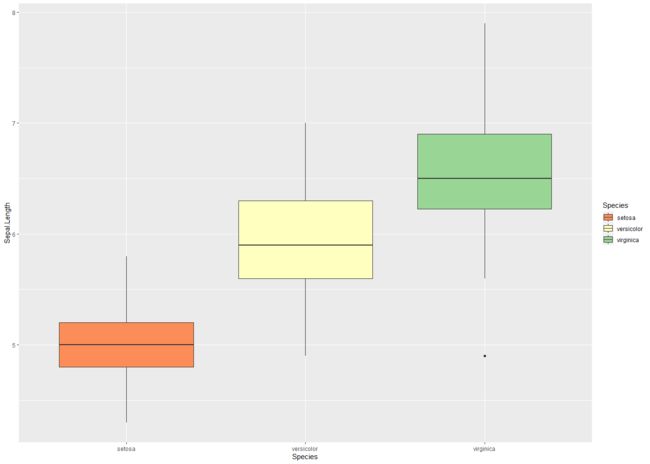
或者直接指定色板名称palette=??
p+scale_fill_brewer(palette="Spectral")
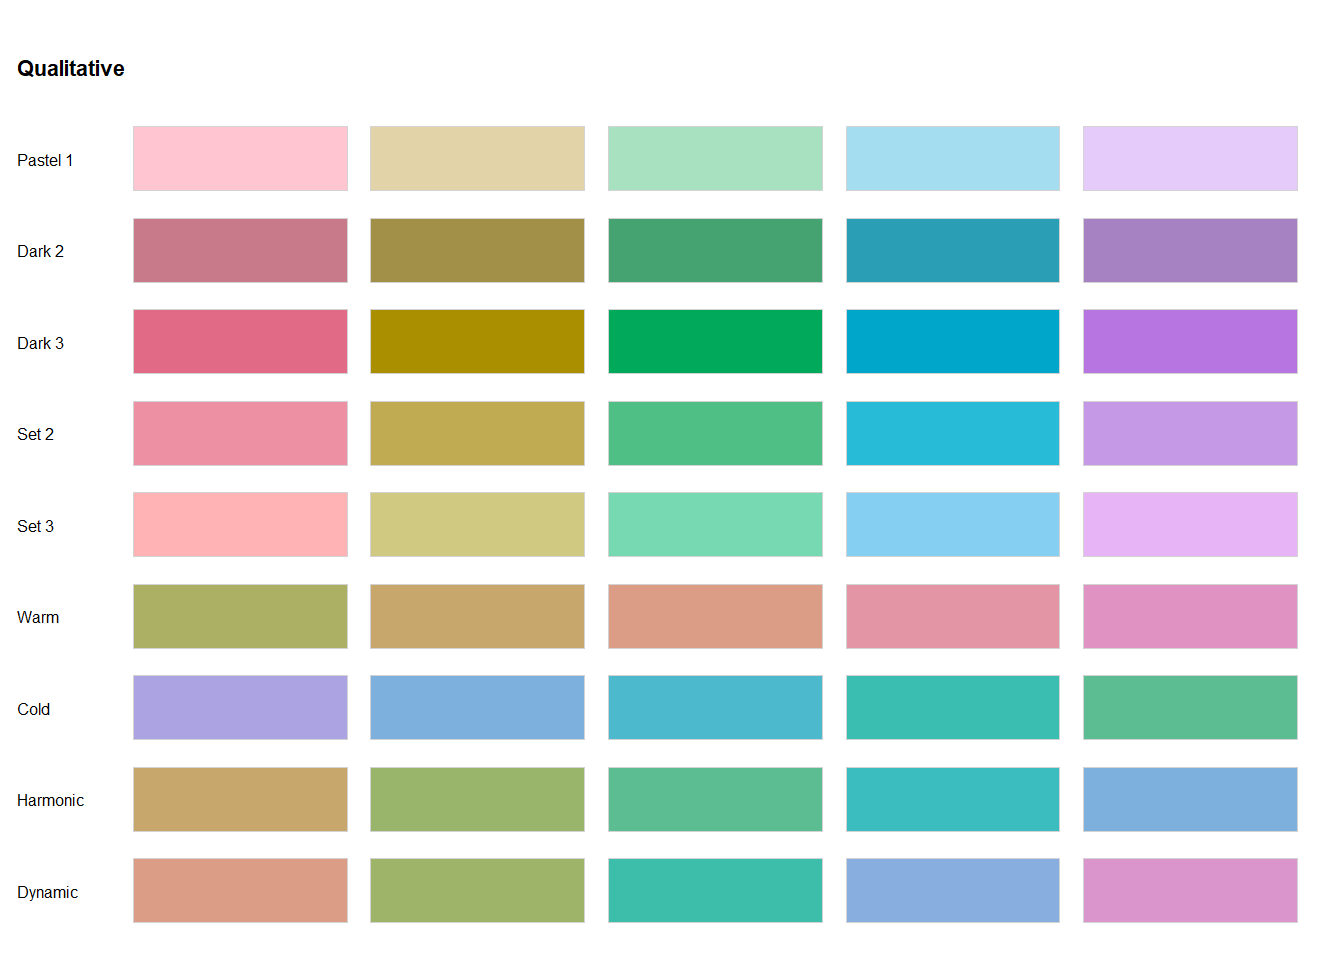
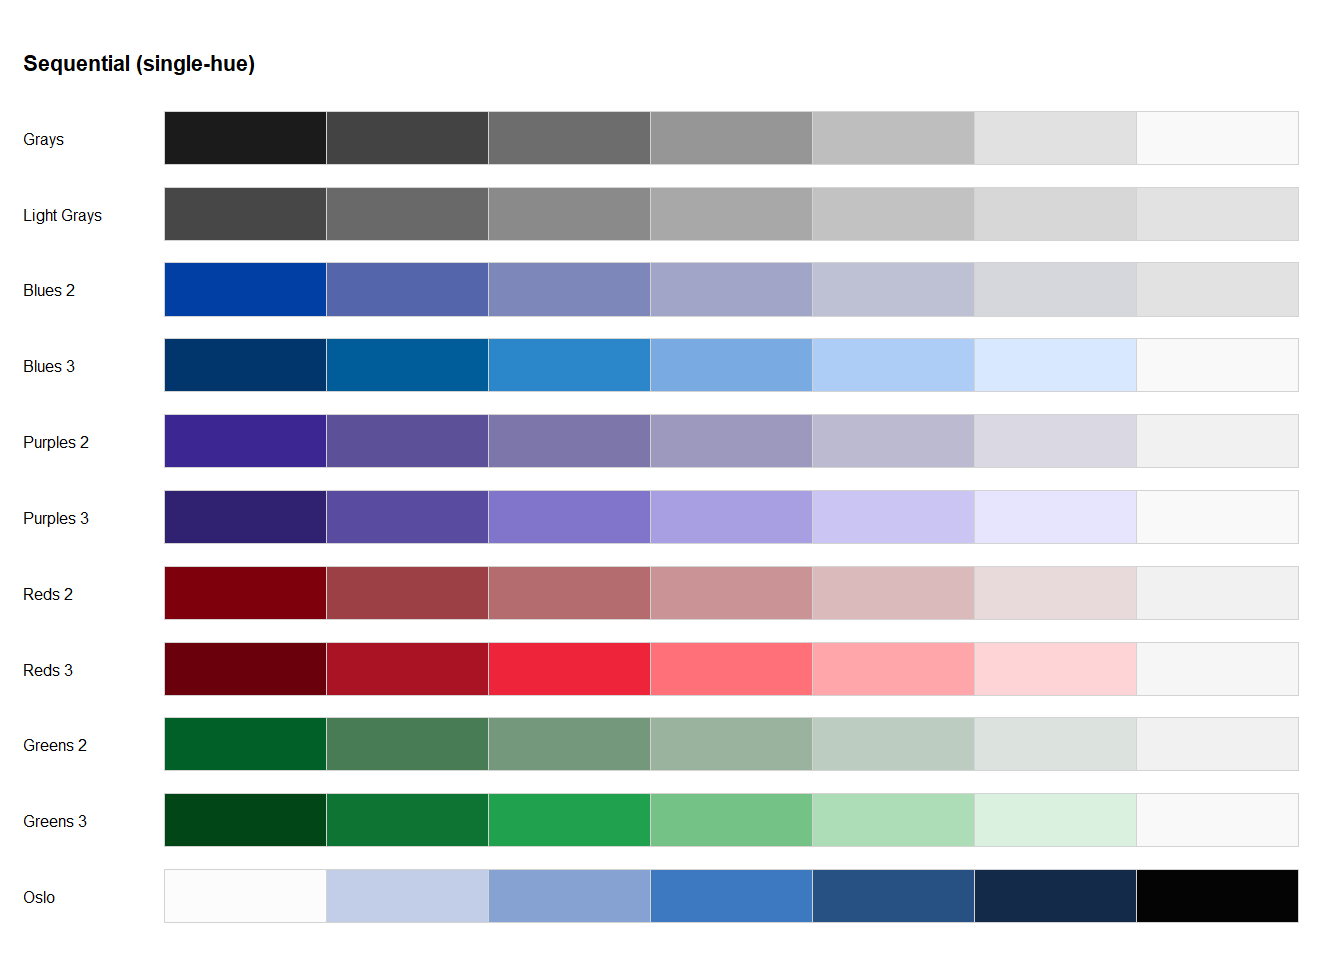
上述颜色也可以在colorspace包中获取。
library(colorspace)
## Warning: package 'colorspace' was built under R version 4.1.1
hcl_palettes(plot = TRUE)
hcl_palettes("qualitative", plot = TRUE)
hcl_palettes("sequential (single-hue)", n = 7, plot = TRUE)
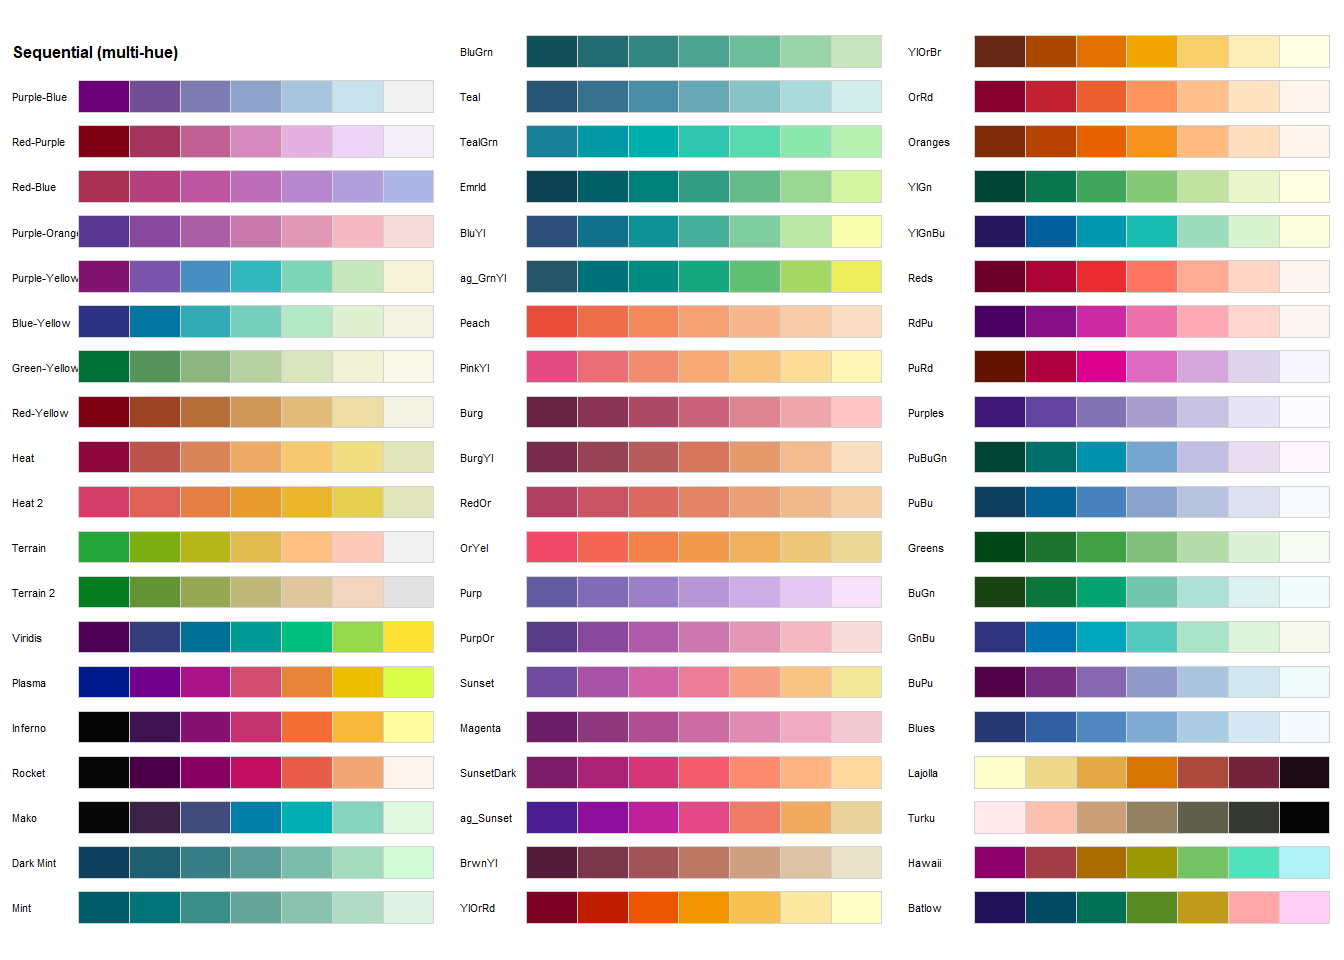
hcl_palettes("sequential (multi-hue)", n = 7, plot = TRUE)
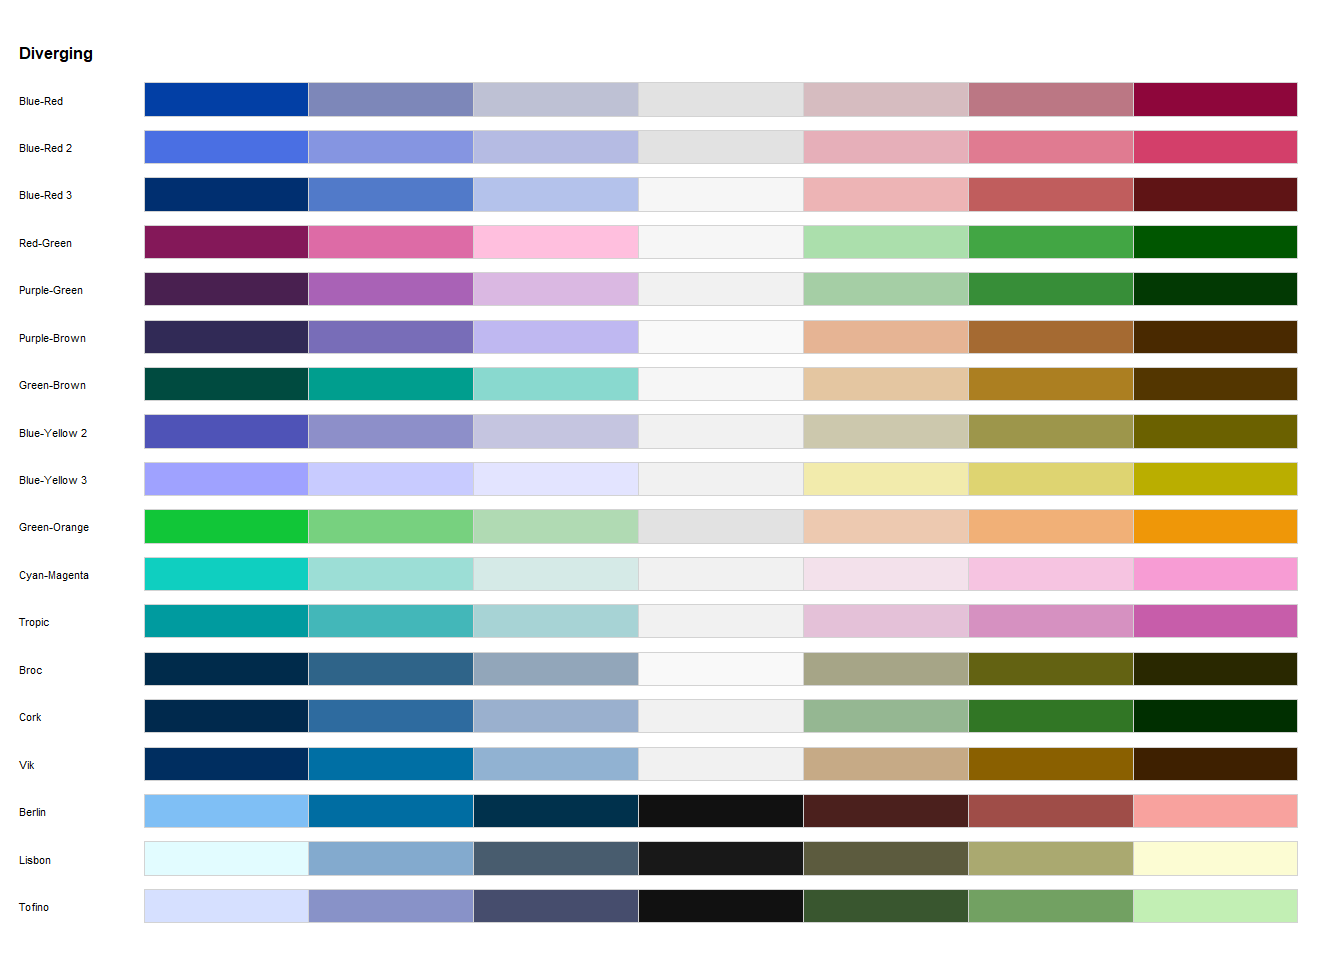
hcl_palettes("diverging", n = 7, plot = TRUE)
divergingx_palettes(plot = TRUE)
如果需要具体颜色值,则通过:
#colorspace::diverging_hcl(n = 7, "Dark 2")
#colorspace::qualitative_hcl(4, palette = "myset")
colorspace::sequential_hcl(n = 7, palette = "Peach")
## [1] "#EA4C3B" "#EF6D48" "#F3885B" "#F6A173" "#F8B78E" "#F9CCA9" "#FADDC3"
在ggplot2图形系统,则可以直接调用colorspace中的色板:
- scale_color_discrete_qualitative()
- scale_fill_continuous_sequential()
- scale_colour_continous_divergingx()
例如:
p+scale_fill_discrete_qualitative(palette="Set2",nmax=6,rev=T,order=4:6)
连续变量
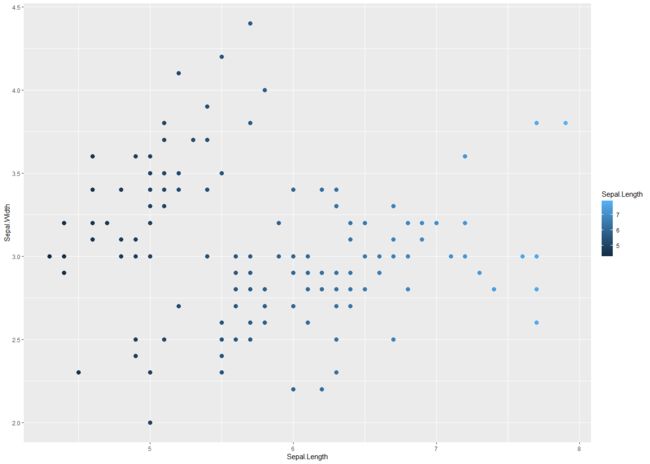
p1=iris %>% ggplot(aes(x=Sepal.Length,y=Sepal.Width))+
  geom_point(aes(color=Sepal.Length),size=3)
p1
默认scale_fill_continous
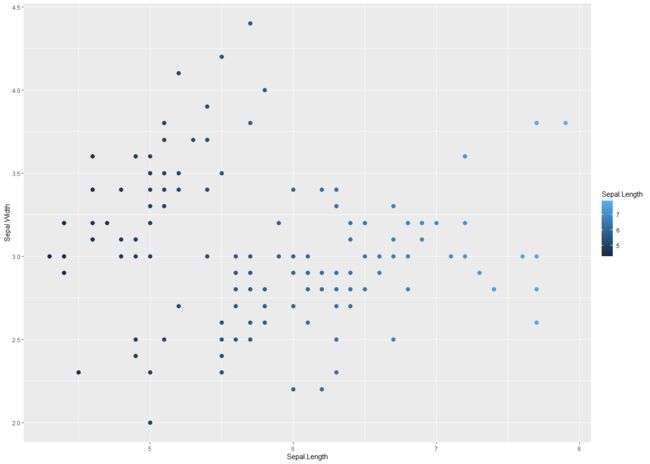
p1+scale_color_continuous(type="gradient")
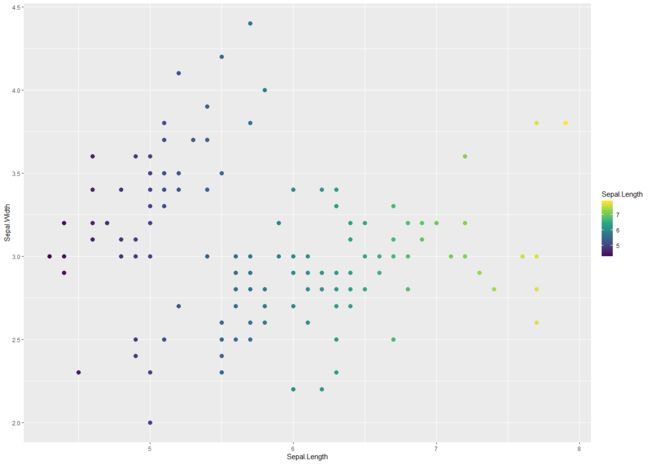
p1+scale_color_continuous(type="viridis")
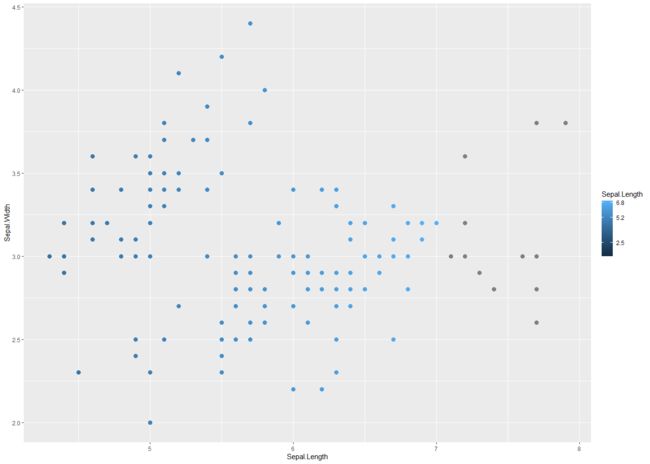
p1+scale_color_continuous(breaks=c(2.5,5.2,6.8),limits=c(1,7))
上图中limits规定了映射范围,breaks参数规定了断点值。
梯度scale_fill_gradient
- scale_fill_gradient
- scale_fill_gradient2
- scale_fill_gradientn
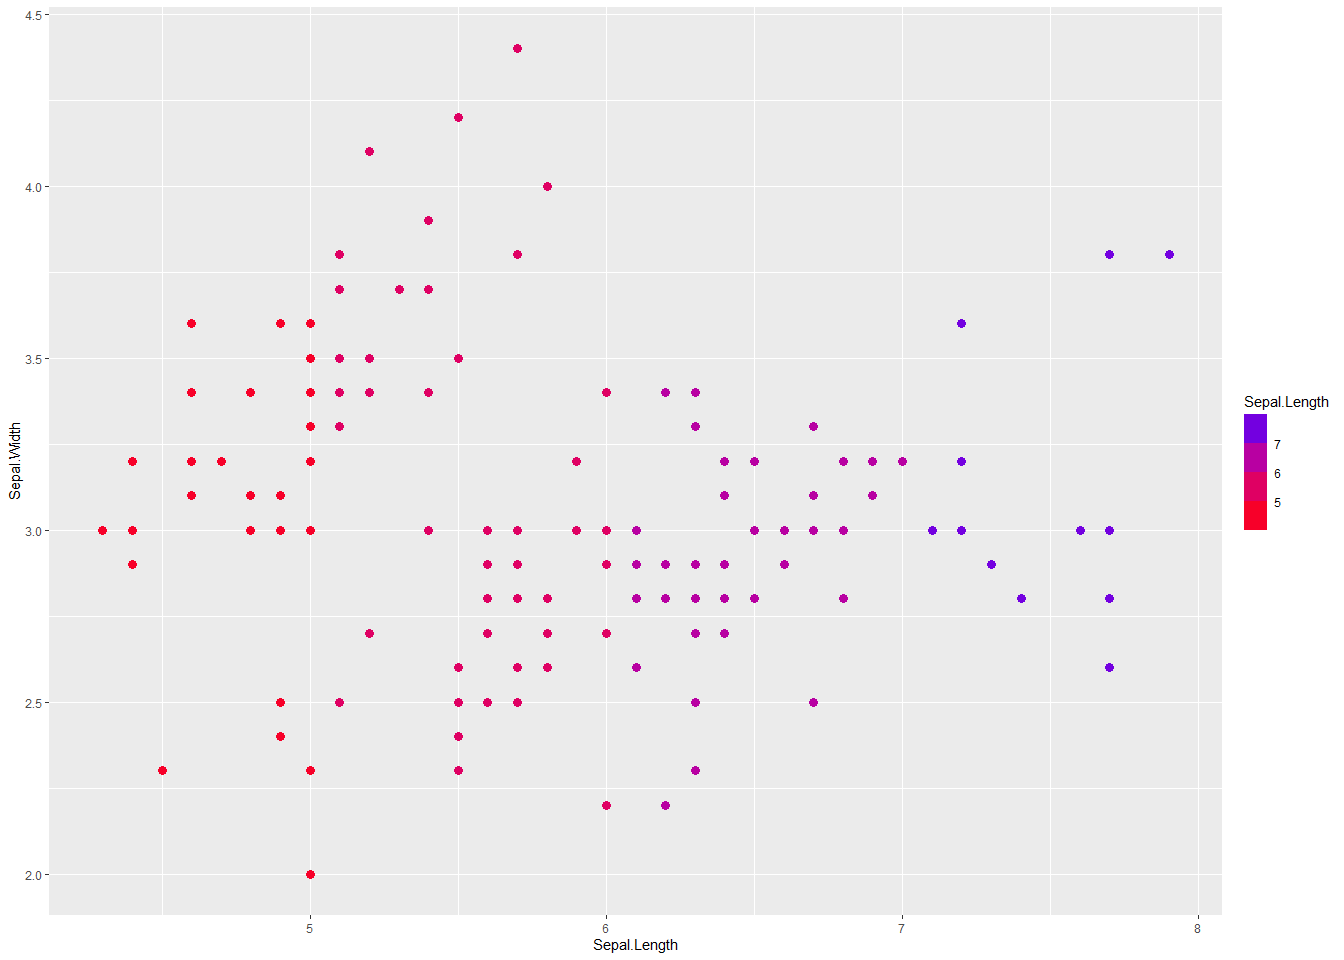
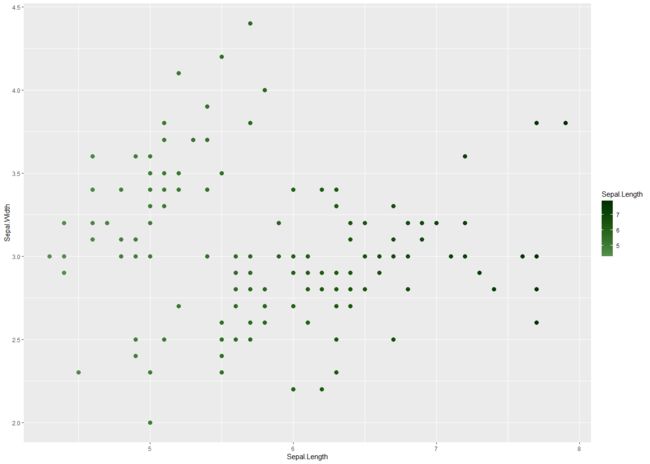
p1+scale_color_gradient(low="red",high="blue")
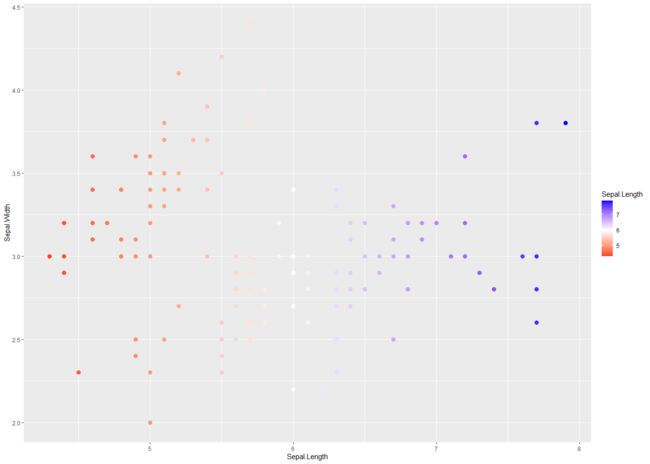
p1+scale_color_gradient2(low="red",mid="white",high="blue",midpoint = 6)
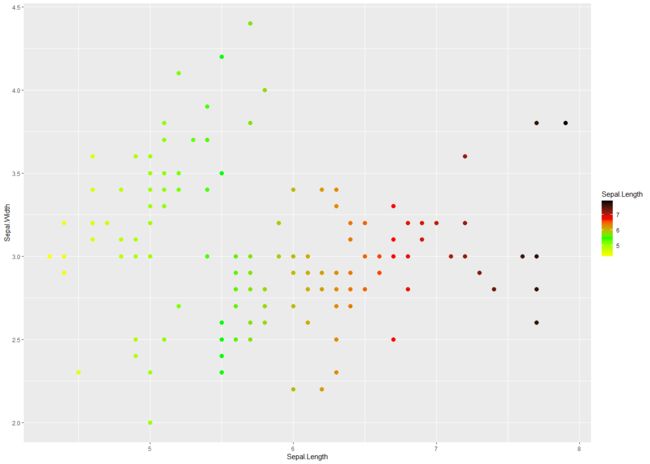
p1+scale_color_gradientn(colors=c("yellow","green","red","black"))
色板scale_fill_distiller/fermenter
- scale_fill_distiller() 色块连续过度
- scale_fill_steps/scale_fill_binned()/scale_fill_fermenter() 色块离散过度
其中distiller把brewer离散色板中均匀插值7个色块形成过渡色,而fermenter则是把brewer色板的颜色离散化。
p1+scale_color_distiller(palette = "Spectral")
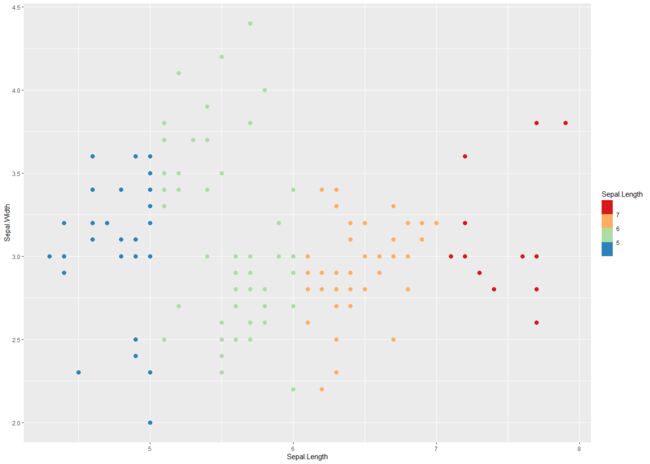
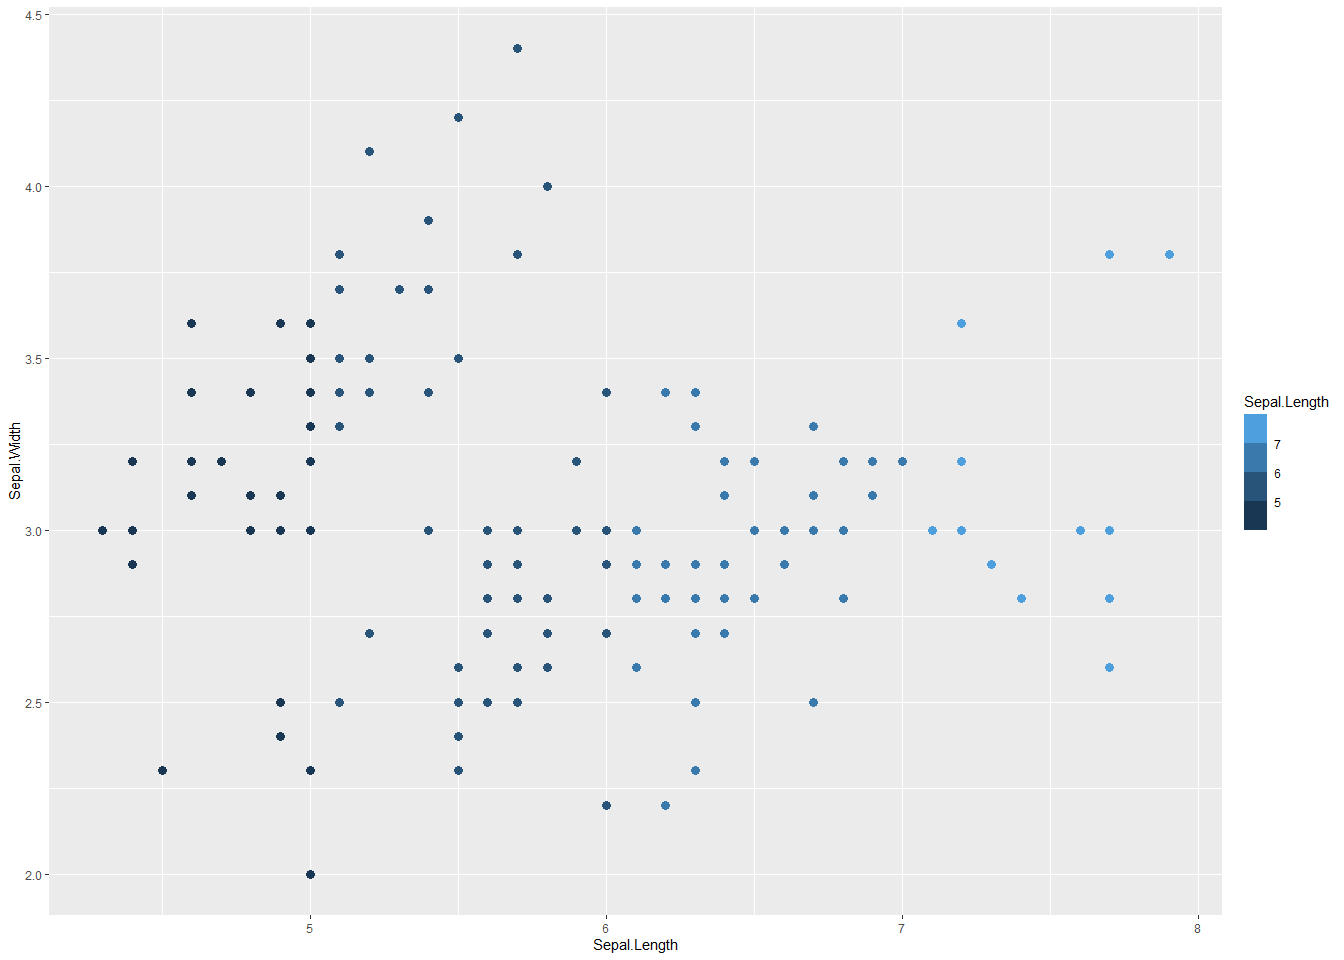
p1+scale_color_fermenter(palette = "Spectral")
p1+scale_color_steps(low="red",high="blue")
p1+scale_color_binned()
对steps还有:
p1+scale_fill_steps(low = "#002B43", high = "#99B1F7")
p1+scale_fill_steps2(low = "red", mid = "white",high = "blue")
p1+scale_fill_stepsn(colors=c(ggsci::pal_aaas()(5)))
对应colorspace包,则有scale_fill_continous_???:
- scale_colour_continuous_sequential
- scale_colour_continuous_qualitative
- scale_colour_continuous_diverging
- scale_colour_continuous_divergingx
p1+scale_color_continuous_diverging(palette = "Cork")
p1+scale_color_continuous_divergingx(palette = "Geyser")
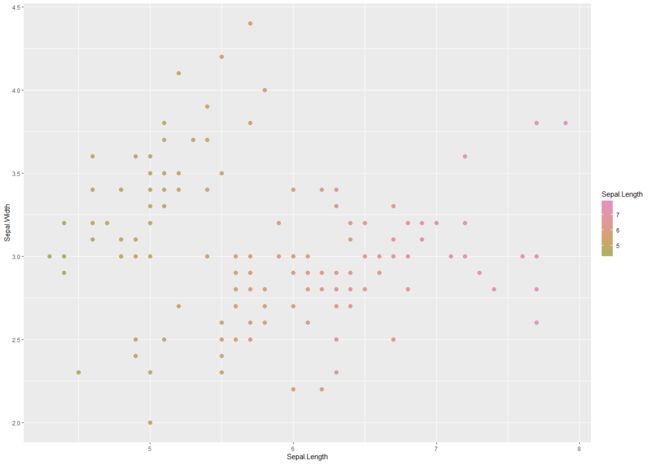
p1+scale_color_continuous_qualitative(palette = "Warm")
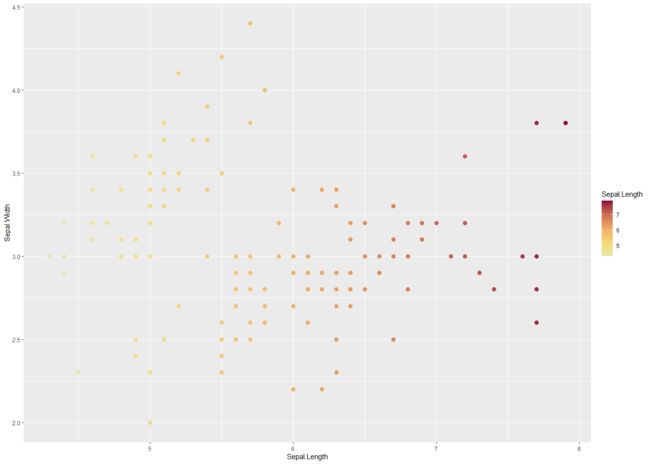
p1+scale_color_continuous_sequential(palette = "Heat")
p1+scale_color_binned_qualitative(palette = "Warm")
其它
色盲色板
p1+scale_color_viridis_c()
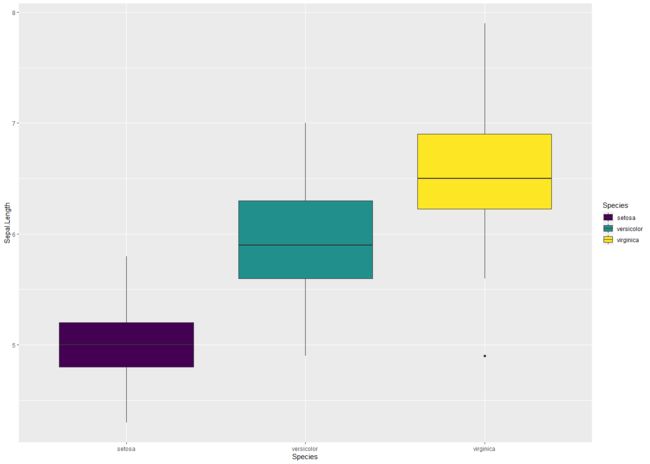
p+scale_fill_viridis_d()
p1+scale_color_viridis_b()
完全自定义
自定义主要对应离散映射:
aa=unique(iris$Species)
p+scale_fill_manual(breaks = c(aa[2],aa[1],aa[3]),
     values = c("darkorange", "purple", "cyan4"))
