极致呈现系列之:Echarts旭日图的绚丽奇观
目录
- 什么是旭日图
- 旭日图的特性及应用场景
-
- 旭日图的特性
- 应用场景
- 旭日图常用的配置项
- 创建基本的旭日图
- 自定义旭日图样式样式
- 旭日图的高级应用
什么是旭日图
旭日图是一种可视化图表,用于展示层级结构和层级之间的关系。它以一个圆形为基础,由多层的环形图组成,在数据结构上,内圈是外圈的父节点。因此,它既能像饼图一样表现局部和整体的占比,又能像矩形树图一样表现层级关系。
旭日图的特性及应用场景
旭日图的特性
- 层次结构:旭日图可以直观地展示数据的层级和关系。
- 扇区表示数据:每个扇区根据数据大小分布,可以形成层次结构明显且有趣的图形。
- 视觉效果:通过颜色和大小的变化,旭日图能够凸显数据的差异和重要性。
应用场景
- 组织结构图:可以用来展示公司的组织结构,让员工更好地了解公司的层级关系。
- 地理信息图:可以用来展示不同地区的人口分布情况,通过扇形区域的大小和颜色来反映不同地区的人口数量和密度。
- 产品分析图:可以用来展示产品的销售情况和市场份额,通过扇形区域的大小和颜色来反映不同产品的销售额和市场占比。
旭日图常用的配置项
-
type:该属性指定了图表的类型,对于旭日图,它的值应为"sunburst"。
-
data:数据源,包含具体的层级数据。通过data属性可以设置图表的数据。数据是一个包含层级关系的数组,每个元素代表一个节点。每个节点可以包含子节点,从而形成层级结构。每一层级都是一个对象,包含name(名称)和value(数值)属性。可以通过嵌套的方式表示多层级关系。子对象用children数组包裹。
data数据结构如下:
	[{
    name: 'parent1',
    value: 10,          // 可以不写父元素的 value,则为子元素之和;
                        // 如果写了,并且大于子元素之和,可以用来表示还有其他子元素未显示
    children: [{
        value: 5,
        name: 'child1',
        children: [{
            value: 2,
            name: 'grandchild1',
            itemStyle: {
                // 每个数据可以有自己的样式,覆盖 series.itemStyle 和 level.itemStyle
            },
            label: {
                // 标签样式,同上
            }
        }]
    }, {
        value: 3,
        name: 'child2'
    }],
    itemStyle: {
        // parent1 的图形样式,不会被后代继承
    },
    label: {
        // parent1 的标签样式,不会被后代继承
    }
}, {
    name: 'parent2',
    value: 4
}]
- radius:radius属性用于设置旭日图的半径范围。可以通过数组的方式设置内半径和外半径,或者使用百分比或数字的方式设置。
- label:通过label属性可以配置节点标签的样式。可以设置color(字体颜色)、fontSize(字体大小)、fontWeight(字体粗细)、position(位置)、rotate(旋转角度)等属性。
- itemStyle:itemStyle属性用于设置节点的样式,包括节点的color(颜色)、borderColor(边框颜色)、borderWidth(边框宽度)等。
- levels:层级配置,该属性用于设置图表的层级结构。通过levels属性,可以设置不同层级的样式,包括颜色、标签样式、边框样式等。每个层级都是一个对象,包含itemStyle(节点样式)、label(标签配置)等属性。
- sort:sort属性用于设置节点的排序规则。可以选择"asc"(升序)或"desc"(降序)。
- animation:是否开启动画
- animationDuration:初始动画的时长,支持回调函数,可以通过每个数据返回不同的时长实现更戏剧的初始动画效果
- animationEasing:初始动画的缓动效果。
创建基本的旭日图
- 创建vue项目,安装ECharts库
npm install echarts --save
- 新建SunburstView.vue文件,使用
import语句引入ECharts库
import * as echarts from 'echarts';
- 创建图表容器:在SunburstView组件的
template中,添加一个div元素作为图表的容器。给它一个唯一的ref属性,以便在后面初始化图表对象时使用
- 初始化图表对象:在SunburstView组件中定义chart,
const chart = ref(null)
在mounted生命周期钩子函数中,使用echarts.init方法初始化图表对象。
- 配置图表参数,在SunburstView组件的
mounted生命周期钩子函数中,定义option对象,在里面配置图表数据,并使用chart.setOption方法配置图表的参数。
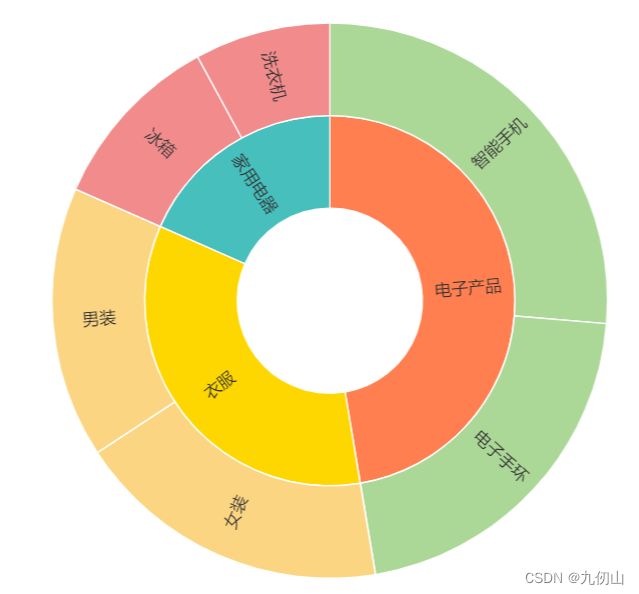
onMounted(() => {
  const myChart = echarts.init(chart.value)
  const option = {
   series: [
        {
          type: 'sunburst',
          data: [
            {
              name: '电子产品',
              children: [
                { name: '智能手机', value: 100 },
                { name: '电子手环', value: 80 },
              ],
            },
            {
              name: '衣服',
              children: [
                { name: '男装', value: 60 },
                { name: '女装', value: 70 },
              ],
            },
            {
              name: '家用电器',
              children: [
                { name: '冰箱', value: 40 },
                { name: '洗衣机', value: 30 },
              ],
            },
          ],
        },
      ],
  }
  myChart.setOption(option)
})
自定义旭日图样式样式
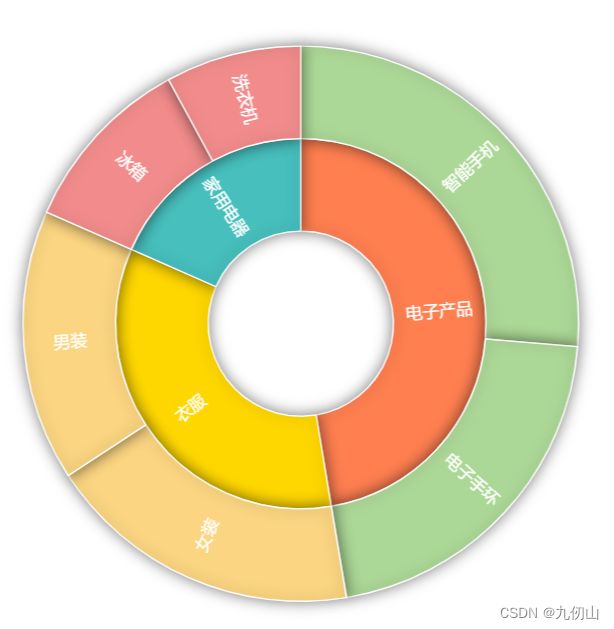
- 通过设置data中的itemStyle属性设置每个主要类别的颜色,每个children也可以设置itemStyle属性
 data: [
            {
              name: '电子产品',
              itemStyle: {
                color: '#FF7F50',
              },
              children: [
                { name: '智能手机', value: 100 },
                { name: '电子手环', value: 80 },
              ],
            },
            {
              name: '衣服',
              itemStyle: {
                color: '#FFD700',
              },
              children: [
                { name: '男装', value: 60 },
                { name: '女装', value: 70 },
              ],
            },
            {
              name: '家用电器',
              itemStyle: {
                color: '#46BFBD',
              },
              children: [
                { name: '冰箱', value: 40 },
                { name: '洗衣机', value: 30 },
              ],
            },
 ],
- 通过radius调整旭日图内外圆的半径
radius: ['20%', '60%'],
label: {
          show: true,
          color: 'white',
          fontSize: 12,
        },
- 通过emphasis设置鼠标悬停时的高亮效果
emphasis: {
          label: {
            show: true,
            fontSize: 16,
            fontWeight: 'bold',
          },
 },

5. 通过series的itemStyle设置旭日图的边框、阴影的样式,使其看起来更加立体
itemStyle: {
          borderWidth: 1,
          borderColor: 'white',
          shadowBlur: 10,
          shadowColor: 'rgba(0, 0, 0, 0.5)',
 },
旭日图的高级应用
- 层级分析:旭日图可以用于层级结构的可视化,例如组织结构、产品分类等。通过不同的圆环表示不同的层级,展示层级之间的关系和分布情况。上面我们展示的代码就是一个产品分类的层级分析,展示了家用电器、电子产品和衣服的占比情况,通过鼠标点击节点(如衣服),可以下钻到衣服节点进行展示,效果如下:
- 时间序列分析:如果每个圆环代表一个时间段,旭日图可以展示随时间变化的数据分布情况。可以将相邻时间段的区块连接起来,形成一个动态的旭日图,以便更清晰地观察数据的时序特征。
series: {
      type: 'sunburst',
      radius: ['20%', '60%'],
      data: [
        {
          name: '2020',
          value: 100,
        },
        {
          name: '2021',
          value: 200,
        },
        {
          name: '2022',
          value: 150,
        }
      ],
      links: [
        { source: '2020', target: '2021' },
        { source: '2021', target: '2022' }
      ],
     itemStyle: {
	      borderWidth: 1,
	      borderColor: 'white',
	      shadowBlur: 10,
	      shadowColor: 'rgba(0, 0, 0, 0.5)',
    	},
    },

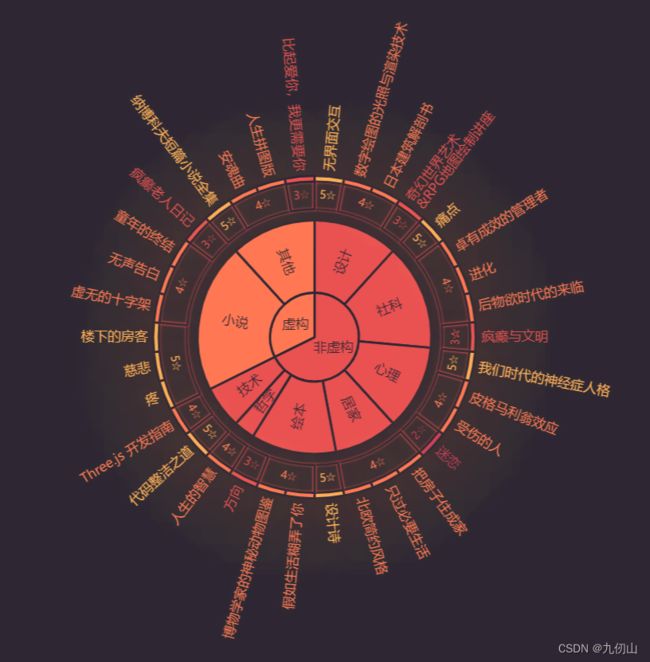
3. 多维数据可视化:旭日图可以支持多个维度的数据展示,尤其适用于展示层级结构和多层次的数据关系。可以通过嵌套不同层级的圆环来表示不同维度,从而更好地理解数据之间的复杂关系。
onMounted(() => {
  const myChart = echarts.init(chart.value)
  const colors = ['#FFAE57', '#FF7853', '#EA5151', '#CC3F57', '#9A2555'];
  const bgColor = '#2E2733';
  const itemStyle = {
    star5: {
      color: colors[0]
    },
    star4: {
      color: colors[1]
    },
    star3: {
      color: colors[2]
    },
    star2: {
      color: colors[3]
    }
  };
  const data = [{
    name: '虚构',
    itemStyle: {
      color: colors[1]
    },
    children: [{
      name: '小说',
      children: [{
        name: '5☆',
        children: [{
          name: '疼'
        }, {
          name: '慈悲'
        }, {
          name: '楼下的房客'
        }]
      }, {
        name: '4☆',
        children: [{
          name: '虚无的十字架'
        }, {
          name: '无声告白'
        }, {
          name: '童年的终结'
        }]
      }, {
        name: '3☆',
        children: [{
          name: '疯癫老人日记'
        }]
      }]
    }, {
      name: '其他',
      children: [{
        name: '5☆',
        children: [{
          name: '纳博科夫短篇小说全集'
        }]
      }, {
        name: '4☆',
        children: [{
          name: '安魂曲'
        }, {
          name: '人生拼图版'
        }]
      }, {
        name: '3☆',
        children: [{
          name: '比起爱你,我更需要你'
        }]
      }]
    }]
  }, {
    name: '非虚构',
    itemStyle: {
      color: colors[2]
    },
    children: [{
      name: '设计',
      children: [{
        name: '5☆',
        children: [{
          name: '无界面交互'
        }]
      }, {
        name: '4☆',
        children: [{
          name: '数字绘图的光照与渲染技术'
        }, {
          name: '日本建筑解剖书'
        }]
      }, {
        name: '3☆',
        children: [{
          name: '奇幻世界艺术\n&RPG地图绘制讲座'
        }]
      }]
    }, {
      name: '社科',
      children: [{
        name: '5☆',
        children: [{
          name: '痛点'
        }]
      }, {
        name: '4☆',
        children: [{
          name: '卓有成效的管理者'
        }, {
          name: '进化'
        }, {
          name: '后物欲时代的来临'
        }]
      }, {
        name: '3☆',
        children: [{
          name: '疯癫与文明'
        }]
      }]
    }, {
      name: '心理',
      children: [{
        name: '5☆',
        children: [{
          name: '我们时代的神经症人格'
        }]
      }, {
        name: '4☆',
        children: [{
          name: '皮格马利翁效应'
        }, {
          name: '受伤的人'
        }]
      }, {
        name: '3☆'
      }, {
        name: '2☆',
        children: [{
          name: '迷恋'
        }]
      }]
    }, {
      name: '居家',
      children: [{
        name: '4☆',
        children: [{
          name: '把房子住成家'
        }, {
          name: '只过必要生活'
        }, {
          name: '北欧简约风格'
        }]
      }]
    }, {
      name: '绘本',
      children: [{
        name: '5☆',
        children: [{
          name: '设计诗'
        }]
      }, {
        name: '4☆',
        children: [{
          name: '假如生活糊弄了你'
        }, {
          name: '博物学家的神秘动物图鉴'
        }]
      }, {
        name: '3☆',
        children: [{
          name: '方向'
        }]
      }]
    }, {
      name: '哲学',
      children: [{
        name: '4☆',
        children: [{
          name: '人生的智慧'
        }]
      }]
    }, {
      name: '技术',
      children: [{
        name: '5☆',
        children: [{
          name: '代码整洁之道'
        }]
      }, {
        name: '4☆',
        children: [{
          name: 'Three.js 开发指南'
        }]
      }]
    }]
  }];
  for (let j = 0; j < data.length; ++j) {
    let level1 = data[j].children;
    for (let i = 0; i < level1.length; ++i) {
      let block = level1[i].children;
      let bookScore = [];
      let bookScoreId;
      for (let star = 0; star < block.length; ++star) {
        let style = (function (name) {
          switch (name) {
            case '5☆':
              bookScoreId = 0;
              return itemStyle.star5;
            case '4☆':
              bookScoreId = 1;
              return itemStyle.star4;
            case '3☆':
              bookScoreId = 2;
              return itemStyle.star3;
            case '2☆':
              bookScoreId = 3;
              return itemStyle.star2;
          }
        })(block[star].name);

        block[star].label = {
          color: style.color,
          downplay: {
            opacity: 0.5
          }
        };

        if (block[star].children) {
          style = {
            opacity: 1,
            color: style.color
          };
          block[star].children.forEach(function (book) {
            book.value = 1;
            book.itemStyle = style;
            book.label = {
              color: style.color
            };
            var value = 1;
            if (bookScoreId === 0 || bookScoreId === 3) {
              value = 5;
            }
            if (bookScore[bookScoreId]) {
              bookScore[bookScoreId].value += value;
            }
            else {
              bookScore[bookScoreId] = {
                color: colors[bookScoreId],
                value: value
              };
            }
          });
        }
      }

      level1[i].itemStyle = {
        color: data[j].itemStyle.color
      };
    }
  }
  const option = {
    // 多维数据分析
    backgroundColor: bgColor,
    color: colors,
    series: [{
      type: 'sunburst',
      center: ['50%', '48%'],
      data: data,
      sort: function (a, b) {
        if (a.depth === 1) {
          return b.getValue() - a.getValue();
        }
        else {
          return a.dataIndex - b.dataIndex;
        }
      },
      label: {
        rotate: 'radial',
        color: bgColor
      },
      itemStyle: {
        borderColor: bgColor,
        borderWidth: 2
      },
      levels: [{}, {
        r0: 0,
        r: 40,
        label: {
          rotate: 0
        }
      }, {
        r0: 40,
        r: 105
      }, {
        r0: 115,
        r: 140,
        itemStyle: {
          shadowBlur: 2,
          shadowColor: colors[2],
          color: 'transparent'
        },
        label: {
          rotate: 'tangential',
          fontSize: 10,
          color: colors[0]
        }
      }, {
        r0: 140,
        r: 145,
        itemStyle: {
          shadowBlur: 80,
          shadowColor: colors[0]
        },
        label: {
          position: 'outside',
          textShadowBlur: 5,
          textShadowColor: '#333'
        },
        downplay: {
          label: {
            opacity: 0.5
          }
        }
      }]
    }]
  }
  myChart.setOption(option)
})

好了,关于旭日图的介绍就到这里吧,里面还有很多有趣的功能,有兴趣的小伙伴可以自行研究,有问题评论区留言,喜欢的小伙伴可以通过微信公众号搜索“九仞山”,关注我,了解更多内容


