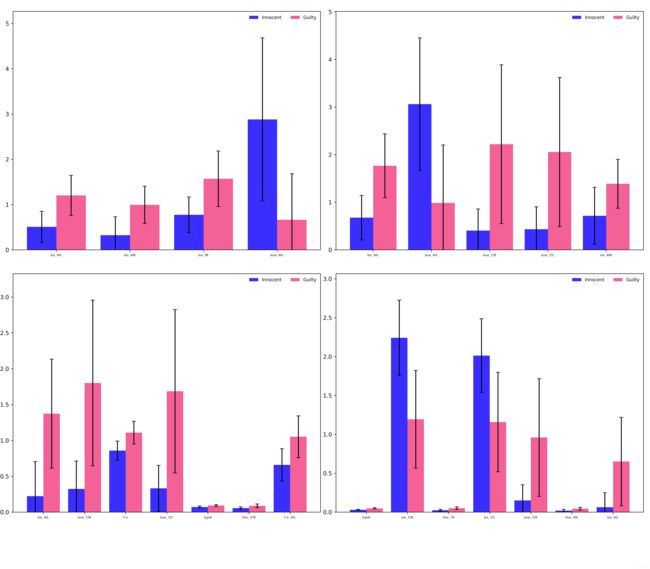
matplotlib-柱状图-bar
#encoding:utf-8
"""
柱状图,bar,参数解析
(plt.barh:水平柱状图,plt.bar:竖直柱状图)
width:柱的宽度
facecolor:柱状图里填充的颜色
edgecolor:边框的颜色,默认不加边框
"""
import matplotlib.pyplot as plt
import numpy as np
import mat4py
from matplotlib.font_manager import FontProperties
font = FontProperties(fname=r"C:\\WINDOWS\\Fonts\\simhei.ttf")
#添加errorbar,
def AddErrorbar(x,mean_s,std_s):
plt.errorbar(x,mean_s, yerr=std_s,linewidth=1.5,fmt=" ",ecolor='k',capsize=3.5)
# 求两组数据均值加方差的最大值,以此来确定与 ylim
def Mean_Add_Std(data_s1_mean,single_para_inn_std,single_para_lie_mean,single_para_lie_std):
max_mean_std_1 = np.max(data_s1_mean) + np.max(single_para_inn_std)
max_mean_std_2 = np.max(single_para_lie_mean) + np.max(single_para_lie_std)
if max_mean_std_1 >= max_mean_std_2:
max_mean_std = max_mean_std_1
else:
max_mean_std = max_mean_std_2
return max_mean_std
def LoadData(single_para_inn_mean, single_para_inn_std,single_para_lie_mean,single_para_lie_std,data_mark_s):#
width = 0.4
mean_size = np.size(single_para_inn_mean)
# 添加bar
x1 = np.arange(mean_size)
plt.bar(x1, single_para_inn_mean,width=width,
color='#3a2efe') #0339f8 #55A868
# plt.show()
x2 = x1 + width
plt.bar(x2, single_para_lie_mean, width=width,facecolor='#f36196', edgecolor='')
xticks_label = ['Cw', 'Lw', 'r']#('δ', 'θ', 'α', 'β') # '$E_{glob}$'
xticks_position=x1+ width/2
plt.xticks(xticks_position, data_mark_s, fontproperties='Times New Roman',
fontsize=6)
plt.yticks(fontsize=10)
# 求两组数据均值加方差的最大值,以此来确定与 ylim
max_mean_std = Mean_Add_Std(single_para_inn_mean, single_para_inn_std, single_para_lie_mean, single_para_lie_std)
plt.ylim(0,max_mean_std+max_mean_std/8)
plt.legend(('Innocent', 'Guilty'), loc='upper right', ncol=2, fontsize=8, frameon=False) # bbox_to_anchor=(1.4,0.0)
#添加errorbar
AddErrorbar(x1, single_para_inn_mean, single_para_inn_std)
AddErrorbar(x2, single_para_lie_mean, single_para_lie_std)
#主函数
if __name__== '__main__':
# 数据文件夹路径
path_1 = '.\\fscore_feature'
frequency_name = ['Delta', 'Theta', 'Alpha', 'Beta'] # 四个频段
frequency_name_num = np.size(frequency_name) # 频段数
fig = plt.figure(figsize=(16, 14)) # (3.5,10)
for i in range(frequency_name_num):
plt.subplot(2,2,i+1)
# fig.subplots_adjust(left=0.139, bottom=0.1, right=0.99, top=0.98, wspace=0.25, hspace=0.1)
fig.subplots_adjust(left=0.02, bottom=0.1, right=0.99, top=0.98, wspace=0.05, hspace=0.1)
# 保存均值与标准差
inn_single_para_mean = []
inn_single_para_std = []
lie_single_para_mean = []
lie_single_para_std = []
single_frequency_mark = []
inn_lie = ['inn', 'lie']
# 数据路径
# inn
path_2 =path_1+'\\'+inn_lie[0]+'_'+'fscore_feature'+str(i+1)+'.mat'
# 打印正在处理的数据
print('Processing ',path_2)
# 导入数据
data = mat4py.loadmat(path_2)
StructName = inn_lie[0] + '_' + 'fscore_feature'
data_single_frequency = np.transpose(data[StructName])
row = np.size(data_single_frequency,axis=0)
print('Frequency_name: %s, Feature Numbers: %d '%(frequency_name[i],row))
col = np.size(data_single_frequency[0])
if i == 0:
row =4
if i == 1:
row = 5
if i == 2:
row = 7
if i == 3:
row = 7
for j in range(row):
# 参数循环,求 mean ,std
single_frequency_para = data_single_frequency[j]
inn_single_para_mean.append(np.mean(single_frequency_para))
inn_single_para_std.append(np.std(single_frequency_para))
# lie
path_2 = path_1 + '\\' + inn_lie[1] + '_' + 'fscore_feature' + str(i + 1) + '.mat'
# 打印正在处理的数据
print('Processing ',path_2)
# 导入数据
data = mat4py.loadmat(path_2)
StructName = inn_lie[1] + '_' + 'fscore_feature'
data_single_frequency = np.transpose(data[StructName])
for j in range(row):
# 参数循环,求 mean ,std
single_frequency_para = data_single_frequency[j]
lie_single_para_mean.append(np.mean(single_frequency_para))
lie_single_para_std.append(np.std(single_frequency_para))
# 导入数据 xlable names
data_mark_s = mat4py.loadmat(path_1+ '\\' +'fscore_feature_label' + str(i + 1) + '.mat')
data_mark_s = data_mark_s['fscore_feature_label']
# 导入数据,mean,std, 绘制bar
LoadData(inn_single_para_mean, inn_single_para_std, lie_single_para_mean, lie_single_para_std,data_mark_s)
# 保存图片
# plt.savefig('.\\figure_png\\' +frequency_name[0]+frequency_name[1]+frequency_name[2]+frequency_name[3] + '.png',dpi=600) # 循环保存图片
plt.show()
