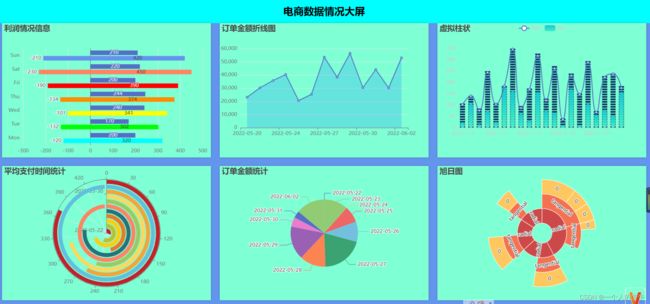
springboot+echarts +mysql制作数据可视化大屏(六图)
作者水平低,如有错误,恳请指正!谢谢!!!!!
项目简单,适合大学生参考
分类专栏还有其它的可视化博客哦!
专栏地址:https://blog.csdn.net/qq_55906442/category_11906804.html?spm=1001.2014.3001.5482
目录
一、数据源
二、所需工具
三、项目框架搭建
四、代码编写
订单金额折线图
利润情况信息
虚拟柱状图
平均支付时间统计
订单金额统计
旭日图
五、大屏编写
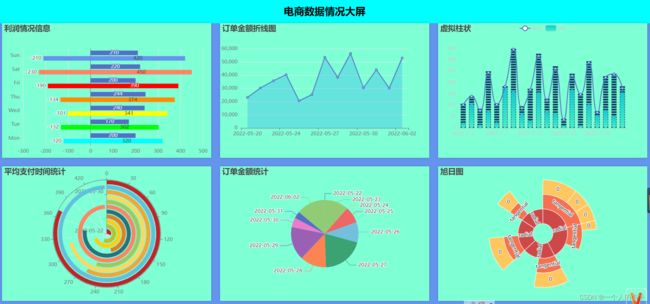
成果展示:
一、数据源
1)可以使用自己的MySQL数据库;
2)使用我提供的数据。(要数据私信/留言——>留下邮箱即可)
二、所需工具
MySQL、IDEA、jdk1.8、Maven等等,总之编写工具要准备好,环境要搭建好
三、项目框架搭建
参考我博客的项目框架搭建,从3.1看到4.3即可springboot+mybatis+echarts +mysql制作数据可视化大屏_spring + 可视化大屏_一个人的牛牛的博客-CSDN博客
四、代码编写
代码简单,后端代码都写在一起了,没有区分controller等等,前端也是一样,没有单独写js等等。有些图数据为了偷懒是手敲的,没有从数据库读取。
订单金额折线图
后端
import org.springframework.beans.factory.annotation.Autowired;
import org.springframework.jdbc.core.JdbcTemplate;
import org.springframework.web.bind.annotation.GetMapping;
import org.springframework.web.bind.annotation.RestController;

import java.util.ArrayList;
import java.util.HashMap;
import java.util.List;
import java.util.Map;

@RestController
public class Big2Controller {

    private final JdbcTemplate jdbcTemplate;

    @Autowired
    public Big2Controller(JdbcTemplate jdbcTemplate) {
        this.jdbcTemplate = jdbcTemplate;
    }

    @GetMapping("/chart-data2")
    public Map getChartData() {
        String query = "SELECT dt, order_amount FROM ads_order_daycount";
        List> result = jdbcTemplate.queryForList(query);

        List labels = new ArrayList<>();
        List values = new ArrayList<>();

        for (Map row : result) {
            String dt = row.get("dt").toString();
            Integer orderAmount = ((Number) row.get("order_amount")).intValue();

            labels.add(dt);
            values.add(orderAmount);
        }

        Map data = new HashMap<>();
        data.put("labels", labels);
        data.put("values", values);

        return data;
    }
}
验证接口:运行项目,浏览器访问http://localhost:8081/chart-data2
前端
折线图
验证页面:运行项目,浏览器访问http://localhost:8081/big2.html
利润情况信息
前端
利润情况信息
验证页面:运行项目,浏览器访问http://localhost:8081/negative.html
虚拟柱状图
前端
虚拟柱状图
验证页面:运行项目,浏览器访问http://localhost:8081/histogram.html
平均支付时间统计
后端
import org.springframework.beans.factory.annotation.Autowired;
import org.springframework.jdbc.core.JdbcTemplate;
import org.springframework.web.bind.annotation.GetMapping;
import org.springframework.web.bind.annotation.RestController;

import java.util.ArrayList;
import java.util.HashMap;
import java.util.List;
import java.util.Map;

@RestController
public class Big3Controller {

    private final JdbcTemplate jdbcTemplate;

    @Autowired
    public Big3Controller(JdbcTemplate jdbcTemplate) {
        this.jdbcTemplate = jdbcTemplate;
    }

    @GetMapping("/chart-data3")
    public Map getChartData() {
        String query = "SELECT dt, payment_avg_time FROM ads_payment_daycount";
        List> result = jdbcTemplate.queryForList(query);

        List labels = new ArrayList<>();
        List values = new ArrayList<>();

        for (Map row : result) {
            String dt = row.get("dt").toString();
            Integer paymentAvgTime = ((Number) row.get("payment_avg_time")).intValue();

            labels.add(dt);
            values.add(paymentAvgTime);
        }

        Map data = new HashMap<>();
        data.put("labels", labels);
        data.put("values", values);

        return data;
    }
}
验证接口:运行项目,浏览器访问http://localhost:8081/chart-data3
前端
平均支付时间统计
验证页面:运行项目,浏览器访问http://localhost:8081/big3.html
订单金额统计
后端
import org.springframework.beans.factory.annotation.Autowired;
import org.springframework.jdbc.core.JdbcTemplate;
import org.springframework.web.bind.annotation.GetMapping;
import org.springframework.web.bind.annotation.RestController;

import java.util.ArrayList;
import java.util.HashMap;
import java.util.List;
import java.util.Map;

@RestController
public class Big4Controller {

    private final JdbcTemplate jdbcTemplate;

    @Autowired
    public Big4Controller(JdbcTemplate jdbcTemplate) {
        this.jdbcTemplate = jdbcTemplate;
    }

    @GetMapping("/chart-data4")
    public Map getChartData() {
        String query = "SELECT dt, order_amount FROM ads_payment_daycount";
        List> result = jdbcTemplate.queryForList(query);

        List labels = new ArrayList<>();
        List values = new ArrayList<>();

        for (Map row : result) {
            String dt = row.get("dt").toString();
            Integer orderAmount = ((Number) row.get("order_amount")).intValue();

            labels.add(dt);
            values.add(orderAmount);
        }

        Map data = new HashMap<>();
        data.put("labels", labels);
        data.put("values", values);

        return data;
    }
} 验证接口:运行项目,浏览器访问http://localhost:8081/chart-data4
前端
订单金额统计
验证页面:运行项目,浏览器访问http://localhost:8081/big4.html
旭日图
前端
旭日图
五、大屏编写
前端
大屏可视化6
电商数据情况大屏
运行项目,浏览器访问http://localhost:8081/yun.html
注:http://localhost:8080/加上HTML的文件名都能够查看相应的图!
要码源的私聊/评论留下邮箱号,压缩包包括项目源码、数据sql文件,readme.txt。
声明:作品仅可作学习使用。

