记一次爬虫学习(爬取51job)
51job上岗位爬取及分析
综合应用所学的python语言知识,设计完成一个爬虫。
(1)请求网页,先获取所有招聘信息的详情url地址;
(2)通过对爬取数据的分析确定要提取的内容(职位,发布日期,工资,工作地点,工作经验,学历要求,招聘人数,公司类别,公司规模);
(3)保存数据为csv文件;
(4)对csv文件内的数据进行分析
(5)用可视化的图表表现出来。
需求分析
每到毕业季,找工作就成了一个重要的事,大量的信息让应聘者眼花缭乱,对此可以制作一个爬虫,自动爬取51job网站上的应聘者感兴趣的相关职位,包括对职位的详细信息如,发布日期,工资,工作地点,工作经验,学历要求,招聘人数,公司类别,公司规模等。然后把相关信息进行整理并保存到本地,最后通过python第三方pyecharts模块,对数据进行可视化展现。
概要设计
运行环境(软、硬件环境)
1.硬件环境:PC机-内存 16GB。
2.软件环境:操作系统-windows10。
开发工具和编程语言
开发环境:PyCharm Community Edition 2020.3 x64。
编程语言:Python3.9。
详细设计
顶层设计
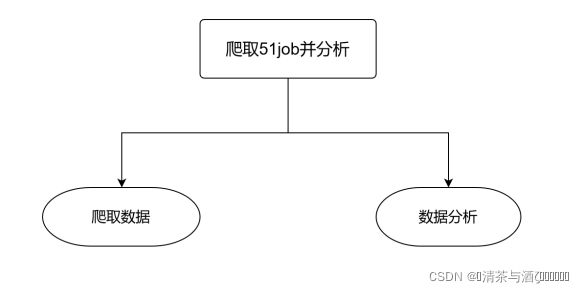
51job上岗位爬取及分析的顶层逻辑如下:
步骤一:选择好爬取网址,用requests.get爬取出大致的数据。
步骤二:对数据进行整理,整理好要调出的数据。
步骤三:将整理好的数据写入csv文件。
步骤四: 读取csv文件,通过pandas对数据进行清洗整理。
步骤五:把新的数据保存为新的csv文件。
步骤六:利用pyecharts把数据进行可视化并展示生成HTML的文件。
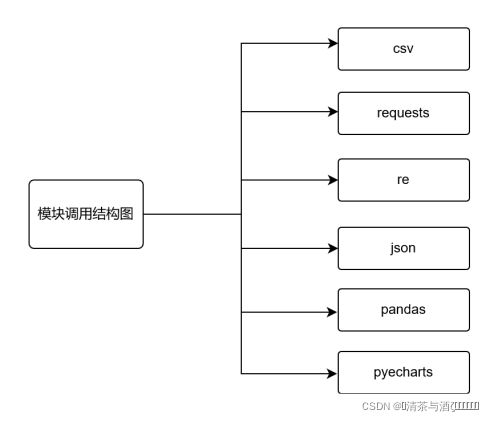
逻辑结构图如下图5.1

图5.1
第1层设计
爬取网页内容,主要利用requests模块,爬取想要数据的url部分
部分代码:
url=‘https://search.51job.com/list/170200,000000,0000,00,9,99,python,2,1.html?lang=c&postchannel=0000&workyear=99&cotype=99°reefrom=99&jobterm=99&companysize=99&ord_field=0&dibiaoid=0&line=&welfare=’
headers = {
‘User-Agent’: ‘Mozilla/5.0 (Windows NT 10.0; Win64; x64; rv:94.0) Gecko/20100101 Firefox/94.0’,
}
response = requests.get(url=url, headers=headers)
执行如图5.2

图5.2
第2层设计
对数据分析发现职位,发布日期,工资,工作地点,工作经验,学历要求,招聘人数,公司类别,公司规模等主要爬取信息window.SEARCH_RESULT = (.?) ······部分内,所以提取出该部分代码。
部分代码:
html_date=re.findall('window._SEARCH_RESULT=(.?)', response.text)[0]
执行如图5.3

图5.3
第3层设计
对数据进行整理(图5.4.1),并写入csv文件(图5.4.2)csv文件会被保存在当前工作空间内。
部分代码:
f =open(‘python招聘.csv’,mode=‘a’,encoding=‘utf-8-sig’,newline=‘’)
csv_writer = csv.DictWriter(f,fieldnames=[‘职位’, ‘发布日期’, ‘工资’, ‘工作地点’, ‘工作经验’,‘学历要求’, ‘招聘人数’, ‘公司类别’, ‘公司规模’,])
csv_writer.writeheader()
for index in json_data:
job_name = index[‘job_name’]
job_time = index[‘issuedate’]
money = index[‘providesalary_text’]
where = index[‘workarea_text’]
job_exp = index[‘attribute_text’][1]
job_deu = index[‘attribute_text’][2]
job_num = index[‘attribute_text’][-1]
companytype_text = index[‘companytype_text’]
companysize_text = index[‘companysize_text’]
dit = {
    '职位':job_name,
    '发布日期':job_time,
    '工资': money,
    '工作地点':where,
    '工作经验': job_exp,
    '学历要求': job_deu,
    '招聘人数': job_num,
    '公司类别': companytype_text,
    '公司规模': companysize_text,
}
csv_writer.writerow(dit)
print(job_name,job_time,money,where,job_exp,job_deu,companytype_text,companysize_text,sep='/')
图5.4.2
第4层设计
用pandas模块对数据进行再读取,然后再对数据进行清洗整理,删除重复的部分,把数据进行统计便于下一步进行制图
部分代码:
整理工作地点
location_list = []
for location in df[‘工作地点’]:
location_list.append(location.split(‘-’)[-1])
df[‘工作地点’] = location_list
整理招聘人数
sales_list = []
for sale in df[‘招聘人数’]:
sale = sale[:-1].replace(‘招’,‘’)
if ‘若干’ in sale:
sale = sale.replace(‘若干’,‘5’)
sales_list.append(sale)
df[‘招聘人数’] = sales_list
locations = [location for location in df[‘工作地点’].value_counts().items()]
整理工资
df[“工资”].str[-1].value_counts()
df[“工资”].str[-3].value_counts()
index1 = df[“工资”].str[-1].isin([“年”,“月”])
index2 = df[“工资”].str[-3].isin([“万”,“千”])
df = df[index1 & index2]
def get_money_max_min(x):
try:
if x[-3] == “万”:
z = [float(i)10000 for i in re.findall("[0-9]+.?[0-9]“,x)]
elif x[-3] == “千”:
z = [float(i) * 1000 for i in re.findall(”[0-9]+.?[0-9]*", x)]
if x[-1] == “年”:
z = [i/12 for i in z]
return z
except:
return x
money = df[“工资”].apply(get_money_max_min)
df[“最低工资”] = money.str[0]
df[“最高工资”] = money.str[1]
df[“工资水平”] = df[[“最低工资”,“最高工资”]].mean(axis=1)
df[‘工资’] = money
执行如下组图5.5
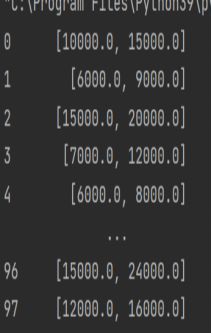
图5.5
第5层设计
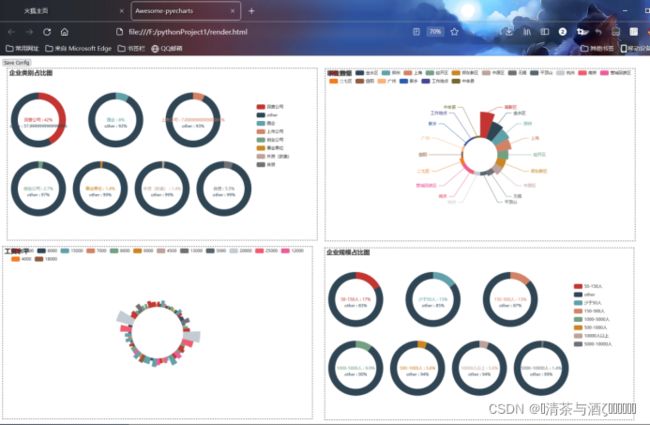
生成新的csv文件和生成可视化的图表。
部分代码:
locations = [location for location in df[‘工作地点’].value_counts().items()]
地区职位数据可视化
from pyecharts import options as opts
from pyecharts.charts import Pie
from pyecharts.faker import Faker
v = Faker.choose()
pie0 = (
Pie()
.add(
“”,
[list(location) for location in locations],
radius=[“20%”, “50%”],
center=[“50%”, “50%”],
rosetype=“area”,
)
.set_global_opts(title_opts=opts.TitleOpts(title=“职位数量”))
)
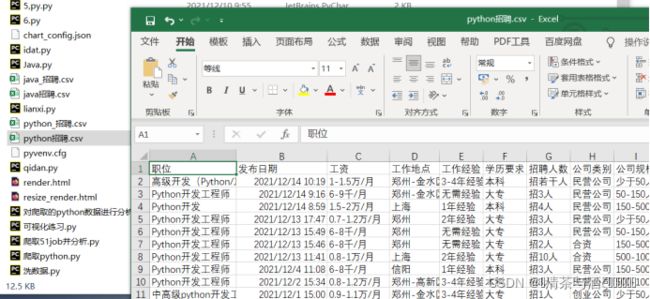
df.to_csv(‘python_招聘.csv’,encoding=‘utf-8-sig’,index=None) #写入新的文件
执行如下图5.6.1新的csv文件,图5.6.2可视化图。

图5.6.2可视化图
测试结果
图7.2
