文章目录
-
- 一、分布
-
- 1 distplot 概率分布图
- 2 kdeplot 概率密度图
- 3、jointplot联合密度图
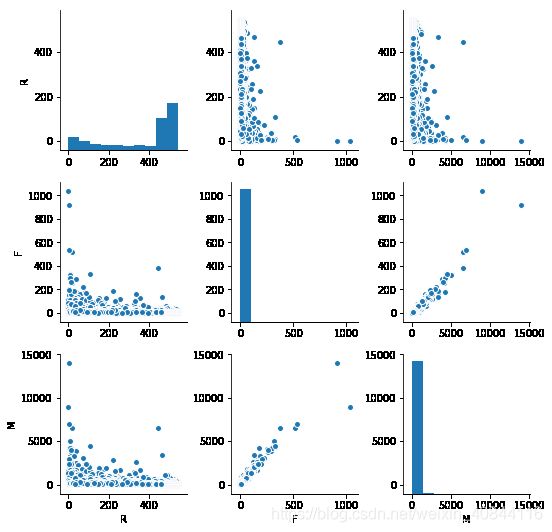
- 4、pairplot多变量图
- 二、分类
-
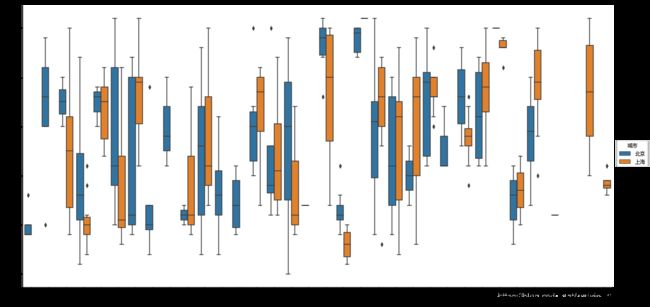
- 1、boxplots箱线图
- 2、violinplot提琴图
- 3、factorplot因子图
- 4、barplot柱形图
- 三、线性
-
参考: http://seaborn.pydata.org/index.html
一、分布
import pandas as pd
import numpy as np
import matplotlib.pyplot as plt
import seaborn as sns
%matplotlib inline
colums=['user_id','order_dt','order_products','order_amount']
df=pd.read_table('CDNOW_master.txt',names=colums,sep='\s+')
df.head()
|
user_id |
order_dt |
order_products |
order_amount |
| 0 |
1 |
19970101 |
1 |
11.77 |
| 1 |
2 |
19970112 |
1 |
12.00 |
| 2 |
2 |
19970112 |
5 |
77.00 |
| 3 |
3 |
19970102 |
2 |
20.76 |
| 4 |
3 |
19970330 |
2 |
20.76 |
1 distplot 概率分布图
sns.distplot(df.order_amount,kde=False,color='m')

2 kdeplot 概率密度图
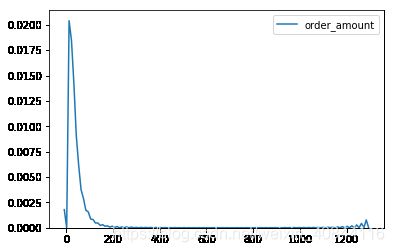
sns.kdeplot(df.order_amount)
grouped_user=df.groupby('user_id').sum()
grouped_user.head()
|
order_dt |
order_products |
order_amount |
| user_id |
|
|
|
| 1 |
19970101 |
1 |
11.77 |
| 2 |
39940224 |
6 |
89.00 |
| 3 |
119833602 |
16 |
156.46 |
| 4 |
79882233 |
7 |
100.50 |
| 5 |
219686137 |
29 |
385.61 |
3、jointplot联合密度图
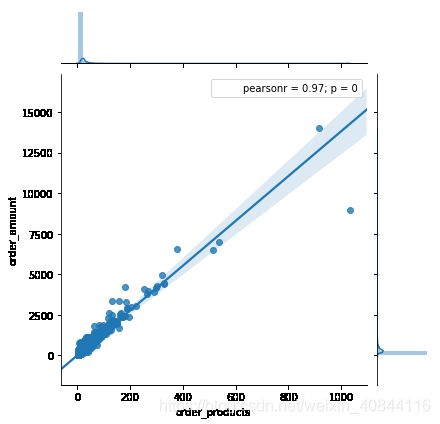
sns.jointplot(grouped_user.order_products,grouped_user.order_amount,kind='reg')
df['order_dt']=pd.to_datetime(df['order_dt'],format='%Y%m%d')
rfm=df.pivot_table(index='user_id',values=['order_amount','order_dt','order_products'],
aggfunc={'order_amount':'sum','order_dt':'max','order_products':'sum'})
rfm['R']=(rfm.order_dt.max()-rfm.order_dt)/np.timedelta64(1,'D')
rfm.rename(columns={'order_products':'F','order_amount':'M'},inplace=True)
rfm
|
M |
order_dt |
F |
R |
| user_id |
|
|
|
|
| 1 |
11.77 |
1997-01-01 |
1 |
545.0 |
| 2 |
89.00 |
1997-01-12 |
6 |
534.0 |
| 3 |
156.46 |
1998-05-28 |
16 |
33.0 |
| 4 |
100.50 |
1997-12-12 |
7 |
200.0 |
| ... |
... |
... |
... |
... |
| 23566 |
36.00 |
1997-03-25 |
2 |
462.0 |
| 23567 |
20.97 |
1997-03-25 |
1 |
462.0 |
| 23568 |
121.70 |
1997-04-22 |
6 |
434.0 |
| 23569 |
25.74 |
1997-03-25 |
2 |
462.0 |
| 23570 |
94.08 |
1997-03-26 |
5 |
461.0 |
23570 rows × 4 columns
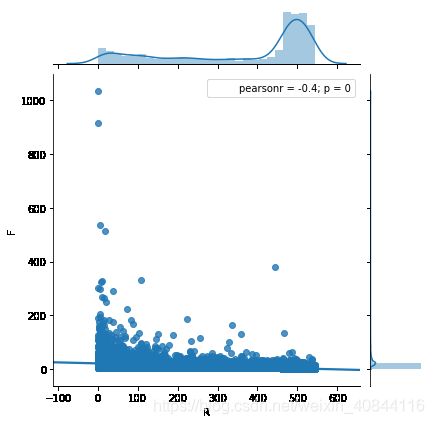
sns.jointplot(rfm.R,rfm.F,kind='reg')
4、pairplot多变量图
sns.pairplot(rfm[['R','F','M']])
二、分类
import numpy as np
import pandas as pd
import matplotlib.pyplot as plt
import seaborn as sns
%matplotlib inline
plt.rcParams['font.sans-serif']=['SimHei']
df=pd.read_csv('cy.csv',encoding='gbk')
df.head()
|
ID |
城市 |
类型 |
店名 |
点评 |
人均 |
口味 |
环境 |
服务 |
| 0 |
1 |
北京 |
私房菜 |
梧桐宇私房菜 |
45.0 |
80.0 |
7.3 |
7.3 |
7.1 |
| 1 |
2 |
北京 |
私房菜 |
小东北私房菜 |
1.0 |
35.0 |
6.9 |
6.9 |
6.9 |
| 2 |
3 |
北京 |
私房菜 |
辣家私房菜 |
1.0 |
NaN |
6.9 |
6.9 |
6.9 |
| 3 |
4 |
北京 |
私房菜 |
鸿福天原 |
NaN |
NaN |
NaN |
NaN |
NaN |
| 4 |
5 |
北京 |
私房菜 |
虾而美(北京)餐饮管理有限公司 |
NaN |
NaN |
NaN |
NaN |
NaN |
1、boxplots箱线图
df2=df.query("(城市=='上海')|(城市=='北京')")
plt.figure(figsize=(20,5))
sns.boxplot(x='类型',y='口味',data=df2,hue='城市')

2、violinplot提琴图
plt.figure(figsize=(20,5))
sns.violinplot(x='类型',y='口味',data=df2,hue='城市',palette='muted',split=True)

3、factorplot因子图
sns.factorplot(x='类型',y='口味',hue='城市',data=df2,size=8,kind='box',aspect=2 )
sns.factorplot(x='类型',y='口味',data=df,size=8,kind='violin',aspect=2,col='城市',col_wrap=4 )
4、barplot柱形图
plt.figure(figsize=(20,5))
sns.barplot(x='类型',y='口味',hue='城市',data=df2)

三、线性
import numpy as np
import pandas as pd
import matplotlib.pyplot as plt
import seaborn as sns
%matplotlib inline
plt.rcParams['font.sans-serif']=['SimHei']
df=pd.read_csv('cy.csv',encoding='gbk')
df2=df.query("(城市=='上海')|(城市=='北京')")
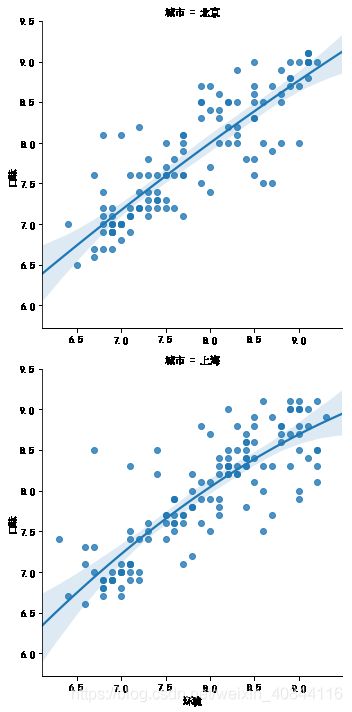
1.回归图
sns.lmplot(x='环境',y='口味',data=df2.query('点评<2000'),row='城市',order=2)
2.热力图
pt=df.pivot_table(index='城市',columns='类型',values='口味',aggfunc='mean')
plt.figure(figsize=(20,10))
sns.heatmap(pt,annot=True)
