js、css实现自适应页面(大屏)
分辨率1920*1080,其它分辨率的也可以试试。
第一种方式(类似浏览器Ctrl+鼠标滚轮缩放),目前发现一个缺陷,用到了echarts 缩放后鼠标悬浮图标后会出现鼠标焦点不对应
head 里面加上
    <meta name="viewport" content="width=device-width,initial-scale=1.0,user-scalable=no">
<script>
        var tid,
            doc=document,
            docEl = doc.documentElement;
        docEl.style.zoom=docEl.clientWidth / 1920;


        addEventListener('resize', function () {
            clearTimeout(tid);
            tid = setTimeout(function () {
                docEl.style.zoom=docEl.clientWidth / 1920;
                // window.location.reload();
            }, 300);
        }, false);
</script>
2022年4月12日新加针对 echarts 缩放后鼠标焦点不对应问题进行解决
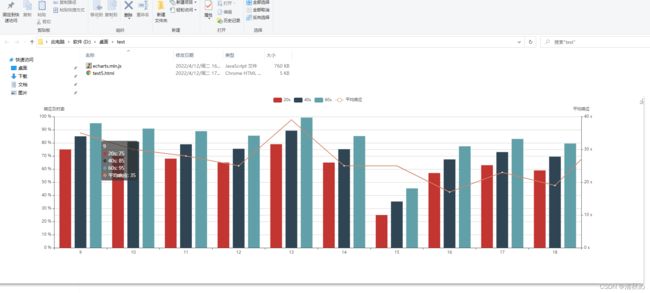
以下是完整代码,新建一个html文件复制进去并下载一个echarts.min.js即可看效果,如图
DOCTYPE html>
<html lang="zh-CN">
<head>
    <meta charset="UTF-8">
    <title>test5title>
    <script src="echarts.min.js">script>

    <script>
        //该方法通过 onload 调用
        function resize() {
            var tid,
                doc=document,
                docEl = doc.documentElement;
            //只有缩放浏览器时才触发
            addEventListener('resize', function () {
                clearTimeout(tid);
                tid = setTimeout(function () {
                    //看情况是否需要重新加载页面,如果界面上只有echarts调用该方法即可实现
                    // window.location.reload();
                    reloadZoom(docEl);
                }, 300);
            }, false);
            //立即触发一次
            reloadZoom(docEl);
        }
        function reloadZoom(docEl) {
            const zoom = docEl.clientWidth / 1920;
            docEl.style.zoom=zoom;
            setEchartsStyle(zoom);
        }

        //获取echarts相关的元素对齐单独处理
        function setEchartsStyle(zoom){
            const echartsDiv = document.getElementsByName("echarts");
            echartsDiv.forEach(function (e) {
                e.style.zoom = 1/zoom;
                e.style.transform =" scale(" +zoom+" )";
                e.style.transformOrigin ="0%0%";
            })
        }
    script>


head>
<body onload="resize()">

<div id="report" name="echarts" style="height: 500px;width: 1910px">div>
<script>
    report = echarts.init(document.getElementById('report'))
    // 绘制图表
    report.setOption({
        tooltip: {
            trigger: 'axis',
            axisPointer: {
                type: 'cross',
                crossStyle: {
                    color: '#999'
                }
            }
        },
        toolbox: {
            feature: {
                saveAsImage: {show: true}
            }
        },
        legend: {
            data: ['20s', '40s', '60s', '平均响应']
        },
        xAxis: {
            type: 'category',
            data: ['9', '10', '11', '12', '13', '14', '15', '16', '17', '18'],
            axisPointer: {
                type: 'shadow'
            }
        },
        yAxis: [
            {
                type: 'value',
                name: '响应及时率',
                min: 0,
                max: 100,
                interval: 10,
                axisLabel: {
                    formatter: '{value} %'
                }
            },
            {
                type: 'value',
                name: '平均响应',
                min: 0,
                // max: 60,
                // interval: 20,
                axisLabel: {
                    formatter: '{value} s'
                }
            }
        ],
        series: [
            {
                name: '20s',
                type: 'bar',
                tooltip: {
                    valueFormatter: function (value) {
                        return value + ' %';
                    }
                },
                data: [75, 70, 68, 65, 79, 65, 25, 57, 63, 59, 75]
            },
            {
                name: '40s',
                type: 'bar',
                tooltip: {
                    valueFormatter: function (value) {
                        return value + ' %';
                    }
                },
                data: [85, 80.89, 78.92, 75.5, 89.3, 75.2, 35.3, 67.4, 73, 69.5, 85]
            },
            {
                name: '60s',
                type: 'bar',
                tooltip: {
                    valueFormatter: function (value) {
                        return value + ' %';
                    }
                },
                data: [95, 90.89, 88.92, 85.5, 99.3, 85.2, 45.3, 77.4, 83.0, 79.5, 95]
            },
            {
                name: '平均响应',
                type: 'line',
                yAxisIndex: 1,
                tooltip: {
                    valueFormatter: function (value) {
                        return value + ' s';
                    }
                },
                data: [35, 30, 28, 25, 39, 25, 25, 17, 23, 19, 35]
            }
        ]
    });
script>
body>
html>
第二种方式(推荐 虽然改动较大,实实在在自适应缩放)
    <meta name="viewport" content="width=device-width,initial-scale=1.0,user-scalable=no">
<script>
        var tid,
            doc=document,
            docEl = doc.documentElement;
         var refreshRem = function () {
                    var clientWidth = docEl.clientWidth;
                    if (clientWidth >= 1920) {
                        docEl.style.fontSize = '10px'; //1rem  = 10px
                    } else {
                        docEl.style.fontSize = 10 * (clientWidth / 1920) + 'px';
                    }
                };
         addEventListener('resize', function () {
               clearTimeout(tid);
               tid = setTimeout(refreshRem, 300);
           }, false);
         addEventListener('pageshow', function (e) {
               if (e.persisted) {
                   clearTimeout(tid);
                   tid = setTimeout(refreshRem, 300);
               }
           }, false);
           refreshRem();
</script>
然后 css 改用下面的那种单位,上面第二种方法 相当于 1rem=10px
.div{
    text-align: center;
    height:200px;
    line-height: 46px;
}
/*改为下面的*/
.div{
    text-align: center;
    height:20rem;
    line-height: 4.6rem;
}

