波士顿房价预测——线性回归模型
1. 案例背景介绍
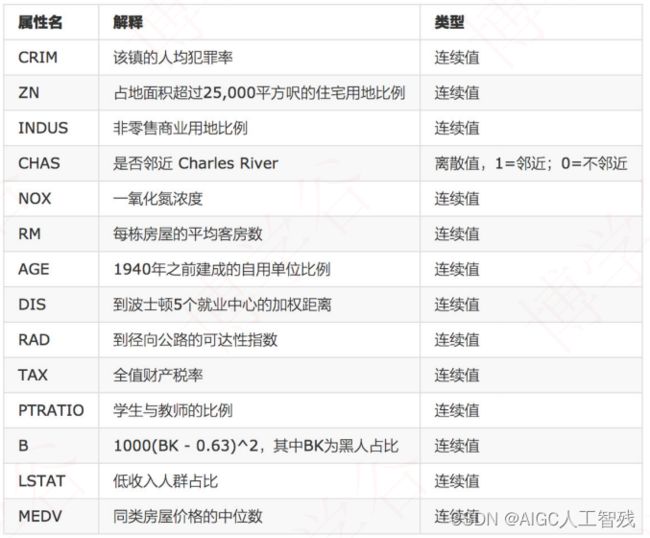
数据介绍
该数据是UCI ML房价数据集的副本,以下特征是专家得出的影响房价的结果属性,所以可以直接使用,但很多时候需要我们自己去量化特征找出需要的属性。

2. 处理流程
- 基本数据处理
数据很规整,没有需要特别处理的,我们确定特征属性是前13项,最后一项为目标值,所以在基本数据处理这一块只要做数据分割即可。 - 特征工程
对数据进行标准化处理。 - 机器学习
使用线性回归模型进行预测。 - 模型评估
使用均方误差MSE
3. 代码实现
由于波士顿房价的数据设计种族问题,最新的版本的sklearn已经删除该数据,以下代码能够恢复波士顿房价数据。
import pandas as pd
import numpy as np

#获取波士顿房价数据
data_url = "http://lib.stat.cmu.edu/datasets/boston"
raw_df = pd.read_csv(data_url, sep="\s+", skiprows=22, header=None)
data = np.hstack([raw_df.values[::2, :], raw_df.values[1::2, :2]])
target = raw_df.values[1::2, 2]
# 给数据添加标签,其中house_df为特征数据,house_target为目标数据
house_df = pd.DataFrame(data)
house_targe = pd.DataFrame(target)
house_df.columns = [['crim','zn','indus','chas','nox','rm','age','dis','rad','tax','ptradio','b','lstat']]
house_targe.columns = [['medv'] ]
导入需要的包
from sklearn.model_selection import train_test_split
from sklearn.preprocessing import StandardScaler
from sklearn.metrics import mean_squared_error
from sklearn.linear_model import LinearRegression
from sklearn.linear_model import SGDRegressor
线性回归——正规方程法
# 线性回归:正轨方程
# 数据分割
X_train, X_test, y_train, y_test = train_test_split(house_df, house_targe,random_state=22)
# 数据标准化
std_scaler = StandardScaler()
X_train = std_scaler.fit_transform(X_train)
X_test = std_scaler.transform(X_test)
# 机器学习——线性回归
line_estimator = LinearRegression()
line_estimator.fit(X_train,y_train)

# 预测数据,并评估模型
y_predict = line_estimator.predict(X_test)
# print('获取预测数据:', y_predict)
print('获取预测模型的系数:', line_estimator.coef_)
print('获取模型的截距:', line_estimator.intercept_)

error = mean_squared_error(y_test, y_predict)
print('误差为:', error)
线性回归——随机梯度下降法
# 线性回归:梯度下降法
# 数据分割
X_train, X_test, y_train, y_test = train_test_split(house_df, house_targe,random_state=22)
# 数据标准化
std_scaler = StandardScaler()
X_train = std_scaler.fit_transform(X_train)
X_test = std_scaler.transform(X_test)
# 机器学习——随机梯度下降
sgd_estimator = SGDRegressor(max_iter=1500)
sgd_estimator.fit(X_train,y_train)

# 预测数据,并评估模型
y_predict = sgd_estimator.predict(X_test)
# print('获取预测数据:', y_predict)
print('获取预测模型的系数:', sgd_estimator.coef_)
print('获取模型的截距:', sgd_estimator.intercept_)

error = mean_squared_error(y_test, y_predict)
print('误差为:', error)
sgd_estimator = SGDRegressor(max_iter=1000,
learning_rate='constant', eta0=0.001)
## 误差为: 21.09793517906924

sgd_estimator = SGDRegressor(max_iter=1000,
learning_rate='constant', eta0=0.01)
## 误差为 20.750301865661907

sgd_estimator = SGDRegressor(max_iter=1000,
learning_rate='constant', eta0=0.01)
## 误差为: 45432723023620.53

sgd_estimator = SGDRegressor(max_iter=1000,
learning_rate='constant', eta0=1)
## 误差为: 6.1713978282038975e+25
以上可以看出eta0越大,误差越大。当然不同的系数会有不同的系数。
线性回归——岭回归
## 岭回归
# 线性回归:梯度下降法
# 数据分割
X_train, X_test, y_train, y_test = train_test_split(house_df, house_targe,random_state=22)
# 数据标准化
std_scaler = StandardScaler()
X_train = std_scaler.fit_transform(X_train)
X_test = std_scaler.transform(X_test)
# 机器学习——岭回归
r_estimator = Ridge(alpha=1)
r_estimator.fit(X_train,y_train)

# 预测数据,并评估模型
y_predict = r_estimator.predict(X_test)
# print('获取预测数据:', y_predict)
# print('获取预测模型的系数:', sgd_estimator.coef_)
# print('获取模型的截距:', sgd_estimator.intercept_)

error = mean_squared_error(y_test, y_predict)
print('误差为:', error)
![]()


