累趴了草莓屁屁
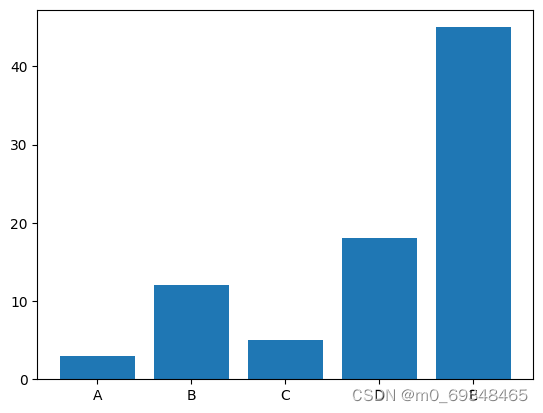
一、# 使用python和matplotlib完成条形图
# Libraries
import numpy as np
import matplotlib.pyplot as plt

# Create dataset
height = [3, 12, 5, 18, 45]
bars = ('A', 'B', 'C', 'D', 'E')
x_pos = np.arange(len(bars))

# Create bars
plt.bar(x_pos, height)

# Create names on the x-axis
plt.xticks(x_pos, bars)

# Show graphic
plt.show()
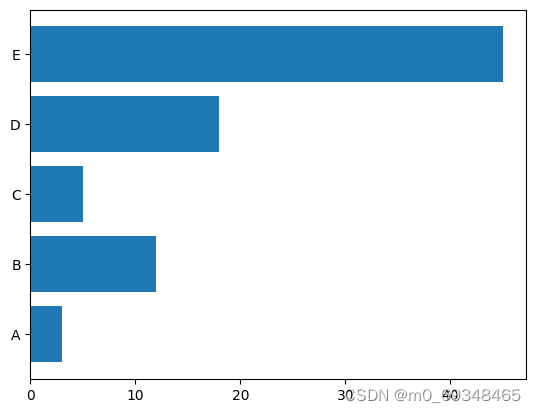
二、利用matplotlib构建水平条形图
# libraries
import matplotlib.pyplot as plt
import numpy as np

# create dataset
height = [3, 12, 5, 18, 45]
bars = ('A', 'B', 'C', 'D', 'E')
y_pos = np.arange(len(bars))

# Create horizontal bars
plt.barh(y_pos, height)

# Create names on the x-axis
plt.yticks(y_pos, bars)

# Show graphic
plt.show()
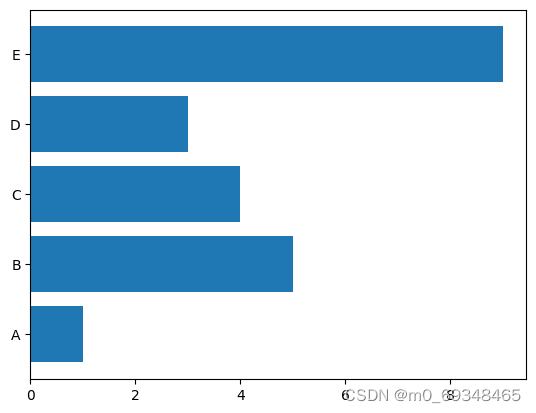
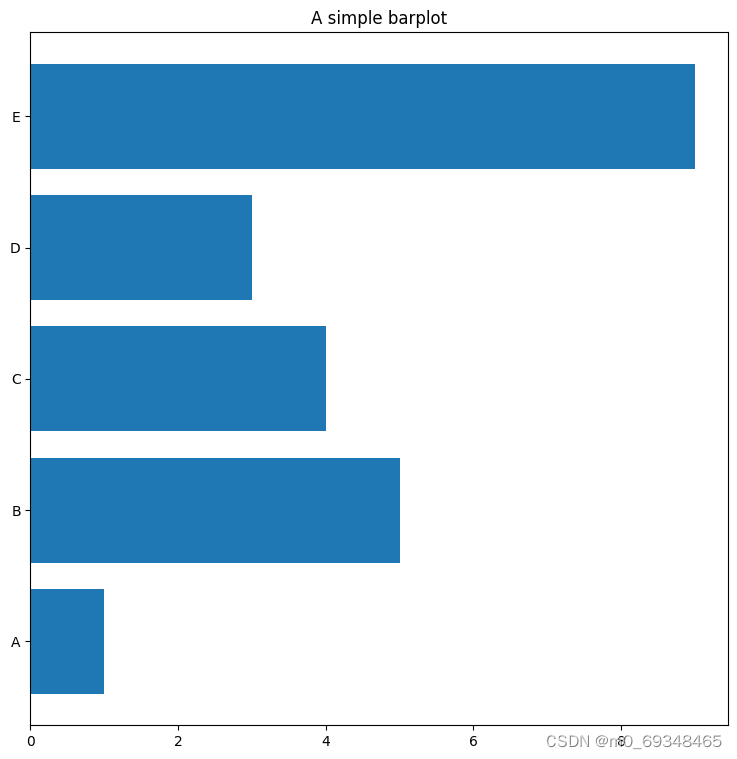
三、从Pandas数据框架
# import libraries
import pandas as pd
import matplotlib.pyplot as plt

# Create a data frame
df = pd.DataFrame ({
        'Group':  ['A', 'B', 'C', 'D', 'E'],
        'Value': [1,5,4,3,9]
})

# Create horizontal bars
plt.barh(y=df.Group, width=df.Value);
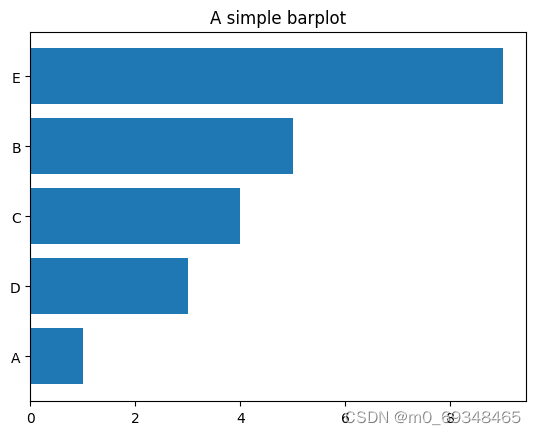
四、控制令
条形图在排序时总是更有洞察能力,它可以让你更快的利埃杰物品地排名。你只需要预先对pandas数据进行排序,就可以对图进行排序
# import libraries
import pandas as pd
import matplotlib.pyplot as plt

# Create a data frame
df = pd.DataFrame ({
        'Group':  ['A', 'B', 'C', 'D', 'E'],
        'Value': [1,5,4,3,9]
})

# Sort the table
df = df.sort_values(by=['Value'])

# Create horizontal bars
plt.barh(y=df.Group, width=df.Value);

# Add title
plt.title('A simple barplot');
五、面向对象地API
# import libraries
import pandas as pd
import matplotlib.pyplot as plt

# Create a data frame
df = pd.DataFrame ({
        'Group':  ['A', 'B', 'C', 'D', 'E'],
        'Value': [1,5,4,3,9]
})

# Initialize a Figure and an Axes
fig, ax = plt.subplots()

# Fig size
fig.set_size_inches(9,9)

# Create horizontal bars
ax.barh(y=df.Group, width=df.Value);

# Add title
ax.set_title('A simple barplot');
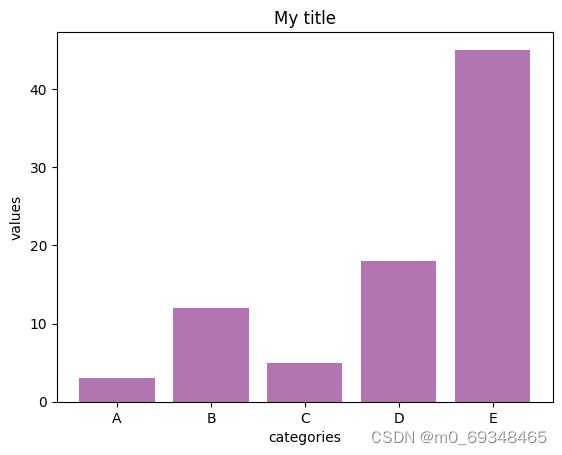
六、粉色的条形图
# libraries
import numpy as np
import matplotlib.pyplot as plt

# create dataset
height = [3, 12, 5, 18, 45]
bars = ('A', 'B', 'C', 'D', 'E')
x_pos = np.arange(len(bars))

# Create bars and choose color
plt.bar(x_pos, height, color = (0.5,0.1,0.5,0.6))

# Add title and axis names
plt.title('My title')
plt.xlabel('categories')
plt.ylabel('values')

# Create names on the x axis
plt.xticks(x_pos, bars)

# Show graph
plt.show()
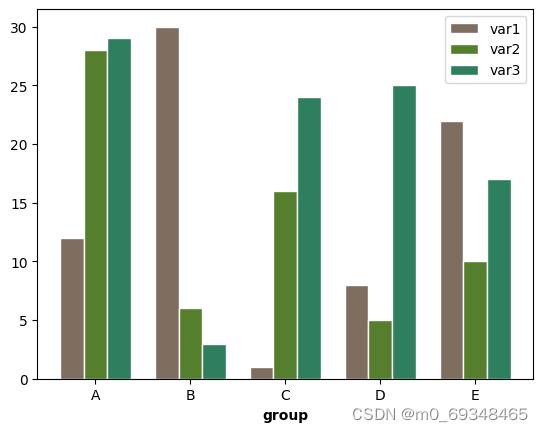
七、分组条形图
下面地例子显示了5个不同的组和他们地3个变量,这个图变成了堆叠地区域条形图
# libraries
import numpy as np
import matplotlib.pyplot as plt

# set width of bars
barWidth = 0.25

# set heights of bars
bars1 = [12, 30, 1, 8, 22]
bars2 = [28, 6, 16, 5, 10]
bars3 = [29, 3, 24, 25, 17]

# Set position of bar on X axis
r1 = np.arange(len(bars1))
r2 = [x + barWidth for x in r1]
r3 = [x + barWidth for x in r2]

# Make the plot
plt.bar(r1, bars1, color='#7f6d5f', width=barWidth, edgecolor='white', label='var1')
plt.bar(r2, bars2, color='#557f2d', width=barWidth, edgecolor='white', label='var2')
plt.bar(r3, bars3, color='#2d7f5e', width=barWidth, edgecolor='white', label='var3')

# Add xticks on the middle of the group bars
plt.xlabel('group', fontweight='bold')
plt.xticks([r + barWidth for r in range(len(bars1))], ['A', 'B', 'C', 'D', 'E'])

# Create legend & Show graphic
plt.legend()
plt.show()
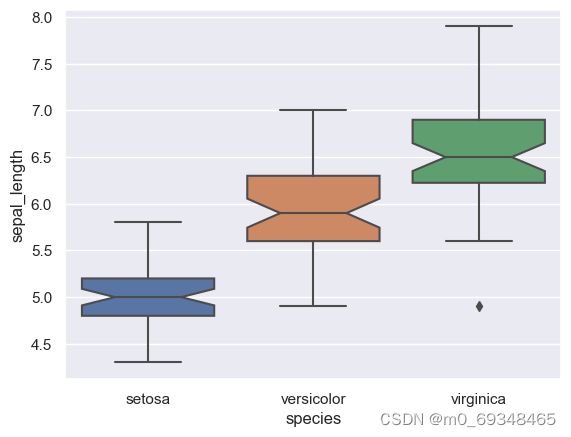
八、 32-箱线图,自定义线宽增加缺口
图书馆和数据集
# libraries & dataset
import seaborn as sns
import matplotlib.pyplot as plt
# set a grey background (use sns.set_theme() if seaborn version 0.11.0 or above)
sns.set(style="darkgrid")
df = sns.load_dataset('iris',cache=True,data_home="../seaborn-data-master")

sns.boxplot(x=df["species"], y=df["sepal_length"], notch=True)
plt.show()
九、123-折线图
突出特定组的技巧是首先用细而谨慎的线条绘制所有组。然后用有力的、真正可见的线条重新绘制感兴趣的群体。此外,用自定义的注释注释这个突出显示的组是一个很好的实践。
# libraries
import matplotlib.pyplot as plt
import numpy as np
import pandas as pd

# Make a data frame
df=pd.DataFrame({'x': range(1,11), 'y1': np.random.randn(10), 'y2': np.random.randn(10)+range(1,11), 'y3': np.random.randn(10)+range(11,21), 'y4': np.random.randn(10)+range(6,16), 'y5': np.random.randn(10)+range(4,14)+(0,0,0,0,0,0,0,-3,-8,-6), 'y6': np.random.randn(10)+range(2,12), 'y7': np.random.randn(10)+range(5,15), 'y8': np.random.randn(10)+range(4,14) })

# Change the style of plot
plt.style.use('seaborn-darkgrid')

# set figure size
my_dpi=96
plt.figure(figsize=(480/my_dpi, 480/my_dpi), dpi=my_dpi)

# plot multiple lines
for column in df.drop('x', axis=1):
    plt.plot(df['x'], df[column], marker='', color='grey', linewidth=1, alpha=0.4)

# Now re do the interesting curve, but biger with distinct color
plt.plot(df['x'], df['y5'], marker='', color='orange', linewidth=4, alpha=0.7)

# Change x axis limit
plt.xlim(0,12)

# Let's annotate the plot
num=0
for i in df.values[9][1:]:
    num+=1
    name=list(df)[num]
    if name != 'y5':
        plt.text(10.2, i, name, horizontalalignment='left', size='small', color='grey')

# And add a special annotation for the group we are interested in
plt.text(10.2, df.y5.tail(1), 'Mr Orange', horizontalalignment='left', size='small', color='orange')

# Add titles
plt.title("Evolution of Mr Orange vs other students", loc='left', fontsize=12, fontweight=0, color='orange')
plt.xlabel("Time")
plt.ylabel("Score")

# Show the graph
plt.show()
C:\Users\HONGPING\AppData\Local\Temp\ipykernel_55976\876129807.py:10: MatplotlibDeprecationWarning: The seaborn styles shipped by Matplotlib are deprecated since 3.6, as they no longer correspond to the styles shipped by seaborn. However, they will remain available as 'seaborn-v0_8-