R语言ggalluvia包优雅的绘制桑基图
桑基图通常用于表示能量、物料、资本等数据从一个地方流入另一个地方。左边代表留出点,右边代表流入点,中间带宽表示流入量的大小,因此,我们通过桑基图清晰的看到两个节点的数据流动。今天介绍一下ggalluvia包绘制桑基图,ggalluvia包的特点是相对操作简单,容易上手。
library(foreign)
library(ggplot2)
library(ggalluvial)
library(networkD3)
bc <- read.spss("E:/r/test/tree_car.sav",
                use.value.labels=F, to.data.frame=T)

我们来看下数据,car就是汽车售价,age是年龄,gender是性别,inccat是收入,这里分成4个等级,ed是教育程度。(公众号回复:汽车销售,可以获得该数据)。
我们处理一下数据,把分类变量转换成因子,然后加上一个标签。
bc$ed<-factor(bc$ed,levels=c(1:5),labels=c("小学","初中","高中","大学","博士"))
bc$inccat<-factor(bc$inccat,levels=c(1:4),labels=c("低收入","中低收入","中等收入","富裕"))
bc$gender<-ifelse(bc$gender=="m",1,0)
bc$gender<-factor(bc$gender,levels = c(0,1),labels=c("女性","男性"))
bc$marital<-factor(bc$marital,levels = c(0,1),labels=c("未婚","已婚"))
bc<-bc[1:100,]
ggalluvial包绘制桑基图还是比较简单的,我们先要设置axis1流出节点,和axis2流入节点
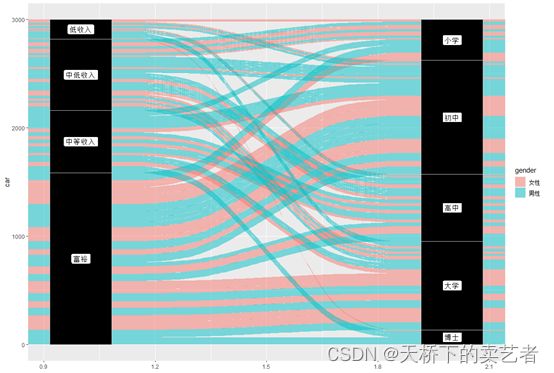
假设我们想知道不同收入人群购车费用在不同性别的流动(演示而已,不具有实际意义),
ggplot(bc,aes(y = car, axis1 = inccat, axis2 =ed)) +
  geom_alluvium(aes(fill = gender))
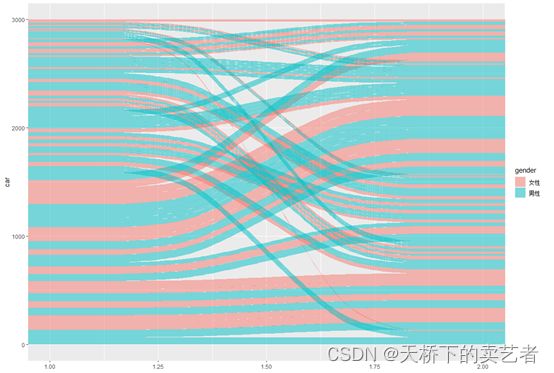
这样一个最简单的桑基图就画好了,我们给它进一步设置宽度,加个方框和字体,fill这里表示方框的颜色
ggplot(bc,aes(y = car, axis1 = inccat, axis2 =ed)) +
  geom_alluvium(aes(fill = gender)) +
  geom_stratum(width = 1/6, fill = "black", color = "grey") +
  geom_label(stat = "stratum", aes(label = after_stat(stratum)))
ggplot(bc,aes(y = car, axis1 = inccat, axis2 =ed)) +
  geom_alluvium(aes(fill = gender)) +
  geom_stratum(width = 1/6, fill = "black", color = "grey") +
  geom_label(stat = "stratum", aes(label = after_stat(stratum))) +
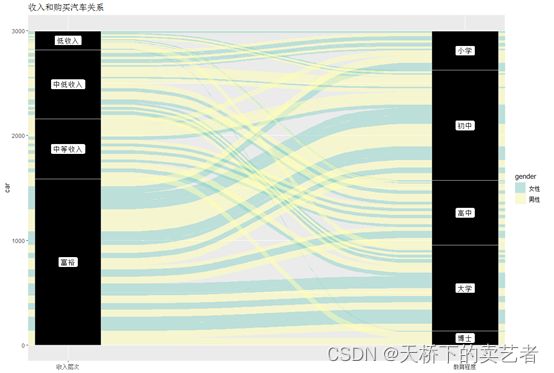
  scale_x_discrete(limits = c("收入层次", "教育程度"), expand = c(.05, .05)) +
  scale_fill_brewer(type = "qual", palette = "Set1") +
  ggtitle("收入和购买汽车关系")
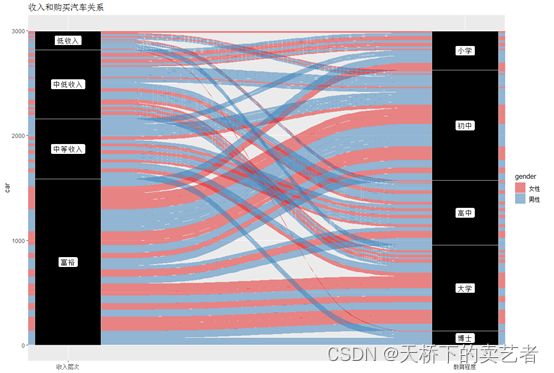
在scale_fill_brewer中set可以对风格进一步设置
ggplot(bc,aes(y = car, axis1 = inccat, axis2 =ed)) +
  geom_alluvium(aes(fill = gender)) +
  geom_stratum(width = 1/6, fill = "black", color = "grey") +
  geom_label(stat = "stratum", aes(label = after_stat(stratum))) +
  scale_x_discrete(limits = c("收入层次", "教育程度"), expand = c(.05, .05)) +
  scale_fill_brewer(type = "qual", palette = "Set3") +
  ggtitle("收入和购买汽车关系")
ggplot(bc,aes(y = car, axis1 = inccat, axis2 =ed,axis3 = marital)) +
  geom_alluvium(aes(fill = gender)) +
  geom_stratum(width = 1/6, fill = "black", color = "grey") +
  geom_label(stat = "stratum", aes(label = after_stat(stratum))) +
  scale_x_discrete(limits = c("Gender", "Dept"), expand = c(.05, .05)) +
  scale_fill_brewer(type = "qual", palette = "Set3") +
  ggtitle("收入和购买汽车关系")
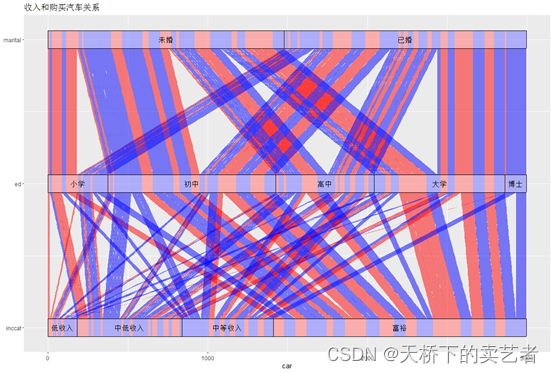
ggplot(bc,aes(y = car,
              axis1 = inccat, axis2 = ed, axis3 = marital)) +
  geom_alluvium(aes(fill = gender),
                width = 1/8, knot.pos = 0, reverse = FALSE) +
  scale_fill_manual(values = c("男性"= "blue", "女性" = "red")) +
  guides(fill = "none") +
  geom_stratum(alpha = .4, width = 1/8, reverse = FALSE) +
  geom_text(stat = "stratum", aes(label = after_stat(stratum)),
            reverse = FALSE) +
  scale_x_continuous(breaks = 1:3, labels = c("inccat", "ed", "marital")) +
  coord_flip() +
  ggtitle("收入和购买汽车关系")
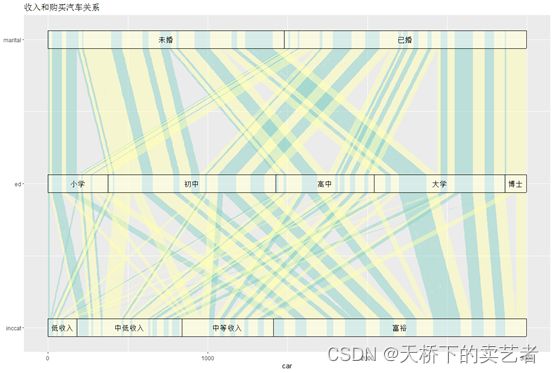
ggplot(bc,aes(y = car,
              axis1 = inccat, axis2 = ed, axis3 = marital)) +
  geom_alluvium(aes(fill = gender),
                width = 1/8, knot.pos = 0, reverse = FALSE) +
  scale_fill_manual(values = c("男性"= "blue", "女性" = "red")) +
  guides(fill = "none") +
  geom_stratum(alpha = .4, width = 1/8, reverse = FALSE) +
  geom_text(stat = "stratum", aes(label = after_stat(stratum)),
            reverse = FALSE) +
  scale_fill_brewer(type = "qual", palette = "Set3")+
  scale_x_continuous(breaks = 1:3, labels = c("inccat", "ed", "marital")) +
  coord_flip() +
  ggtitle("收入和购买汽车关系")


