目标检测之3维合成
现在有一系列的图片,图片之间可以按照z轴方向进行排列。图片经过了目标检测,输出了一系列的检测框,现在的需求是将检测框按类别进行合成,以在3维上生成检测结果。
思路:将图片按照z轴方向排列,以z轴索引作为检测框的z值。等同于输入为(x, y, w, h, z, class_id),可以计算得到每个检测框的中心点来标定这个框(x_center, y_center, z, class_id)。
然后可以通过聚类算法在4维空间上进行聚类,最后取出聚类出的每一类的点的xyz的最大值与最小值和class_id来生成聚类结果[x_min, y_min, z_min, x_max, y_max, z_max, class_id]。
代码展示:
from sklearn.cluster import DBSCAN
import matplotlib.pyplot as plt
from mpl_toolkits.mplot3d import Axes3D
import numpy as np

class BBoxClusterv3:
    def __init__(self, bbox_list):
        self.bbox_list = bbox_list
        self.clustering = None
        # self.color_map = plt.cm.get_cmap('hsv', len(set([bbox[5] for bbox in bbox_list])))

    def cluster(self, eps=100, min_samples=2):
        X = [[bbox[0]+bbox[2]/2, bbox[1]+bbox[3]/2, bbox[4], bbox[5]] for bbox in self.bbox_list]  # 中心点的x,y,z坐标和类别ID
        # breakpoint()
        self.clustering = DBSCAN(eps=eps, min_samples=min_samples).fit(X)

    def get_new_bbox_list(self):
        # self.cluster()
        labels = self.clustering.labels_
        print("聚类出的类别:",labels)
        new_bbox_list = []
        for label in set(labels):
            if label != -1:  # Ignore noise
                idxs = np.where(labels == label)[0]
                print("每一类的bboxes索引: ",idxs)
                bboxes = np.array(self.bbox_list)[idxs]
                print("每一类的bboxes集合: ",bboxes)
                x_min = np.min(bboxes[:, 0])
                y_min = np.min(bboxes[:, 1])
                x_max = np.max(bboxes[:, 0] + bboxes[:, 2])
                y_max = np.max(bboxes[:, 1] + bboxes[:, 3])
                z_min = np.min(bboxes[:, 4])
                z_max = np.max(bboxes[:, 4])
                class_id = bboxes[0, 5]
                new_bbox_list.append([x_min, y_min, z_min, x_max, y_max, z_max, class_id])
        return new_bbox_list

    def draw_bbox_2d(self, bbox, ax):
        x_min, y_min, w, h, z, class_id = bbox
        color = self.color_map(class_id)
        # print(color)
        for xi in [x_min, x_min+w]:
            for yi in [y_min, y_min+h]:
                ax.plot([xi, xi], [yi, yi], [z, z], color=color, linestyle='dashed')
        for xi in [x_min, x_min+w]:
            ax.plot([xi, xi], [y_min, y_min+h], [z, z], color=color, linestyle='dashed')
        for yi in [y_min, y_min+h]:
            ax.plot([x_min, x_min+w], [yi, yi], [z, z], color=color, linestyle='dashed')

    def draw_bbox_3d(self, bbox, ax):
        x_min, y_min, z_min, x_max, y_max, z_max, class_id = bbox
        color = self.color_map(class_id)
        for xi in [x_min, x_max]:
            for yi in [y_min, y_max]:
                ax.plot([xi, xi], [yi, yi], [z_min, z_max], color=color)
        for xi in [x_min, x_max]:
            for zi in [z_min, z_max]:
                ax.plot([xi, xi], [y_min, y_max], [zi, zi], color=color)
        for yi in [y_min, y_max]:
            for zi in [z_min, z_max]:
                ax.plot([x_min, x_max], [yi, yi], [zi, zi], color=color)

    def visualize(self, bbox_list=None, new_bbox_list=None):
        fig = plt.figure()
        ax = fig.add_subplot(111, projection='3d')

        for bbox in bbox_list:
            self.draw_bbox_2d(bbox, ax)

        for bbox in new_bbox_list:
            self.draw_bbox_3d(bbox, ax)

        plt.show()

    def draw(self):
        new_bbox_list = self.get_new_bbox_list()
        print(bbox_list,new_bbox_list)
        self.visualize(bbox_list, new_bbox_list)

    def color_map(self, class_id):
        # 假设这里使用映射字典将类别 ID 映射到不同的颜色
        color_mapping = {0: 'red', 1: 'blue', 2: 'green'}
        return color_mapping.get(class_id, 'black')  # 默认为黑色

if __name__ == "__main__":
    bbox_list = [
        #-------------------------#
        #[x, y, w, h, z, class_id]#
        #-------------------------#
        [100, 200, 50, 50, 0, 0],
        [110, 210, 50, 50, 1, 0],
        [120, 220, 50, 50, 2, 0],
        [130, 230, 50, 50, 3, 0],
        [140, 240, 50, 50, 4, 0],
        [200, 300, 60, 60, 0, 1],
        [210, 310, 60, 60, 1, 1],
        [220, 320, 60, 60, 2, 1],
        [300, 400, 70, 70, 6, 0],
        [310, 410, 70, 70, 7, 0],
        [320, 420, 70, 70, 8, 0],
        [400, 500, 80, 80, 9, 1],
        [410, 510, 80, 80, 10, 1],
        [420, 520, 80, 80, 11, 2]
    ]
    bbox_cluster = BBoxClusterv3(bbox_list)
    bbox_cluster.cluster()
    bbox_cluster.draw()
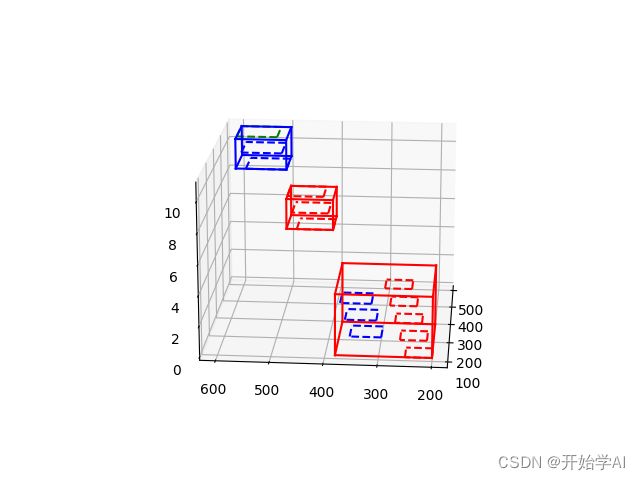
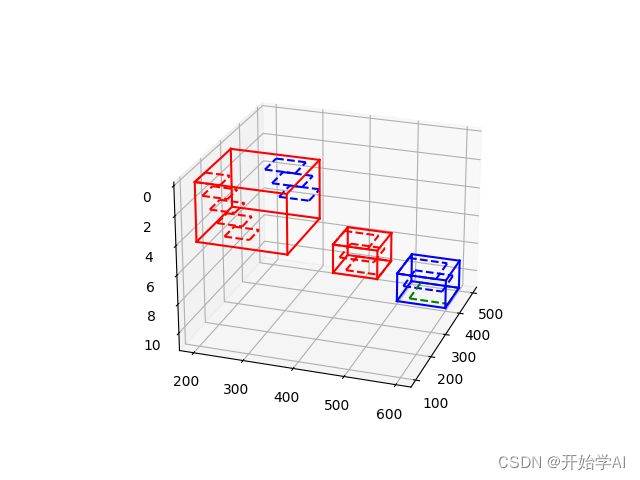
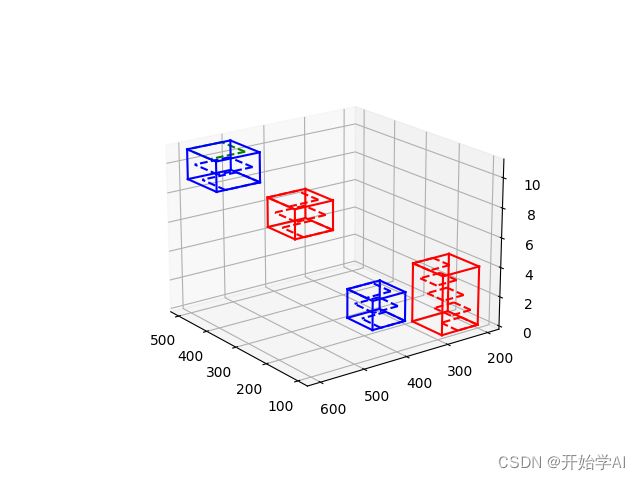
假如有以下几类框
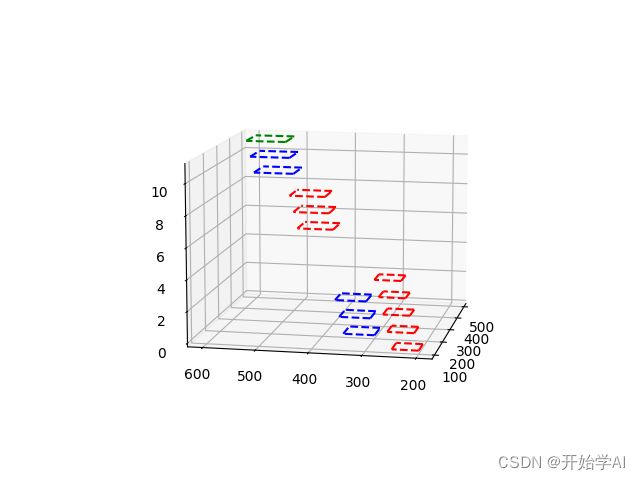
最终聚类效果: