梯度下降算法
梯度下降算法可以由如下图示表示:
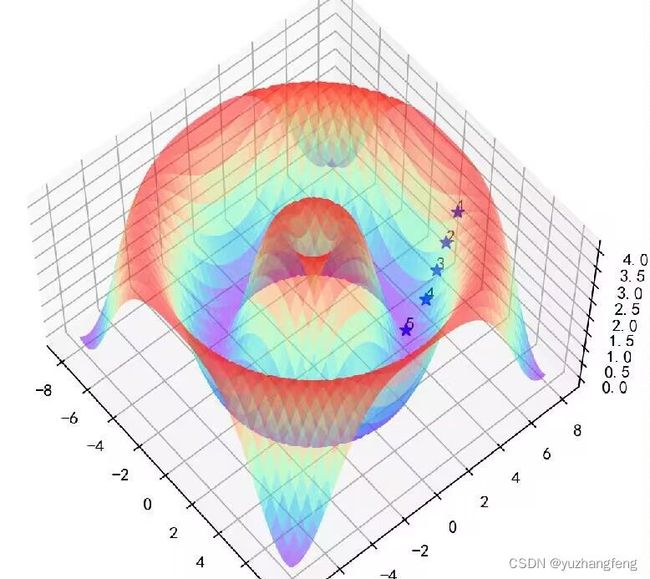
在下列各个二元函数中,请用代码实现梯度下降算法,写出在数值实验中使用的学习率大小,选取的迭代初始点。并最终给出函数值随迭代过程的变化图和梯度的轨迹图。
(1) f(x ,y ) = x 2 + 20y*2
(2) f(x ,y ) =x 2+ 20y2+0.01(x2 +y2 )2
(3) f(x ,y ) =x 2+0.01(x2 +y2 )2
(4) f(x ,y ) = x2 y2
(5) f(x ,y ) = (xy = 1)2
示例代码:
# -*-coding:utf-8-*-
import matplotlib.pyplot as plt
from mpl_toolkits.mplot3d import Axes3D
import numpy as np

def loss(x1, x2):
    return x1 ** 2 + 20 * x2 ** 2

def gradient(x1, x2):
    x1_grad = 2 * x1
    x2_grad = 40 * x2
    return x1_grad, x2_grad

def BGD(a):
    change_rate = a
    x1,x2=0.0001,0.00001

    print('初始参数x1= {} '.format(x1))
    print('初始参数x2= {} '.format(x2))
    end = 10 ** (-10)
    times = 0
    x1_list = [x1]
    x2_list = [x2]
    time_list = [0]
    loss_list = [loss(x1, x2)]
    while True:
        temp1 = change_rate * gradient(x1, x2)[0]
        x1 -= temp1
        temp2 = change_rate * gradient(x1, x2)[1]
        x2 -= temp2
        x1_list.append(x1)
        x2_list.append(x2)
        time_list.append(times)
        loss_list.append(loss(x1, x2))
        times += 1
        if abs(temp1) < end and abs(temp2) < end:
            break
    return x1_list, x2_list, loss_list, time_list

def LookforPoint(list1,point):
    length1 = len(list1)
    index1 = 0
    temp = 100000
    for i in range(length1):
        if abs(list1[i] - point) < temp:
            temp = list1[i] - point
            index1 = i
    return index1

if __name__ == '__main__':
    a = 0.01 # 学习率
    x1_list, x2_list, loss_list, time_list = BGD(a)
    print('共迭代{}次'.format(len(time_list)))
    print('迭代后的x1={}'.format(x1_list[len(x1_list) - 1]))
    print('迭代后的x2={}'.format(x2_list[len(x2_list) - 1]))
    fig, ax1 = plt.subplots()
    ax1.plot(time_list, x1_list)
    ax1.set_xlabel("迭代次数")
    ax1.set_ylabel("变化情况")
    ax1.plot(time_list, x2_list)
    ax1.set_xlabel("迭代次数")
    ax2 = ax1.twinx()
    ax2.plot(time_list, loss_list)
    ax2.set_ylabel("函数情况")
    fig.legend(["x1参数变化", "x2参数变化", "loss函数变化"])
    plt.legend()

    plt.rcParams['font.sans-serif'] = 'SimHei'
    plt.rcParams['axes.unicode_minus'] = False
    fig = plt.figure()
    ax = Axes3D(fig)
    xx1, xx2 = np.meshgrid(np.arange(-8, 8, 0.1), np.arange(-8, 8, 0.1))  # 网格坐标
    z = np.array(loss(xx1, xx2))
    ax.plot_surface(xx1, xx2, z, cmap='rainbow', alpha=0.5)
    ax.view_init(60, -40)  # 观察角度

    xx1, xx2 = np.array(x1_list), np.array(x2_list)
    z = np.array(loss(xx1, xx2))
    k = 0
    length = len(xx1)

    num = loss_list[0] - loss_list[length-1]
    num1 = num/2+loss_list[length-1]
    num2 = num1-num/4  # 上四分位数
    num3 = num1+num/4  # 下四分位数
    point1 = LookforPoint(loss_list, num1)  # 找到最接近二分位数的那个点
    point2 = LookforPoint(loss_list, num2)  # 找到最接近上四分位数的那个点
    point3 = LookforPoint(loss_list, num3)  # 找到最接近下四分位数的那个点

    for i in range(length):
        if i == 0 or i == point1 or i == point2 or i == point3 or i == length-1:  # 要展示的五个点
            ax.scatter(xx1[i], xx2[i], loss_list[i], marker='*', color='blue', s=50, alpha=1)
            j = [1, 2, 3, 4, 5]  # 为路径添加标签
            ax.text(xx1[i], xx2[i], loss_list[i], j[k])
            k += 1
            plt.pause(1)   # 可以实现动态的生成点的过程
    res = z[len(xx1) - 1]  # 局部最优解
    print('局部最优解是 {} '.format(res))
    ax.set_xlabel('x1')
    ax.set_ylabel('x2')
    ax.set_zlabel('f(x1,x2)')
    plt.show()
