计算矩阵内部每一行(列)的余弦相似度
文章目录
- 前言
- 一、从matlab获取mat数据
- 二、计算余弦相似度
- 三、输出
- 四、热力图输出
前言
方法有多种,介绍一种能用的就可以。
一、从matlab获取mat数据
下面的代码模拟生成和读取mat数据。
import numpy as np
from scipy import io

A =  np.array([[12,11,50,31,22,22], [40, 32, 31,22,21, 11],[11,14,11,10, 11, 10],[11,14,11,10, 11, 10]])
io.savemat('data.mat', {'hello': A})
mymat= io.loadmat("data.mat")['hello']
mymat
二、计算余弦相似度
from sklearn.metrics.pairwise import cosine_similarity
from scipy import sparse

# A =  np.array([[0, 1, 0, 0, 1], [0, 0, 1, 1, 1],[1, 1, 0, 1, 0]])
# print(type(A))
# print((A))
A_sparse = sparse.csr_matrix(mymat)  #从mat文件中读取数据

A_sparse=A_sparse.transpose()   #行列转置 看个人需求

similarities = cosine_similarity(A_sparse)
print('pairwise dense output:\n {}\n'.format(similarities))

#also can output sparse matrices
similarities_sparse = cosine_similarity(A_sparse,dense_output=False)
print('pairwise sparse output:\n {}\n'.format(similarities_sparse))
三、输出
pairwise dense output:
 [[1.         0.98446865 0.76774014 0.81439526 0.8841379  0.73077622]
 [0.98446865 1.         0.77545739 0.83328966 0.9124285  0.78573583]
 [0.76774014 0.77545739 1.         0.9934835  0.95872712 0.96204378]
 [0.81439526 0.83328966 0.9934835  1.         0.98445528 0.9767545 ]
 [0.8841379  0.9124285  0.95872712 0.98445528 1.         0.96466882]
 [0.73077622 0.78573583 0.96204378 0.9767545  0.96466882 1.        ]]

pairwise sparse output:
   (0, 5)	0.7307762238877994
  (0, 4)	0.8841379042387743
  (0, 3)	0.8143952590431665
  (0, 2)	0.7677401391412543
  (0, 1)	0.9844686507098362
  (0, 0)	0.9999999999999998
  (1, 5)	0.7857358318620093
  (1, 4)	0.9124285041778671
  (1, 3)	0.8332896610154389
  (1, 2)	0.7754573891609549
  (1, 1)	1.0
  (1, 0)	0.9844686507098362
  (2, 5)	0.9620437804268083
  (2, 4)	0.9587271244148624
  (2, 3)	0.9934835000789072
  (2, 2)	1.0000000000000002
  (2, 1)	0.7754573891609549
  (2, 0)	0.7677401391412543
  (3, 5)	0.976754498131229
  (3, 4)	0.9844552767199803
  (3, 3)	1.0000000000000002
  (3, 2)	0.9934835000789072
  (3, 1)	0.8332896610154389
  (3, 0)	0.8143952590431665
  (4, 5)	0.9646688225977327
  (4, 4)	0.9999999999999999
  (4, 3)	0.9844552767199803
  (4, 2)	0.9587271244148624
  (4, 1)	0.9124285041778671
  (4, 0)	0.8841379042387743
  (5, 5)	1.0
  (5, 4)	0.9646688225977327
  (5, 3)	0.976754498131229
  (5, 2)	0.9620437804268083
  (5, 1)	0.7857358318620093
  (5, 0)	0.7307762238877994
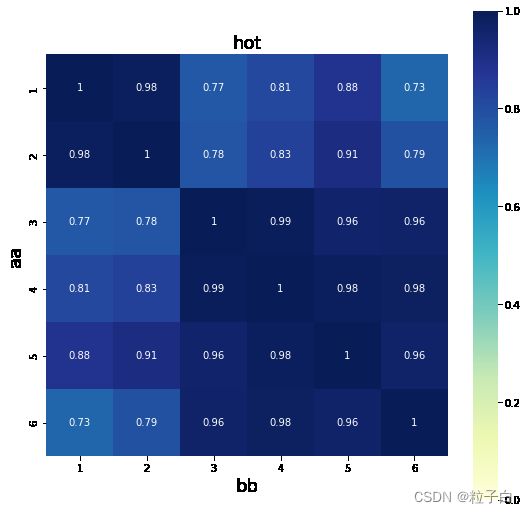
四、热力图输出
import seaborn as sns
import numpy as np
import pandas as pd
import matplotlib.pyplot as plt
a = similarities
fig, ax = plt.subplots(figsize = (9,9))
#二维的数组的热力图,横轴和数轴的ticklabels要加上去的话,既可以通过将array转换成有column
#和index的DataFrame直接绘图生成,也可以后续再加上去。后面加上去的话,更灵活,包括可设置labels大小方向等。
sns.heatmap(pd.DataFrame(np.round(a,6), columns = ['1', '2', '3','4','5','6'], index = range(1,7)),
                annot=True, vmax=1,vmin = 0, xticklabels= True, yticklabels= True, square=True, cmap="YlGnBu")
#sns.heatmap(np.round(a,2), annot=True, vmax=1,vmin = 0, xticklabels= True, yticklabels= True,
#            square=True, cmap="YlGnBu")
ax.set_title('hot', fontsize = 18)
ax.set_ylabel('aa', fontsize = 18)
ax.set_xlabel('bb', fontsize = 18) #横变成y轴,跟矩阵原始的布局情况是一样的
