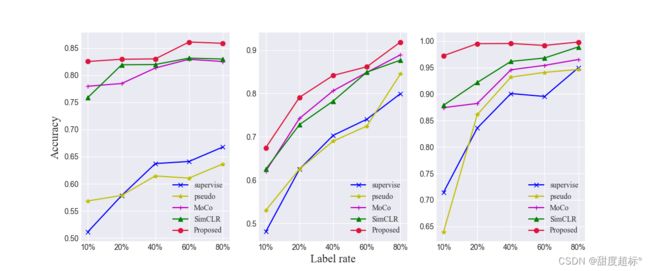
matplotlib在一张图上绘制包含多条折线的多个子图
matplotlib在一张图上绘制包含多条折线的多个子图
- 问题描述
- 解决办法
问题描述
实验用了多个数据集,并且用了多种对比实验的方法,想把结果展示在一张图上,就需要在一个图上画多个折线图,并且需要在一张大图上绘制多个小图。
解决办法
import matplotlib.pyplot as plt
from matplotlib.pyplot import MultipleLocator

plt.style.use("seaborn-darkgrid")

labels = ['10%','20%' ,'40%','60%','80%']

a0 = [0.5,0.5,0.6,0.6,0.6]
b0 = [0.56,0.57,0.61,0.6,0.634]
c0 = [0.78,0.78,0.84,0.824,0.853]
d0 = [0.72,0.8,0.818,0.8,0.8]
e0 = [0.8,0.8,0.8,0.863,0.89]


a1 = [0.48,0.62,0.7,0.7,0.796]
b1 = [0.53,0.62,0.69,0.72,0.84]
c1 = [0.6,0.7,0.8,0.8,0.8]
d1 = [0.62,0.72,0.7,0.8,0.8]
e1 = [0.68,0.7,0.86,0.86,0.98]


a2 = [0.76,0.83,0.90,0.84,0.94]
b2 = [0.64,0.81,0.99,0.99,0.94]
c2 = [0.83,0.82,0.94,0.91,0.91]
d2 = [0.88,0.98,0.96,0.9,0.99]
e2 = [0.97,0.99,0.99,0.99,0.982]

#设置图例并且设置图例的字体及大小
font1 = {'family': 'Times New Roman', 'weight': 'normal', 'size': 10}
font2 = {'family': 'Times New Roman', 'weight': 'normal', 'size': 15}
plt.xticks(fontproperties = 'Times New Roman',fontsize=10)
plt.yticks(fontproperties = 'Times New Roman',fontsize=10)

fig = plt.figure(figsize=(12,5))


#mfpt
p0 = fig.add_subplot(131)
p0.plot(labels, a0, c='blue', marker='x', linestyle='-', label='supervise')
p0.plot(labels, b0, c='y', marker='*', linestyle='-', label='pseudo')
p0.plot(labels, c0, c='m', marker='+', linestyle='-', label='MoCo')
p0.plot(labels, d0, c='g', marker='^', linestyle='-', label='SimCLR')
p0.plot(labels, e0, c='Crimson', marker='o', linestyle='-', label='Proposed')
# plt.xlabel(u'Label rate', font1)
plt.ylabel(u'Accuracy', font2)


#pu
p1 = fig.add_subplot(132)
p1.plot(labels, a1, c='blue', marker='x', linestyle='-', label='supervise')
p1.plot(labels, b1, c='y', marker='*', linestyle='-', label='pseudo')
p1.plot(labels, c1, c='m', marker='+', linestyle='-', label='MoCo')
p1.plot(labels, d1, c='g', marker='^', linestyle='-', label='SimCLR')
p1.plot(labels, e1, c='Crimson', marker='o', linestyle='-', label='Proposed')
plt.xlabel(u'Label rate', font2)
# plt.ylabel(u'Accuracy', font1)

#seu
p2 = fig.add_subplot(133)
p2.plot(labels, a2, c='blue', marker='x', linestyle='-', label='supervise')
p2.plot(labels, b2, c='y', marker='*', linestyle='-', label='pseudo')
p2.plot(labels, c2, c='m', marker='+', linestyle='-', label='MoCo')
p2.plot(labels, d2, c='g', marker='^', linestyle='-', label='SimCLR')
p2.plot(labels, e2, c='Crimson', marker='o', linestyle='-', label='Proposed')


# plt.xlabel(u'Label rate', font1)
# plt.ylabel(u'Accuracy', font1)

# 图例展示位置,数字代表第几象限
p0.legend(loc=4, prop=font1)
p1.legend(loc=4, prop=font1)
p2.legend(loc=4, prop=font1)
# Axes(ax)对象,主要操作两个坐标轴间距
# x_major_locator = MultipleLocator(0.05)
ax = plt.gca()
# ax.xaxis.set_major_locator(x_major_locator)


plt.show()
颜色代码
绘制折线图
绘制多个子图
