实录分享 | 使用Prometheus和Grafana监控Alluxio运行状况

欢迎来到【微直播间】,2min纵览大咖观点
本次分享主要包括三个方面:
- Prometheus&Grafana简介
- 环境搭建
- 手动调优
一、 Prometheus&Grafana简介
关于Prometheus:
Prometheus 是一个开源的完整监控解决方案,其对传统监控系统的测试和告警模型进行了彻底的颠覆,形成了基于中央化的规则计算、统一分析和告警新模型。
关于Grafana:
Grafana是一款采用Go语言编写的开源应用,主要用于大规模指标数据的可视化展现,是网络架构和应用分析中最流行的时序数据展示工具,目前已经支持绝大部分常用的时序数据库。
二、环境搭建
为了确保Alluxio的最佳性能和可用性,建立一个强大的监控系统至关重要,基于监控系统我们能够迅速发现系统问题并优化资源利用。后面会逐步介绍如何配置Prometheus和Grafana监控Alluxio,详细的解决方案可见下方直播视频。
1. 前置条件:安装Alluxio,同时将Presto与Alluxio共同运行;
2. 配置Prometheus Server;
3. 启动Prometheus Server;
4. Prometheus UI;
5. 配置Grafana;
6. 启动Grafana;
7. 为Grafana配置数据源;
8. 配置 Alluxio 监控;
9. 关闭监控软件。
三、手动调优
√ 修改Dashboard
以上仅为大咖演讲概览,完整内容点击视频观看:

(点击链接即可观看) https://app.ma.scrmtech.com/meetings/MeetingPc/Detail?pf_uid=27086_2062&sid=79796&source=2&pf_type=3&channel_id=26821&channel_name=Alluxio+%E5%BE%AE%E4%BF%A1%E6%9C%8D%E5%8A%A1%E5%8F%B7&tag_id=31713a81002af612&id=79796
附件:大咖分享文字版完整内容可见下文
本文将和大家分享Prometheus和Grafana 测试环境搭建、监控Alluxio数据到性能调优等方面,帮助大家快速上手用Prometheus和Grafana监控Alluxio。
一、Prometheus简介
Prometheus 是一个开源的完整监控解决方案,其对传统监控系统的测试和告警模型进行了彻底颠覆,形成了基于中央化的规则计算、统一分析和告警新模型。
【关键组件】:
Prometheus Server: 主服务器,负责收集和存储时间序列数据,包含存储引擎和计算引擎。Prometheus通过端口将数据拉取并存储,形成时间序列数据。
Prometheus优势
1. 易于管理:
Prometheus 核心部分只有一个单独的二进制文件,不存在任何的第三方依赖。可以在任何环境搭建我们的监控系统。
2. 强大的数据模型:
所有采集的监控数据均以指标(metric)的形式保存在内置的时间序列数据库当中。
3. 强大的查询语言 PromQL
Prometheus 内置了一个强大的数据查询语言PromQL,可以实现对监控数据的查询、聚合,也可应用于数据可视化应用(如 Grafana)以及告警当中。
Prometheus UI
下面是Prometheus监控的图,Prometheus监控着多种进程。

二、Grafana简介
Grafana是一款采用Go语言编写的开源应用,主要用于大规模指标数据的可视化展现,是网络架构和应用分析中最流行的时序数据展示工具,目前已经支持绝大部分常用的时序数据库。在Grafana中,我们可以使用Prometheus采集的数据,用PromQL筛选出所需的数据,在Web UI界面可绘制种类丰富的图像,如折线图、柱状图、热图等。
Grafana绘制CPU图、JVM图来监控CPU和JVM信息。
Grafana Web UI

Alluxio监控架构
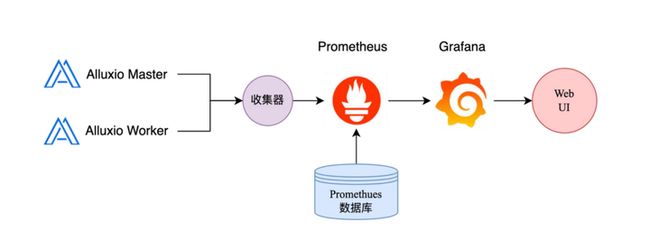
Prometheus收集Alluxio Master、Alluxio Worker等进程的信息,存储到Prometheus数据库中;Grafana收集数据,配合PromQL语言,在Web UI界面展示。
三、环境搭建
前置条件
1. 电脑上应已安装好Alluxio。如果没有安装,可编译Alluxio源代码或在本地下载Alluxio程序。
2. 在将 Presto 与 Alluxio 一起运行前,请参照Deploying Presto部署Presto,并配置Presto和Alluxio共同运行。
配置Prometheus Server
下载Prometheus Server(如 prometheus-2.37.5.linux-amd64.tar.gz),解压Prometheus并编辑prometheus.yml文件配置Prometheus。
![]()
global: #全局参数启动Prometheus Server
nohup /prometheus --web.enable-admin-api --config.file=/prometheus.yml >/prometheus.log 2>&1 & 打开Prometheus的Web UI:http://
Prometheus UI

配置 Grafana
下载Grafana安装包,解压。

启动Grafana
启动Grafana并设置后台运行:
nohup /bin/grafana-server --homepath 为Grafana配置数据源
打开Grafana Web UI:http://
为Grafana配置 Prometheus 数据源(Prometheus数据库所在位置)
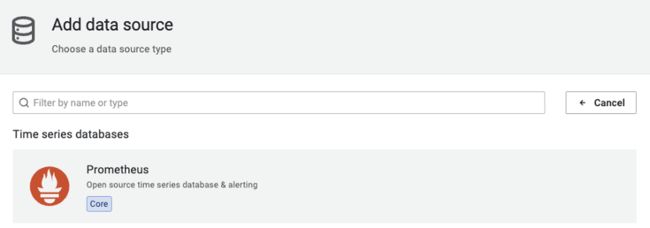
依次点击 Configuration - Data sources - Add data source,选择Prometheus获取数据。

找到并点击 Prometheus
配置 Prometheus Server 的 HTTP URL(Prometheus 默认端口号是 9090):

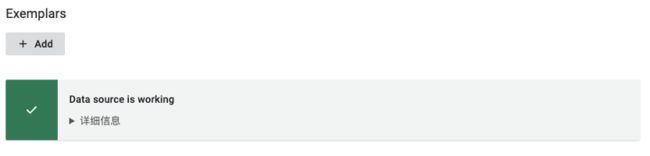
点击下方的 Save & test:

出现绿色的提示框,表示与 Prometheus 正常连通:
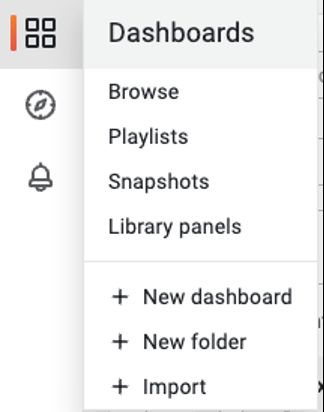
通过 Dashboards | Grafana Labs 网站,可以找到大量可直接使用的 Dashboard 模板。
点击 Dashboards -Import,可以导入 Dashboard 模板。
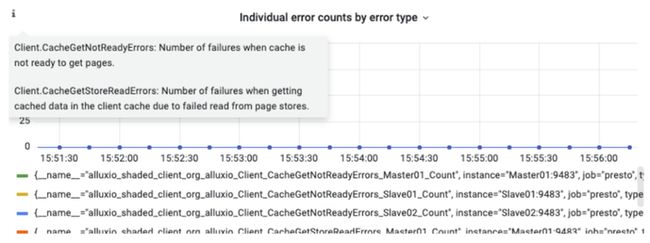
导入模版并打开对应的 Dashboard 后,用户可将鼠标悬浮至左上角 i 查看指标具体描述:
配置 Alluxio 监控
在Prometheus加入如下配置,替换端口号:
scrape_configs:
# 添加 Alluxio 的配置
- job_name: "alluxio master"
metrics_path: '/metrics/prometheus/'
static_configs:
- targets: [ ':' ] # 默认端口号是19999
- job_name: "alluxio worker"
metrics_path: '/metrics/prometheus/'
static_configs:
- targets: [ ':' ] # 默认端口号是30000
- job_name: "alluxio job master"
metrics_path: '/metrics/prometheus/'
static_configs:
- targets: [ ':' ] # 默认端口号是20002
- job_name: "alluxio job worker"
metrics_path: '/metrics/prometheus/'
static_configs:
- targets: [ ':' ] # 默认端口号是30003
- job_name: "alluxio standalone fuse"
metrics_path: '/metrics/prometheus/'
static_configs:
- targets: [ ':' ] # 默认端口号是 49999
下载 Alluxio 监控模板,导入 Grafana 的 Dashboard。
常见错误:某些图表显示No data。可以点进对应的图表,切换这里的Data source。

关闭监控软件
关闭 Prometheus Server
pgrep -f prometheus | xargs kill关闭 Pushgateway
pgrep -f pushgateway | xargs kill关闭 Grafana
pgrep -f grafana | xargs kil四、手动调优
修改Dashboard
√ 点击Add panel;
√ 可以增加一个新的panel,也可以增加一个新的row;

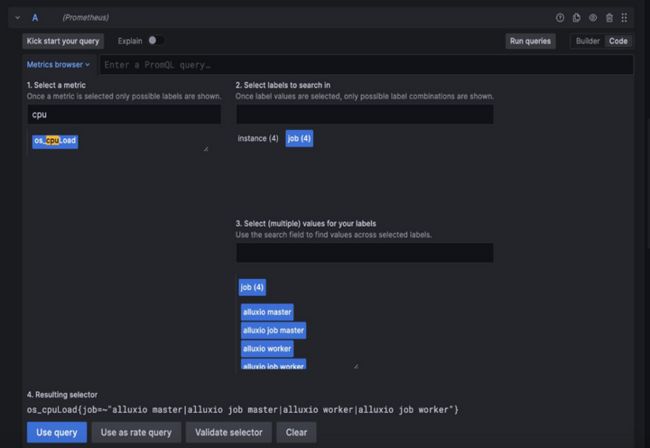
比如监控CPU:
√ 在左侧搜索cpu,找到对应指标;
√ 在右侧选择要监控的instance或job;
√ 点击下方 Use query。
√ 右侧可以调整图标的样式;
√ 可以为图表加标题和描述。

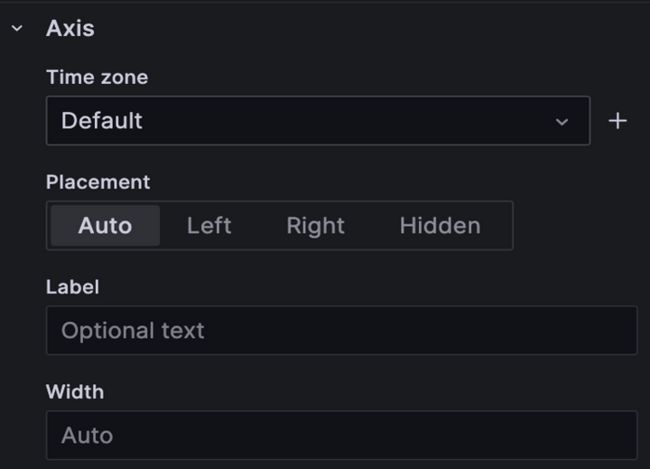
√ 调整坐标轴的名字及其单位;
√ 调整坐标轴的宽度等样式。
√ 调整图表的样式,线图、柱状图、点图;
√ 调整图标的内部样式。

依次点击 Inspect ->Data

√ 由于一个 Panel 中有多个监控指标,可以在左侧选择要导出的监控指标(或 Series joined bytime 选择所有指标);
√ 点击右侧 DownloadCSV 下载数据。

点击保存

导出模板

总结
通过引入 Prometheus 和 Grafana,我们为 Alluxio 构建了一个更加灵活、敏捷、易用的监控系统。
Alluxio的指标多而全面,而不同用户群体关心不同的指标,因此我们介绍了如何搭建适合用户所需应用场景的Dashboard,并且可以导出数据、导出Dashboard模板,方便迁移。
想要了解更多关于Alluxio的干货文章、热门活动、专家分享,可点击进入:【Alluxio智库】https://link.zhihu.com/?target=https%3A//page.ma.scrmtech.com/landing-page/index%3Fpf_uid%3D27086_2062%26id%3D13197