Python3-excel文档操作(六):利用openpyxl库处理excel表格:Excel可视化,折线图
1.简介:
本篇介绍openpyxl库可视化在Excel中,折线图的展示。
2.举例:
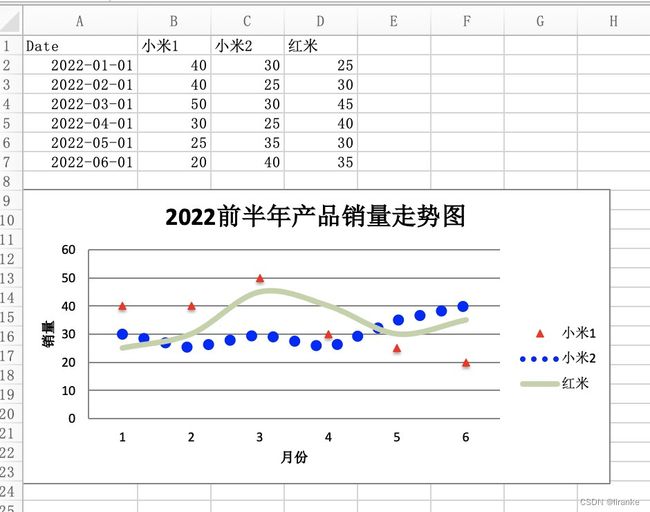
公司“2022前半年产品销量走势图” 的折线图展示:
相关代码如下:
openxls_axis.py:
import os
import sys

from datetime import date

from openpyxl import Workbook
from openpyxl.chart import LineChart, Reference
from openpyxl.chart.axis import DateAxis

#初始化Workbook
wb = Workbook(write_only=True)
ws = wb.create_sheet()

ws = wb.active

#创建数据
rows = [
    ['Date', '小米1', '小米2', '红米'],
    [date(2022,1,1), 40, 30, 25],
    [date(2022,2,1), 40, 25, 30],
    [date(2022,3,1), 50, 30, 45],
    [date(2022,4,1), 30, 25, 40],
    [date(2022,5,1), 25, 35, 30],
    [date(2022,6,1), 20, 40, 35],
]

#添加数据到excel
for row in rows:
    ws.append(row)

# 建立折线图
chart = LineChart()
chart.title = "2022前半年产品销量走势图"
chart.style = 13
chart.y_axis.title = '销量'
chart.x_axis.title = '月份'

# 参照值
data = Reference(ws, min_col=2, min_row=1, max_col=4, max_row=7)
chart.add_data(data, titles_from_data=True)

#line1
s1 = chart.series[0]
s1.marker.symbol = "triangle" # 三角形
s1.marker.graphicalProperties.solidFill = "FF1100" # 填满颜色
s1.marker.graphicalProperties.line.solidFill = "FF1100" # 外框线条颜色
s1.graphicalProperties.line.noFill = True

#line2
s2 = chart.series[1]
s2.graphicalProperties.line.solidFill = "111111"
s2.graphicalProperties.line.dashStyle = "sysDot"
s2.graphicalProperties.line.width = 100050 # 线条宽度,单位为 EMUs

#line3
s3 = chart.series[2]
s2.graphicalProperties.line.solidFill = "1111FF"
s3.smooth = True # 让线条平滑

#添加
ws.add_chart(chart, "A9")

#保存文件
wb.save("xiaomi_line.xlsx")
运行效果:
% python3 openxls_axis.py
结果:会生成xiaomi_line.xlsx文件。
xiaomi_line.xlsx文件内容:
说明:
(1)chart = LineChart(): 创建折线图chart;它的常用属性和方法:
chart.title:标题
chart.y_axis.title:y坐标的标题
chart.x_axis.title:x坐标的标题chart.add_data:添加数据
(2)chart.series[0]: 折线图中的线条,其常用的属性和方法:
s1.marker.symbol: 线条形状:
triangle:三角形
s3.smooth:线条是否平滑
3 openpyxl库常用的图形类型:
Area Charts: 面积图
Bar and Column Charts : 转置直方图
Bubble Charts:气泡图
Line Charts: 直线图
Scatter Charts: 散点图
Pie Charts: 饼状图
Doughnut Charts: 环形图
Radar Charts: 雷达图
Stock Charts: 股票趋势图
Surface Charts:曲面图
column: 柱状图
