Python数据处理之Pandas库
文章目录
- 一、创建对象与取值
-
- 1.1 Series对象(一维)
-
- 1.1.1 创建
- 1.1.2 取值与选择
- 1.2 DataFrame对象(二维)
-
- 1.2.1 创建
- 1.2.2 取值与选择
- 1.3 Index对象(不可变数组)
-
- 1.3.1 交并异或
- 二、处理缺失值
-
- 2.1 Pandas的缺失值
-
- 2.1.1 python对象类型的缺失值
- 2.1.2 数值类型的缺失值NaN:不是一个数字
- 2.1.3 Pandas中NaN与None的差异
- 2.2 处理缺失值
-
- 2.2.1 发现缺失值
- 2.2.2 剔除缺失值
- 2.2.3 填充缺失值
- 三、运算
-
- 3.1 Series
-
- 3.1.1 索引对齐
- 3.1.2 去除NaN
- 3.2 DataFrame
- 3.3 DataFrame与Series运算
- 四、层级索引
-
- 4.1 多级索引Series
-
- 4.1.1 笨方法
- 4.1.2 好方法:Pandas多级索引
- 4.1.3 高维数据的多级索引
- 4.2 多级索引的创建方法
-
- 4.2.1 显示地创建多级索引
- 4.2.2 多级索引的等级名称
- 4.2.3 多级列索引
- 4.3 多级索引的取片与切片
-
- 4.3.1 Series多级索引
- 4.3.2 DataFrame多级索引
- 4.4 多级索引行列转换
-
- 4.4.1 有序的索引和无序的索引
- 4.4.2 索引stack与unstack
- 4.4.3 索引的设置与重置
- 4.5 多级索引的数据累计方法
- 五、合并数据集
-
- 5.1 Concat与Append操作
-
- 5.1.1 pd.concat(索引重复)
- 5.1.2 append()方法
- 5.2 合并数据集:合并(merge)与连接(join)
-
- 5.2.1 数据连接类型(pd.merge)(一对一,多对一,多对多)
- 5.2.2 设置数据合并的键
- 5.2.3 设置数据连接的集合操作规则
- 5.2.4 重复列名:suffixes参数
- 六、累计与分组
-
- 6.1 行星数据
- 6.2 pandas简单累计功能
- 6.3 GroupBy:分组、累计与组合
-
- 6.3.1 GroupBy对象
- 6.3.2 累计、过滤、转换、应用
- 6.3.3 设置分割的键
- 七、数据累计分析
-
- 7.1 演示数据透视表
- 7.2 手工制作数据透视表
- 7.3 数据透视表语法
-
- 7.3.1 多级数据透视表
- 7.3.2 其他数据透视表选项
- 八、读写文件操作
-
- 8.1 写入文件
-
- 8.1.1 写入单个sheet
- 8.1.2 写入多个sheet
- 8.1.3 新增一个sheet
- 8.1.4 表格追加数据
- 8.2 读取数据
-
- 8.2.1 读取CSV表格数据
- 8.2.2 读取Excel表格数据
- 九、处理时间序列
-
- 9.1 日期与时间工具
-
- 9.1.1 Python的日期与时间工具:datetime与dateutil
- 9.1.2 Numpy的日期与时间工具
- 9.1.3 pandas的日期与时间工具:理想与现实的最佳解决方案
- 9.2 pandas时间序列:用时间作索引
- 9.3 pandas时间序列:创建
- 9.4 时间频率与偏移量
- 十、字符串操作
-
- 10.1 Pandas字符串操作简介
- 10.2 Pandas字符串方法列表
-
- 10.2.1 与Python字符串方法类似的方法
- 10.2.2 使用正则表达式的方法
- 10.2.3 其他字符串方法
一、创建对象与取值
1.1 Series对象(一维)
1.1.1 创建
Numpy与Series区别是,numpy是隐试定义索引获取数值,Series是显示定义索引获取数值
pd.Series(data, index=index)第二个参数可省
数据为数组
import pandas as pd

data = pd.Series([0.25,0.5,0.75,1.0])
print(data)
'''
0    0.25
1    0.50
2    0.75
3    1.00
dtype: float64
'''

data = pd.Series([0.25,0.5,.75,1.0], index=['a','b','c','d'])
print(data)
'''
a    0.25
b    0.50
c    0.75
d    1.00
dtype: float64
'''

index = [('California',2000),('California',2010),('New York',2000),('New York', 2010)]
populations = [11111,22222,33333,44444]
pop = pd.Series(populations, index=index)
print(pop)
'''
(California, 2000)    11111
(California, 2010)    22222
(New York, 2000)      33333
(New York, 2010)      44444
dtype: int64
'''
数据为标量
import pandas as pd

data = pd.Series(5,index=[100,200,300]);
print(data)
'''
100    5
200    5
300    5
dtype: int64
'''
数据为字典
import pandas as pd

po = pd.Series({'aa':123,'bb':456,'cc':789})
print(po)
'''
aa    123
bb    456
cc    789
dtype: int64
'''

data = pd.Series({2:'a',1:'b',3:'c'}, index=[3,2])
print(data)
'''
3    c
2    a
dtype: object
'''
1.1.2 取值与选择
| data.values | 值 |
| data.index | 索引序列 |
| data.keys() | 同上 |
属性
import pandas as pd

data = pd.Series([0.25,0.5,.75,1.0], index=['a','b','c','d'])
print('a' in data)    # True
print(data.index)     # Index(['a', 'b', 'c', 'd'], dtype='object')
print(data.keys())    # 同上
print(data.values)    # [0.25 0.5  0.75 1.  ]
print(list(data.items())) # [('a', 0.25), ('b', 0.5), ('c', 0.75), ('d', 1.0)]
添加、修改数据
import pandas as pd

data = pd.Series([0.25,0.5,.75,1.0], index=['a','b','c','d'])
# 添加
data['e']=1.25
print(data)
'''
a    0.25
b    0.50
c    0.75
d    1.00
e    1.25
dtype: float64
'''
# 修改
data['a'] = 1.5
print(data)
'''
a    1.50
b    0.50
c    0.75
d    1.00
e    1.25
dtype: float64
'''
索引
import pandas as pd

data = pd.Series([0.25,0.5,.75,1.0], index=['a','b','c','d'])
print(data[1])        # 0.5
print(data['b'])      # 0.5
print(data['a':'c'])
'''
a    0.25
b    0.50
c    0.75
dtype: float64
'''
print(data[0:2])
'''
a    0.25
b    0.50
dtype: float64
'''
print(data[(data>0.3)&(data<0.8)])
'''
b    0.50
c    0.75
dtype: float64
'''
print(data[['a','d']])
'''
a    0.25
d    1.00
dtype: float64
'''
loc、iloc
注意数组索引区别
import pandas as pd

data = pd.Series(['a','b','c'],index=[1,3,5])
print(data)
'''
1    a
3    b
5    c
dtype: object
'''
print(data[1])# a
print(data[1:3])
'''
3    b
5    c
dtype: object
'''
print(data.loc[1]) # a
print(data.loc[1:3])
'''
1    a
3    b
dtype: object
'''
print(data.iloc[1])   # b
print(data.iloc[1:3])
'''
3    b
5    c
dtype: object
'''
1.2 DataFrame对象(二维)
1.2.1 创建
创建单列
import pandas as pd

ages = {'Li':15,
        'Liu':26,
        'Wan':19}
age = pd.Series(ages)
print(pd.DataFrame(age,columns=['age']))
'''
     age
Li    15
Liu   26
Wan   19
'''
通过字典创建
import pandas as pd

data = [{'a': 0, 'b': 0}, {'a': 1, 'b': 2}, {'a': 2, 'b': 4}]
print(pd.DataFrame(data))
'''
   a  b
0  0  0
1  1  2
2  2  4
'''
缺失用NaN表示
import pandas as pd

print(pd.DataFrame([{'a':1,'b':2}, {'c':3,'d':4}]))
'''
     a    b    c    d
0  1.0  2.0  NaN  NaN
1  NaN  NaN  3.0  4.0
'''
通过Series字典创建
import pandas as pd

age = pd.Series({'Li':15,'Liu':26,'Wan':19})
score = pd.Series({'Li':80,'Liu':88,'Wan':92})
stu = pd.DataFrame({'age':age,'score':score})
print(stu)
'''
     age  score
Li    15     80
Liu   26     88
Wan   19     92
'''
通过Numpy二维数组创建
import pandas as pd

print(pd.DataFrame(np.random.rand(3,2), columns=['foo','bar'], index=['a','b','c']))
'''
        foo       bar
a  0.321252  0.393929
b  0.006765  0.450808
c  0.783284  0.667144
'''
通过Numpy结构化数组创建
import pandas as pd

a = np.zeros(3,dtype=[('a','i8'),('b','f8')])
print(a)  # [(0, 0.) (0, 0.) (0, 0.)]
print(pd.DataFrame(a))
'''
   a    b
0  0  0.0
1  0  0.0
2  0  0.0
'''
1.2.2 取值与选择
| stu.index | 获取索引标签 | 单列或多列 |
| stu.columns | 存放标签的index对象 | 多列 |
print(stu)
'''
     age  score
Li    15     80
Liu   26     88
Wan   19     92
'''
# index获取索引标签
print(stu.index)   # Index(['Li', 'Liu', 'Wan'], dtype='object')
# 存放标签的index对象
print(stu.columns) # Index(['age', 'score'], dtype='object')
print(stu['age']['Li'])  # 15
print(stu.values[0])  # [15 80]
print(stu['age'])
'''
Li     15
Liu    26
Wan    19
Name: age, dtype: int64
'''
print(stu.age)
'''
Li     15
Liu    26
Wan    19
Name: age, dtype: int64
'''
# 如果列名不是纯字符串,或者列名与DataFrame的方法名相同,就不能用属性索引
print(stu.age is stu['age'])  # True
print(stu.iloc[:2,:1])
'''
     age
Li    15
Liu   26
'''
print(stu['Li':'Wan'])
'''
     age  score
Li    15    100
Liu   26     88
Wan   19     92
'''
print(stu[1:3])
'''
     age  score
Liu   26     88
Wan   19     92
'''
print(stu[stu.age>20])
'''
     age  score
Liu   26     88
'''
print(stu.loc[:'Liu',:'age'])
'''
     age
Li    15
Liu   26
'''
# 避免对属性的形式选择的列直接赋值,可以stu['age']=z,不要用stu.age=z
stu['a']=stu['age']/stu['score']
print(stu)
'''
     age  score         a
Li    15     80  0.187500
Liu   26     88  0.295455
Wan   19     92  0.206522
'''
print(stu.T)
'''
            Li        Liu        Wan
age    15.0000  26.000000  19.000000
score  80.0000  88.000000  92.000000
a       0.1875   0.295455   0.206522
'''
修改值
print(stu)
'''
     age  score
Li    15     80
Liu   26     88
Wan   19     92
'''

stu.iloc[0,1] = 100
print(stu)
'''
     age  score
Li    15    100
Liu   26     88
Wan   19     92
'''
1.3 Index对象(不可变数组)
该对象是一个不可变数组或有序集合
import pandas as pd

ind = pd.Index([2,3,5,7,11])
print(ind)  # Int64Index([2, 3, 5, 7, 11], dtype='int64')
print(ind[1])  # 3
print(ind[1:3])  # Int64Index([3, 5], dtype='int64')
print(ind.size,ind.shape,ind.dtype)  # 5 (5,) int64
1.3.1 交并异或
import pandas as pd

a = pd.Index([1,3,5,7,9])
b = pd.Index([2,3,5,6])
print(a&b)  # Int64Index([3, 5], dtype='int64')
print(a|b)  # Int64Index([1, 2, 3, 5, 6, 7, 9], dtype='int64')
print(a^b)  # Int64Index([1, 2, 6, 7, 9], dtype='int64')
二、处理缺失值
选择缺失值处理方法:覆盖全局掩码表示缺失值(额外存储和计算负担),标签值表示缺失值(额外CPU或GPU计算逻辑)
2.1 Pandas的缺失值
2.1.1 python对象类型的缺失值
None不能作为Numpy/Pandas的缺失值,只能用于’object’数组类型dtype=object表示Numpy认为这个数组是Python对象构成的,对于常用的快速操作,这种操作耗更多资源
import numpy as np

vals1 = np.array([1, None, 3, 4])
print(vals1)   # [1 None 3 4]
print(vals1.sum()) # 出错,Python中没有定义整数与None之间的运算
2.1.2 数值类型的缺失值NaN:不是一个数字
Numpy会为这个数组选择一个原生浮点类型,这会将数组编译成C代码从而实现快速操作
import numpy as np

vals2 = np.array([1, np.nan, 3, 4])
print(vals2.dtype)   # float64
print(vals2)   # [ 1. nan  3.  4.]
任何数字与NaN进行任何操作都会变成NaN
print(1+np.nan)  # nan
print(vals2.sum(),vals2.min(),vals2.max())   # nan nan nan
Numpy提供了一些特殊的累计函数,忽略NaN缺失值影响
print(np.nansum(vals2), np.nanmin(vals2), np.nanmax(vals2)) # 8.0 1.0 4.0
2.1.3 Pandas中NaN与None的差异
在适当的时候,Pandas会将NaN与None等价交换
import pandas as pd

print(pd.Series([1,np.nan,3,None]))
'''
0    1.0
1    NaN
2    3.0
3    NaN
dtype: float64
'''
Pandas会将没有标签值的数据类型自动转化为NaN
import pandas as pd

x = pd.Series([1,2],dtype=int)
print(x)
'''
0    1
1    2
dtype: int32
'''
x[0]=None
print(x)
'''
0    NaN
1    2.0
dtype: float64
'''
Pandas对不同类型缺失值的转换规则
| 类型 | 缺失值转换规则 | NA标签值 |
|---|---|---|
| floating浮点型 | 无变化 | np.nan |
| object对象类型 | 无变化 | None或np.nan |
| integer整数类型 | 强制转换为float64 | np.nan |
| boolean布尔类型 | 强制转换为object | None或np.nan |
2.2 处理缺失值
| 方法 | 说明 |
|---|---|
| isnull() | 创建一个布尔类型的掩码标签缺失值 |
| notnull() | 与isnull()操作相反 |
| dropna() | 返回一个剔除缺失值的数据 |
| fillna() | 返回一个填充了缺失值的数据副本 |
| any() | 逐行检查是否有缺失值 |
2.2.1 发现缺失值
两种方法发现缺失值:isnull()和notnull(),返回布尔类型的掩码数据,该方法两对象都适用
import pandas as pd

data = pd.Series([1,np.nan,'hello',None])
print(data.isnull())
'''
0    False
1     True
2    False
3     True
dtype: bool
'''
print(data.notnull())
'''
0     True
1    False
2     True
3    False
dtype: bool
'''
import pandas as pd

df = pd.DataFrame([{'a':1,'b':2,'c':3}, {'b':2,'c':3,'d':4},{'a':2,'b':3,'d':4}])
print(df)
'''
     a  b    c    d
0  1.0  2  3.0  NaN
1  NaN  2  3.0  4.0
2  2.0  3  NaN  4.0
'''
print(df.isnull())
'''
       a      b      c      d
0  False  False  False   True
1   True  False  False  False
2  False  False   True  False
'''
每列逐行检查是否有缺失值
print(df.isnull().any())
'''
a     True
b    False
c     True
d     True
dtype: bool
'''
查看a列中缺失值的行
print(df[df['a'].isnull()])
'''
    a  b    c    d
1 NaN  2  3.0  4.0
'''
2.2.2 剔除缺失值
Series使用该方法简单
import pandas as pd

data = pd.Series([1,np.nan,'hello',None])
print(data.dropna())
'''
0        1
2    hello
dtype: object
'''
DataFrame需要一些参数,dropna()剔除整行或整列,默认为剔除整行,axis='colums’或axis=1剔除整列
import pandas as pd

df = pd.DataFrame([[1,np.nan,2],
                   [2,3,5],
                   [np.nan,4,6]])
print(df)
'''
     0    1  2
0  1.0  NaN  2
1  2.0  3.0  5
2  NaN  4.0  6
'''
# 剔除整行或整列,默认为剔除整行
print(df.dropna())
'''
     0    1  2
1  2.0  3.0  5
'''
print(df.dropna(axis=1)) # axis='colums'整列
'''
   2
0  2
1  5
2  6
'''
how和thresh参数可以设置剔除行或列缺失值的数量阈值
默认设置是how='any',即剔除整行或整列,(行列有axis参数决定)
how='all',剔除全部是缺失值的行或列
thresh参数设置行或列中非缺失值的最小数量
df[3]=np.nan
print(df)
'''
     0    1  2   3
0  1.0  NaN  2 NaN
1  2.0  3.0  5 NaN
2  NaN  4.0  6 NaN
'''
print(df.dropna(axis='columns',how='all'))
'''
     0    1  2
0  1.0  NaN  2
1  2.0  3.0  5
2  NaN  4.0  6
'''
# thresh参数设置行或列中非缺失值的最小数量
print(df.dropna(axis='rows',thresh=3))
'''
     0    1  2   3
1  2.0  3.0  5 NaN
'''
2.2.3 填充缺失值
method参数表示如何填充
method='ffill'用前面的填充后面的
method='bfill'用后面的填充前面的
import pandas as pd

data = pd.Series([1,np.nan,2,None,3],index=list('abcde'))
print(data)
'''
a    1.0
b    NaN
c    2.0
d    NaN
e    3.0
dtype: float64
'''
print(data.fillna(0))
'''
a    1.0
b    0.0
c    2.0
d    0.0
e    3.0
dtype: float64
'''
# 用前面的填充后面的,前面没有则仍然为缺失值
print(data.fillna(method='ffill'))
'''
a    1.0
b    1.0
c    2.0
d    2.0
e    3.0
dtype: float64
'''
# 用后面的填充前面的,后面没有则仍然为缺失值
print(data.fillna(method='bfill'))
'''
a    1.0
b    2.0
c    2.0
d    3.0
e    3.0
dtype: float64
'''
df = pd.DataFrame([[1,np.nan,2,np.nan],
                   [2,3,5,np.nan],
                   [np.nan,4,6,np.nan]])
print(df.fillna(method='ffill',axis=1))
'''
     0    1    2    3
0  1.0  1.0  2.0  2.0
1  2.0  3.0  5.0  5.0
2  NaN  4.0  6.0  6.0
'''
三、运算
| Python运算符 | Pandas方法 | |
|---|---|---|
| + | add() | a.add(b,fill_value=1),为NaN时加1 |
| - | sub()、subtract() | |
| * | mul()、multiply() | |
| / | truediv()、div()、divide() | |
| // | floordiv() | |
| % | mod() | |
| ** | pow() |
3.1 Series
import pandas as pd

a = pd.Series([1,2,3])
b = pd.Series([4,5,6])
print(a+b)
'''
0    5
1    7
2    9
dtype: int64
'''
3.1.1 索引对齐
NaN表示此处没有数
import pandas as pd

a = pd.Series([2,4,6],index=[0,1,2])
b = pd.Series([1,3,5],index=[1,2,3])
print(a+b)
'''
0    NaN
1    5.0
2    9.0
3    NaN
dtype: float64
'''
3.1.2 去除NaN
NaN不是想要的结果,用适当的对象方法代替运算符a.add(b)等价于a+b,也可自定义a或b缺失的数据
# 没有共同的加fill_value,即加0
print(a.add(b,fill_value=0))
'''
0    2.0
1    5.0
2    9.0
3    5.0
dtype: float64
'''
3.2 DataFrame
rng = np.random.RandomState(42)
A = pd.DataFrame(rng.randint(0,20,(2,2)),columns=list('AB'))
print(A)
'''
    A   B
0   6  19
1  14  10
'''
B = pd.DataFrame(rng.randint(0,10,(3,3)),columns=list('BAC'))
print(B)
'''
   B  A  C
0  7  4  6
1  9  2  6
2  7  4  3
'''
print(A+B)
'''
      A     B   C
0  10.0  26.0 NaN
1  16.0  19.0 NaN
2   NaN   NaN NaN
'''
fill = A.stack().mean()  # 计算A的均值
print(fill) # 12.25
print(A.add(B,fill_value=fill))# 没有共同的加fill,即加12.25
'''
       A      B      C
0  10.00  26.00  18.25
1  16.00  19.00  18.25
2  16.25  19.25  15.25
'''
3.3 DataFrame与Series运算
print(df)
'''
   Q  R  S  T
0  6  3  7  4
1  6  9  2  6
2  7  4  3  7
'''
print(df-df.iloc[0])
'''
   Q  R  S  T
0  0  0  0  0
1  0  6 -5  2
2  1  1 -4  3
'''
print(df.subtract(df['R'],axis=0))
'''
   Q  R  S  T
0  3  0  4  1
1 -3  0 -7 -3
2  3  0 -1  3
'''
halfrow = df.iloc[0,::2]
print(halfrow)
'''
Q    6
S    7
Name: 0, dtype: int32
'''
print(df-halfrow)
'''
     Q   R    S   T
0  0.0 NaN  0.0 NaN
1  0.0 NaN -5.0 NaN
2  1.0 NaN -4.0 NaN
'''
四、层级索引
4.1 多级索引Series
用一维Series对象表示二维数据
4.1.1 笨方法
import pandas as pd

index = [('California',2000),('California',2010),
         ('New York',2000),('New York', 2010),
         ('Texas',2000),('Texas',2010)]
populations = [11111,22222,33333,44444,55555,66666]
pop = pd.Series(populations, index=index)
print(pop)
'''
(California, 2000)    11111
(California, 2010)    22222
(New York, 2000)      33333
(New York, 2010)      44444
(Texas, 2000)         55555
(Texas, 2010)         66666
dtype: int64
'''
print(pop[('California',2010):('Texas',2000)]) # 切片
'''
(California, 2010)    22222
(New York, 2000)      33333
(New York, 2010)      44444
(Texas, 2000)         55555
dtype: int64
'''
print(pop[[i for i in pop.index if i[1] == 2010]]) # 选择2010数据
'''
(California, 2010)    22222
(New York, 2010)      44444
(Texas, 2010)         66666
dtype: int64
'''
4.1.2 好方法:Pandas多级索引
import pandas as pd

index = [('California',2000),('California',2010),
         ('New York',2000),('New York', 2010),
         ('Texas',2000),('Texas',2010)]
populations = [11111,22222,33333,44444,55555,66666]
pop = pd.Series(populations, index=index)
index = pd.MultiIndex.from_tuples(index)
print(index)
'''
MultiIndex([('California', 2000),
            ('California', 2010),
            (  'New York', 2000),
            (  'New York', 2010),
            (     'Texas', 2000),
            (     'Texas', 2010)],
           )
'''
pop = pop.reindex(index)
print(pop)
'''
California  2000    11111
            2010    22222
New York    2000    33333
            2010    44444
Texas       2000    55555
            2010    66666
dtype: int64
'''
print(pop[:,2010]) # 直接使用第二个索引获取2010的全部数据
'''
California    22222
New York      44444
Texas         66666
dtype: int64
'''
4.1.3 高维数据的多级索引
populations = [11111,22222,33333,44444,55555,66666]
index = pd.MultiIndex.from_tuples([('California',2000),('California',2010),
                                   ('New York',2000),('New York', 2010),
                                   ('Texas',2000),('Texas',2010)])
pop = pd.Series(populations, index=index)
pop_df = pop.unstack()
print(pop_df)
'''
             2000   2010
California  11111  22222
New York    33333  44444
Texas       55555  66666
'''
print(pop_df.stack())
'''
California  2000    11111
            2010    22222
New York    2000    33333
            2010    44444
Texas       2000    55555
            2010    66666
dtype: int64
'''
pop_df = pd.DataFrame({'total':pop,
                       'under18':[11111,22222,33333,44444,55555,66666]})
print(pop_df)
'''
                 total  under18
California 2000  11111    11111
           2010  22222    22222
New York   2000  33333    33333
           2010  44444    44444
Texas      2000  55555    55555
           2010  66666    66666
'''
f_u18 = pop_df['under18']/pop_df['total']
print(f_u18.unstack())
'''
            2000  2010
California   1.0   1.0
New York     1.0   1.0
Texas        1.0   1.0
'''
4.2 多级索引的创建方法
df = pd.DataFrame(np.random.rand(4,2),index=[['a','a','b','b'],[1,2,1,2]],columns=['data1','data2'])
print(df)
'''
        data1     data2
a 1  0.045858  0.391234
  2  0.631418  0.924928
b 1  0.534416  0.216372
  2  0.300895  0.523091
'''
data = {('California',2000):11111,('California',2010):22222,
        ('New York',2000):33333,('New York', 2010):44444,
        ('Texas',2000):55555,('Texas',2010):66666}
print(pd.Series(data))
'''
California  2000    11111
            2010    22222
New York    2000    33333
            2010    44444
Texas       2000    55555
            2010    66666
dtype: int64
'''
4.2.1 显示地创建多级索引
print(pd.MultiIndex.from_arrays([['a','a','b','b'],[1,2,1,2]])) # 若干简单数组组成的列表创建
'''
MultiIndex([('a', 1),
            ('a', 2),
            ('b', 1),
            ('b', 2)],
           )
'''
print(pd.MultiIndex.from_tuples([('a',1),('a',2),('b',1),('b',2)])) # 包含多个索引元组构成的列表创建
'''
MultiIndex([('a', 1),
            ('a', 2),
            ('b', 1),
            ('b', 2)],
           )
'''
print(pd.MultiIndex.from_product([['a','b'],[1,2]])) # 用两个索引的笛卡尔积创建
'''
MultiIndex([('a', 1),
            ('a', 2),
            ('b', 1),
            ('b', 2)],
           )
'''
4.2.2 多级索引的等级名称
populations = [11111,22222,33333,44444,55555,66666]
index = pd.MultiIndex.from_tuples([('California',2000),('California',2010),
                                   ('New York',2000),('New York', 2010),
                                   ('Texas',2000),('Texas',2010)])
pop = pd.Series(populations, index=index)
pop.index.names = ['state','year']
print(pop)
'''
state       year
California  2000    11111
            2010    22222
New York    2000    33333
            2010    44444
Texas       2000    55555
            2010    66666
dtype: int64
'''
4.2.3 多级列索引
# 多级行列索引
index = pd.MultiIndex.from_product([[2013,2014],[1,2]],names=['year','visit'])
columns = pd.MultiIndex.from_product([['Bob','Guido','Sue'],['HR','Temp']],names=['subject','type'])
# 模拟数据
data = np.round(np.random.randn(4,6),1)
data[:,::2] *= 10
data += 37

# 创建DataFrame
health_data = pd.DataFrame(data,index=index,columns=columns)
print(health_data)
'''
subject      Bob       Guido         Sue
type          HR  Temp    HR  Temp    HR  Temp
year visit
2013 1      49.0  37.7  29.0  36.2  45.0  36.4
     2      51.0  36.9  13.0  36.3  50.0  39.2
2014 1      41.0  36.2  21.0  37.4  43.0  37.1
     2      42.0  35.3  37.0  35.8  41.0  35.9
type          HR  Temp
'''
print(health_data['Guido'])
'''
year visit
2013 1      29.0  36.2
     2      13.0  36.3
2014 1      21.0  37.4
     2      37.0  35.8
'''
4.3 多级索引的取片与切片
4.3.1 Series多级索引
populations = [11111,22222,33333,44444,55555,66666]
index = pd.MultiIndex.from_tuples([('California',2000),('California',2010),
                                   ('New York',2000),('New York', 2010),
                                   ('Texas',2000),('Texas',2010)])
pop = pd.Series(populations, index=index)
pop.index.names = ['state','year']
print(pop)
'''
state       year
California  2000    11111
            2010    22222
New York    2000    33333
            2010    44444
Texas       2000    55555
            2010    66666
dtype: int64
'''
print(pop['California'])
'''
year
2000    11111
2010    22222
dtype: int64
'''
print(pop['California',2000])  # 11111
print(pop.loc['California':'New York'])
'''
state       year
California  2000    11111
            2010    22222
New York    2000    33333
            2010    44444
dtype: int64
'''
print(pop[:,2000])
'''
state
California    11111
New York      33333
Texas         55555
dtype: int64
'''
print(pop[pop>22222])
'''
state     year
New York  2000    33333
          2010    44444
Texas     2000    55555
          2010    66666
dtype: int64
'''
print(pop[['California','Texas']])
'''
state       year
California  2000    11111
            2010    22222
Texas       2000    55555
            2010    66666
dtype: int64
'''
4.3.2 DataFrame多级索引
index = pd.MultiIndex.from_product([[2013,2014],[1,2]],names=['year','visit'])
columns = pd.MultiIndex.from_product([['Bob','Guido','Sue'],['HR','Temp']],names=['subject','type'])
# 模拟数据
data = np.round(np.random.randn(4,6),1)
data[:,::2] *= 10
data += 37

# 创建DataFrame
health_data = pd.DataFrame(data,index=index,columns=columns)
print(health_data)
'''
subject      Bob       Guido         Sue
type          HR  Temp    HR  Temp    HR  Temp
year visit
2013 1      51.0  38.7  27.0  35.8  18.0  37.2
     2      40.0  37.4  41.0  36.0  34.0  36.6
2014 1      17.0  35.6  39.0  36.0  41.0  36.4
     2      26.0  35.8  32.0  36.2  47.0  36.9
'''
print(health_data['Guido','HR'])
'''
year  visit
2013  1        48.0
      2        35.0
2014  1        30.0
      2        48.0
Name: (Guido, HR), dtype: float64
'''
print(health_data.iloc[:2,:2])
'''
subject      Bob
type          HR  Temp
year visit
2013 1      24.0  38.6
     2      42.0  38.2
'''
print(health_data.loc[:,('Bob','HR')])
'''
year  visit
2013  1        36.0
      2        49.0
2014  1        55.0
      2        35.0
Name: (Bob, HR), dtype: float64
'''
idx = pd.IndexSlice  # 利用这个切片
print(health_data.loc[idx[:,1],idx[:,'HR']])
'''
subject      Bob Guido   Sue
type          HR    HR    HR
year visit
2013 1      46.0  41.0  37.0
2014 1      37.0  51.0  43.0
'''
4.4 多级索引行列转换
4.4.1 有序的索引和无序的索引
如果MultiIndex不是有序索引,那么大多数切片操作都会失败
index = pd.MultiIndex.from_product([['a','c','b'],[1,2]])
data = pd.Series(np.random.rand(6),index=index)
data.index.names=['char','int']
print(data)
'''
char  int
a     1      0.252805
      2      0.934107
c     1      0.154999
      2      0.363860
b     1      0.391106
      2      0.316172
dtype: float64
'''
# 对索引使用局部切片,由于无序会出错
try:
    print(data['a':'b'])
except KeyError as e:
    print(e)
'''
'Key length (1) was greater than MultiIndex lexsort depth (0)'
'''
# Pandas提供了排序操作,如sort_indx()和sortlevel()
data = data.sort_index()
print(data)
'''
char  int
a     1      0.839251
      2      0.853601
b     1      0.698143
      2      0.926872
c     1      0.632588
      2      0.959209
dtype: float64
'''
print(data['a':'b'])
'''
char  int
a     1      0.839251
      2      0.853601
b     1      0.698143
      2      0.926872
dtype: float64
'''
4.4.2 索引stack与unstack
populations = [11111,22222,33333,44444,55555,66666]
index = pd.MultiIndex.from_tuples([('California',2000),('California',2010),
                                   ('New York',2000),('New York', 2010),
                                   ('Texas',2000),('Texas',2010)])
pop = pd.Series(populations, index=index)
pop.index.names = ['state','year']
print(pop)
'''
state       year
California  2000    11111
            2010    22222
New York    2000    33333
            2010    44444
Texas       2000    55555
            2010    66666
dtype: int64
'''
print(pop.unstack(level=0))
'''
state  California  New York  Texas
year
2000        11111     33333  55555
2010        22222     44444  66666
'''
print(pop.unstack(level=1))
'''
year         2000   2010
state
California  11111  22222
New York    33333  44444
Texas       55555  66666
'''
print(pop.unstack().stack()) # stack()与unstack()是逆操作,同时使用两个,数据不变
'''
state       year
California  2000    11111
            2010    22222
New York    2000    33333
            2010    44444
Texas       2000    55555
            2010    66666
dtype: int64
'''
4.4.3 索引的设置与重置
populations = [11111,22222,33333,44444,55555,66666]
index = pd.MultiIndex.from_tuples([('California',2000),('California',2010),
                                   ('New York',2000),('New York', 2010),
                                   ('Texas',2000),('Texas',2010)])
pop = pd.Series(populations, index=index)
pop.index.names = ['state','year']
pop_flat = pop.reset_index(name='population')
print(pop_flat)
'''
        state  year  population
0  California  2000       11111
1  California  2010       22222
2    New York  2000       33333
3    New York  2010       44444
4       Texas  2000       55555
5       Texas  2010       66666
'''
print(pop_flat.set_index(['state','year']))
'''
                 population
state      year
California 2000       11111
           2010       22222
New York   2000       33333
           2010       44444
Texas      2000       55555
           2010       66666
'''
4.5 多级索引的数据累计方法
# Pandas自带数据累计方法,如:mean()、sum()、max(),对于层级索引数据,可以设置参数level实现对数据子集的累计操作
index = pd.MultiIndex.from_product([[2013,2014],[1,2]],names=['year','visit'])
columns = pd.MultiIndex.from_product([['Bob','Guido','Sue'],['HR','Temp']],names=['subject','type'])
# 模拟数据
data = np.round(np.random.randn(4,6),1)
data[:,::2] *= 10
data += 37

# 创建DataFrame
health_data = pd.DataFrame(data,index=index,columns=columns)
print(health_data)
'''
subject      Bob       Guido         Sue
type          HR  Temp    HR  Temp    HR  Temp
year visit
2013 1      30.0  36.5  42.0  37.6  16.0  37.5
     2      34.0  37.8  53.0  37.1  38.0  38.0
2014 1      35.0  35.7  27.0  37.6  45.0  36.8
     2      42.0  39.3  48.0  36.8  31.0  36.6
'''
# 计算每一年各项平均值
data_mean = health_data.mean(level='year')
print(data_mean)
'''
subject   Bob        Guido          Sue
type       HR   Temp    HR   Temp    HR   Temp
year
2013     32.0  37.15  47.5  37.35  27.0  37.75
2014     38.5  37.50  37.5  37.20  38.0  36.70
'''
# 设置axis参数,可以对列索引进行类似的累计操作
print(data_mean.mean(axis=1,level='type'))
'''
type    HR       Temp
year
2013  35.5  37.416667
2014  38.0  37.133333
'''
五、合并数据集
5.1 Concat与Append操作
5.1.1 pd.concat(索引重复)
通过pd.concat实现简易合并
# 定义一个创建DataFrame某种形式的函数
def make_df(cols, ind):
    data = {c:[str(c)+str(i) for i in ind] for c in cols}
    return pd.DataFrame(data,ind)

## 通过pd.concat实现简易合并
ser1 = pd.Series(['A','B','C'],index=[1,2,3])
ser2 = pd.Series(['D','E','F'],index=[4,5,6])
print(pd.concat([ser1,ser2]))
'''
1    A
2    B
3    C
4    D
5    E
6    F
dtype: object
'''
df1 = make_df('AB',[1,2])
df2 = make_df('AB',[3,4])
print(df1)
'''
    A   B
1  A1  B1
2  A2  B2
'''
print(df2)
'''
    A   B
3  A3  B3
4  A4  B4
'''
print(pd.concat([df1,df2]))
'''
    A   B
1  A1  B1
2  A2  B2
3  A3  B3
4  A4  B4
'''
df3 = make_df('AB',[0,1])
df4 = make_df('CD',[0,1])
print(df3)
'''
    A   B
0  A0  B0
1  A1  B1
'''
print(df4)
'''
    C   D
0  C0  D0
1  C1  D1
'''
print(pd.concat([df3,df4],axis=1))
'''
    A   B   C   D
0  A0  B0  C0  D0
1  A1  B1  C1  D1
'''
print(pd.concat([df3,df4]))
'''
     A    B    C    D
0   A0   B0  NaN  NaN
1   A1   B1  NaN  NaN
0  NaN  NaN   C0   D0
1  NaN  NaN   C1   D1
'''
索引重复
# 定义一个创建DataFrame某种形式的函数
def make_df(cols, ind):
    data = {c:[str(c)+str(i) for i in ind] for c in cols}
    return pd.DataFrame(data,ind)

# 索引重复
# np.concatrnate与pd.concat区别是Pandas会保留索引,即使索引是重复的
x = make_df('AB',[0,1])
y = make_df('AB',[2,3])
y.index = x.index # 复制索引
print(x)
'''
    A   B
0  A0  B0
1  A1  B1
'''
print(y)
'''
    A   B
0  A2  B2
1  A3  B3
'''
print(pd.concat([x,y]))
'''
    A   B
0  A0  B0
1  A1  B1
0  A2  B2
1  A3  B3
'''
结果索引是重复的,pd.concat提供了解决该问题的方法
捕获索引重复的错误(参数verify_interity)
设置参数verify_interity为True,合并有重复时会触发异常
try:
    pd.concat([x,y], verify_integrity=True)
except ValueError as e:
    print("ValueError:",e)  # ValueError: Indexes have overlapping values: Int64Index([0, 1], dtype='int64')
忽略索引(参数ignore_index)
设置参数ignore_index为True,合并会创建新的整数索引
print(pd.concat([x,y],ignore_index=True))
'''
    A   B
0  A0  B0
1  A1  B1
2  A2  B2
3  A3  B3
'''
增加多级索引(参数keys)
设置参数keys为数据源设置多级索引标签
print(pd.concat([x,y],keys=['x','y']))
'''
      A   B
x 0  A0  B0
  1  A1  B1
y 0  A2  B2
  1  A3  B3
'''
用join参数设置合并方式(所有列 or 列的交集)
缺失的数据用NaN表示,如果不想这样,可以用join参数设置合并方式,默认方式是对所有列进行合并(join=‘outer’),join='inner’是对列的交集合并
print(pd.concat([x,y],join='inner'))
'''
    B   C
1  B1  C1
2  B2  C2
1  B3  C3
2  B4  C4
'''
5.1.2 append()方法
x.append(y)效果与pd.concat([x,y])一样
# 定义一个创建DataFrame某种形式的函数
def make_df(cols, ind):
    data = {c:[str(c)+str(i) for i in ind] for c in cols}
    return pd.DataFrame(data,ind)

x = make_df('AB',[1,2])
y = make_df('AB',[3,4])
print(x)
'''
    A   B
1  A1  B1
2  A2  B2
'''
print(y)
'''
    A   B
3  A3  B3
4  A4  B4
'''
print(x.append(y))
'''
    A   B
1  A1  B1
2  A2  B2
3  A3  B3
4  A4  B4
'''
5.2 合并数据集:合并(merge)与连接(join)
5.2.1 数据连接类型(pd.merge)(一对一,多对一,多对多)
一对一
共同列的位置可以是不一样,merge会正确处理该问题,另外,merge会自动丢弃原来的行索引,可以自定义
df1 = pd.DataFrame({'employee':['Bob','Jake','Lisa','Sue'],
                    'group':['Accounting','Engineering','Engineering','HR']})
df2 = pd.DataFrame({'employee':['Lisa','Bob','Jake','Sue'],
                    'hirer_data':[2004,2008,2012,2014]})
print(df1)
'''
  employee        group
0      Bob   Accounting
1     Jake  Engineering
2     Lisa  Engineering
3      Sue           HR
'''
print(df2)
'''
  employee  hirer_data
0     Lisa        2004
1      Bob        2008
2     Jake        2012
3      Sue        2014
'''
df3 = pd.merge(df1, df2)
print(df3)
'''
  employee        group  hirer_data
0      Bob   Accounting        2008
1     Jake  Engineering        2012
2     Lisa  Engineering        2004
3      Sue           HR        2014
'''
多对一
指连接的两个列中有一列的值有重复,结果中的supervisor会因为group有重复而有重复
df4 = pd.DataFrame({'group':['Accounting','Engineering','HR'],
                    'supervisor':['Carly','Guido','Steve']})
print(df3)
'''
  employee        group  hirer_data
0      Bob   Accounting        2008
1     Jake  Engineering        2012
2     Lisa  Engineering        2004
3      Sue           HR        2014
'''
print(df4)
'''
         group supervisor
0   Accounting      Carly
1  Engineering      Guido
2           HR      Steve
'''
print(pd.merge(df3,df4))
'''
  employee        group  hirer_data supervisor
0      Bob   Accounting        2008      Carly
1     Jake  Engineering        2012      Guido
2     Lisa  Engineering        2004      Guido
3      Sue           HR        2014      Steve
'''
多对多
两个输入的共同列都包含重复值,则为多对多
df5 = pd.DataFrame({'group':['Accounting','Accounting','Engineering','Engineering','HR','HR'],
                    'skills':['math','spreadsheets','coding','linux','spreadsheets','organization']})
print(df1)
'''
  employee        group
0      Bob   Accounting
1     Jake  Engineering
2     Lisa  Engineering
3      Sue           HR
'''
print(df5)
'''
         group        skills
0   Accounting          math
1   Accounting  spreadsheets
2  Engineering        coding
3  Engineering         linux
4           HR  spreadsheets
5           HR  organization
'''
print(pd.merge(df1,df5))
'''
  employee        group        skills
0      Bob   Accounting          math
1      Bob   Accounting  spreadsheets
2     Jake  Engineering        coding
3     Jake  Engineering         linux
4     Lisa  Engineering        coding
5     Lisa  Engineering         linux
6      Sue           HR  spreadsheets
7      Sue           HR  organization
'''
5.2.2 设置数据合并的键
merge默认将两个输入的一个或多个共同列作为键进行合并。但由于两个输入要合并的列通常不是同名的,merge提供了一些参数处理
参数on的用法
将参数on设置为一个列名字符串或者一个包含多个列名称的列表,这个参数只能在两个DataFrame有共同列名的时候才可以使用
df1 = pd.DataFrame({'employee':['Bob','Jake','Lisa','Sue'],
                    'group':['Accounting','Engineering','Engineering','HR']})
df2 = pd.DataFrame({'employee':['Lisa','Bob','Jake','Sue'],
                    'hirer_data':[2004,2008,2012,2014]})
print(df1)
'''
  employee        group
0      Bob   Accounting
1     Jake  Engineering
2     Lisa  Engineering
3      Sue           HR
'''
print(df2)
'''
  employee  hirer_data
0     Lisa        2004
1      Bob        2008
2     Jake        2012
3      Sue        2014
'''
print(pd.merge(df1,df2,on='employee'))
'''
  employee        group  hirer_data
0      Bob   Accounting        2008
1     Jake  Engineering        2012
2     Lisa  Engineering        2004
3      Sue           HR        2014
'''
left_on与right_on参数
合并两个列名不同的数据集
df3 = pd.DataFrame({'name':['Bob','Jake','Lisa','Sue'],
                    'salary':[70000,80000,120000,90000]})
print(df1)
'''
  employee        group
0      Bob   Accounting
1     Jake  Engineering
2     Lisa  Engineering
3      Sue           HR
'''
print(df3)
'''
   name  salary
0   Bob   70000
1  Jake   80000
2  Lisa  120000
3   Sue   90000
'''
print(pd.merge(df1,df3,left_on="employee",right_on="name"))
'''
  employee        group  name  salary
0      Bob   Accounting   Bob   70000
1     Jake  Engineering  Jake   80000
2     Lisa  Engineering  Lisa  120000
3      Sue           HR   Sue   90000
'''
drop去除多余列
print(pd.merge(df1,df3,left_on="employee",right_on="name").drop('name',axis=1))
'''
  employee        group  salary
0      Bob   Accounting   70000
1     Jake  Engineering   80000
2     Lisa  Engineering  120000
3      Sue           HR   90000
'''
left_index与right_index参数
除了合并列之外,可能还需要合并索引
df1a = df1.set_index('employee')
df2a = df2.set_index('employee')
print(df1a)
'''
                group
employee
Bob        Accounting
Jake      Engineering
Lisa      Engineering
Sue                HR
'''
print(df2a)
'''
          hirer_data
employee
Lisa            2004
Bob             2008
Jake            2012
Sue             2014
'''
print(pd.merge(df1a,df2a,left_index=True,right_index=True))
'''
                group  hirer_data
employee
Bob        Accounting        2008
Jake      Engineering        2012
Lisa      Engineering        2004
Sue                HR        2014
'''
为了方便考虑,DataFrame实现了join方法,可以按照索引进行数据合并
print(df1a.join(df2a))
'''
                group  hirer_data
employee
Bob        Accounting        2008
Jake      Engineering        2012
Lisa      Engineering        2004
Sue                HR        2014
'''
如果想要将索引与列混合使用,可以通过结合left_index和right_on,或者结合left_on与right_index来实现
print(df1a)
'''
                group
employee
Bob        Accounting
Jake      Engineering
Lisa      Engineering
Sue                HR
'''
print(df3)
'''
   name  salary
0   Bob   70000
1  Jake   80000
2  Lisa  120000
3   Sue   90000
'''
print(pd.merge(df1a,df3,left_index=True,right_on='name'))
'''
         group  name  salary
0   Accounting   Bob   70000
1  Engineering  Jake   80000
2  Engineering  Lisa  120000
3           HR   Sue   90000
'''
5.2.3 设置数据连接的集合操作规则
当一个值出现在一列,却没有出现在另一列时,需要考虑集合操作规则
df6 = pd.DataFrame({'name':['Peter','Paul','Mary'],
                    'food':['fish','beans','bread']},
                   columns=['name','food'])
df7 = pd.DataFrame({'name':['Mary','Joseph'],
                    'drink':['wine','beer']},
                   columns=['name','drink'])
print(df6)
'''
    name   food
0  Peter   fish
1   Paul  beans
2   Mary  bread
'''
print(df7)
'''
     name drink
0    Mary  wine
1  Joseph  beer
'''
print(pd.merge(df6,df7))
'''
   name   food drink
0  Mary  bread  wine
'''
合并两个数据集,在name列中只有一个共同值Mary。默认结果只输出两个集合的交集,成为内连接
how参数设置连接方式
#how的值有inner(内连接),outer(外连接),left(左连接),right(有连接)
print(pd.merge(df6,df7,how='inner'))
'''
   name   food drink
0  Mary  bread  wine
'''
print(pd.merge(df6,df7,how='outer'))
'''
     name   food drink
0   Peter   fish   NaN
1    Paul  beans   NaN
2    Mary  bread  wine
3  Joseph    NaN  beer
'''
print(pd.merge(df6,df7,how='left'))
'''
    name   food drink
0  Peter   fish   NaN
1   Paul  beans   NaN
2   Mary  bread  wine
'''
print(pd.merge(df6,df7,how='right'))
'''
     name   food drink
0    Mary  bread  wine
1  Joseph    NaN  beer
'''
5.2.4 重复列名:suffixes参数
可能两个输入DataFrame有重名列的情况
df8 = pd.DataFrame({'name':['Bob','Jake','Lisa','Sue'],
                    'rank':[1,2,3,4]})
df9 = pd.DataFrame({'name':['Bob','Jake','Lisa','Sue'],
                    'rank':[3,1,4,2]})
print(df8)
'''
   name  rank
0   Bob     1
1  Jake     2
2  Lisa     3
3   Sue     4
'''
print(df9)
'''
   name  rank
0   Bob     3
1  Jake     1
2  Lisa     4
3   Sue     2
'''
print(pd.merge(df8,df9,on="name"))# 列名一样,会自动添加后缀rank_x  rank_y
'''
   name  rank_x  rank_y
0   Bob       1       3
1  Jake       2       1
2  Lisa       3       4
3   Sue       4       2
'''
print(pd.merge(df8,df9,on="name",suffixes=["_L","_R"])) # suffixes定义后缀
'''
   name  rank_L  rank_R
0   Bob       1       3
1  Jake       2       1
2  Lisa       3       4
3   Sue       4       2
'''
六、累计与分组
6.1 行星数据
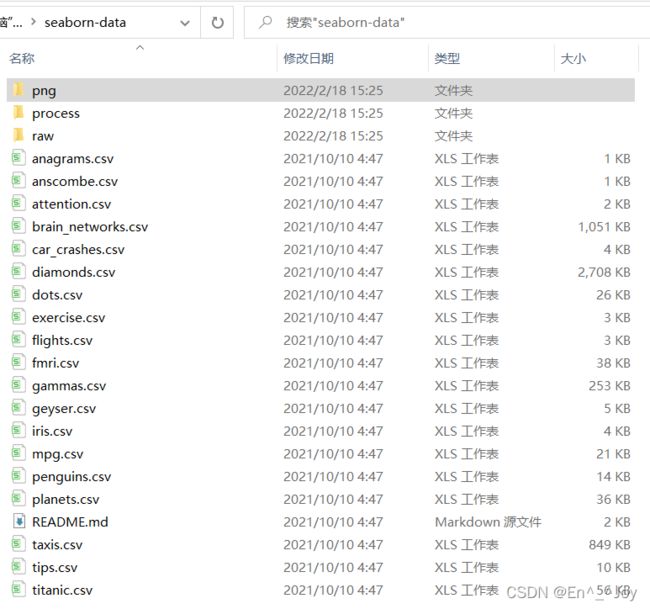
通过seaborn库得到行星数据,报错将https://github.com/mwaskom/seaborn-data中的文件保存到文件seaborn-data中

import seaborn as sns

planets = sns.load_dataset('planets')
print(planets.shape)  # (1035, 6)
print(planets.head())
'''
            method  number  orbital_period   mass  distance  year
0  Radial Velocity       1         269.300   7.10     77.40  2006
1  Radial Velocity       1         874.774   2.21     56.95  2008
2  Radial Velocity       1         763.000   2.60     19.84  2011
3  Radial Velocity       1         326.030  19.40    110.62  2007
4  Radial Velocity       1         516.220  10.50    119.47  2009
'''
6.2 pandas简单累计功能
| 函数 | 说明 |
|---|---|
| count() | 计数项 |
| first()、last() | 第一项与最后一项 |
| mean()、median() | 均值与中位数 |
| min()、max() | 最小值与最大值 |
| std()、var() | 标准差与方差 |
| mad() | 均值绝对偏差 |
| prod() | 所有项乘积 |
| sum() | 所有项求和 |
| describe() | 每列的若干统计值 |
Numpy数组累计指标和pandas累计函数
import pandas as pd

ser = pd.Series([2,4,6,8])
print(ser)
'''
0    2
1    4
2    6
3    8
dtype: int64
'''
print(ser.sum())  # 20
print(ser.mean()) # 5.0
DataFrame累计函数默认对每列进行统计
import pandas as pd

df = pd.DataFrame({'A':[1,2,3],'B':[4,5,6]})
print(df)
'''
   A  B
0  1  4
1  2  5
2  3  6
'''
print(df.mean())
'''
A    2.0
B    5.0
dtype: float64
'''
# 设置axis参数可以对每一行进行统计
print(df.mean(axis='columns'))
'''
0    2.5
1    3.5
2    4.5
dtype: float64
'''
# 计算每列的若干统计值
print(df.describe())
'''
         A    B
count  3.0  3.0
mean   2.0  5.0
std    1.0  1.0
min    1.0  4.0
25%    1.5  4.5
50%    2.0  5.0
75%    2.5  5.5
max    3.0  6.0
'''
6.3 GroupBy:分组、累计与组合
groupby一行代码可以计算每组的和、均值、计数、最小值等
用DataFrame的groupby()方法进需要的列名传入,其次是统计方式,sum为众多可用方法其中一个,还可以用Pandas和Numpy的任意一种累计方式,也可以用任意有效的DataFrame对象
df = pd.DataFrame({'key':['A','B','C','A','B','C'],'data':range(6)},columns=['key','data'])
print(df)
'''
key data
0 A 0
1 B 1
2 C 2
3 A 3
4 B 4
5 C 5
'''
print(df.groupby('key')) # 返回DataFrameGroupBy对象
# 6.3.1 GroupBy对象
GroupBy最常用的操作可能就是aggregate/filter/transform/apply(累计、过滤、转换、应用)
按列取值
import pandas as pd
import seaborn as sns

planets = sns.load_dataset('planets')
print(planets)
'''
               method  number  orbital_period   mass  distance  year
0     Radial Velocity       1      269.300000   7.10     77.40  2006
1     Radial Velocity       1      874.774000   2.21     56.95  2008
2     Radial Velocity       1      763.000000   2.60     19.84  2011
3     Radial Velocity       1      326.030000  19.40    110.62  2007
4     Radial Velocity       1      516.220000  10.50    119.47  2009
...               ...     ...             ...    ...       ...   ...
1030          Transit       1        3.941507    NaN    172.00  2006
1031          Transit       1        2.615864    NaN    148.00  2007
1032          Transit       1        3.191524    NaN    174.00  2007
1033          Transit       1        4.125083    NaN    293.00  2008
1034          Transit       1        4.187757    NaN    260.00  2008

[1035 rows x 6 columns]
'''
print(planets.groupby('method'))
'''

'''
print(planets.groupby('method').median())
'''
                               number  orbital_period   mass  distance    year
method
Astrometry                        1.0      631.180000    NaN    17.875  2011.5
Eclipse Timing Variations         2.0     4343.500000  5.125   315.360  2010.0
Imaging                           1.0    27500.000000    NaN    40.395  2009.0
Microlensing                      1.0     3300.000000    NaN  3840.000  2010.0
Orbital Brightness Modulation     2.0        0.342887    NaN  1180.000  2011.0
Pulsar Timing                     3.0       66.541900    NaN  1200.000  1994.0
Pulsation Timing Variations       1.0     1170.000000    NaN       NaN  2007.0
Radial Velocity                   1.0      360.200000  1.260    40.445  2009.0
Transit                           1.0        5.714932  1.470   341.000  2012.0
Transit Timing Variations         2.0       57.011000    NaN   855.000  2012.5
'''
print(planets.groupby('method')['orbital_period'])
'''

'''
print(planets.groupby('method')['orbital_period'].median())
'''
method
Astrometry                         631.180000
Eclipse Timing Variations         4343.500000
Imaging                          27500.000000
Microlensing                      3300.000000
Orbital Brightness Modulation        0.342887
Pulsar Timing                       66.541900
Pulsation Timing Variations       1170.000000
Radial Velocity                    360.200000
Transit                              5.714932
Transit Timing Variations           57.011000
Name: orbital_period, dtype: float64
'''
按组迭代
planets = sns.load_dataset('planets')
for (method, group) in planets.groupby('method'):
    print("{0:30s} shape={1}".format(method, group.shape))
'''
Astrometry                     shape=(2, 6)
Eclipse Timing Variations      shape=(9, 6)
Imaging                        shape=(38, 6)
Microlensing                   shape=(23, 6)
Orbital Brightness Modulation  shape=(3, 6)
Pulsar Timing                  shape=(5, 6)
Pulsation Timing Variations    shape=(1, 6)
Radial Velocity                shape=(553, 6)
Transit                        shape=(397, 6)
Transit Timing Variations      shape=(4, 6)
'''
6.3.2 累计、过滤、转换、应用
rng = np.random.RandomState(0)
df = pd.DataFrame({'key':['A','B','C','A','B','C'],
                    'data1':range(6),
                    'data2':rng.randint(0,10,6)},
                   columns=['key','data1','data2'])
print(df)
'''
  key  data1  data2
0   A      0      5
1   B      1      0
2   C      2      3
3   A      3      3
4   B      4      7
5   C      5      9
'''
累计
print(df.groupby('key').aggregate(['min',np.median,max]))
'''
    data1            data2
      min median max   min median max
key
A       0    1.5   3     3    4.0   5
B       1    2.5   4     0    3.5   7
C       2    3.5   5     3    6.0   9
'''
print(df.groupby('key').aggregate({'data1':'min',
                                   'data2':'max'}))
'''
     data1  data2
key
A        0      5
B        1      7
C        2      9
'''
过滤
def filter_func(x):
    return x['data2'].std()>4

print(df.groupby('key').std())
'''
       data1     data2
key
A    2.12132  1.414214
B    2.12132  4.949747
C    2.12132  4.242641
'''
print(df.groupby('key').filter(filter_func))
'''A组的data2列的标准差不大于4,所以被丢弃
  key  data1  data2
1   B      1      0
2   C      2      3
4   B      4      7
5   C      5      9
'''
转换
# 每一组的样本数据减去各组的均值
print(df.groupby('key').transform(lambda x:x-x.mean()))
'''
   data1  data2
0   -1.5    1.0
1   -1.5   -3.5
2   -1.5   -3.0
3    1.5   -1.0
4    1.5    3.5
5    1.5    3.0
'''
apply()方法
# 该方法可以在每个组上应用任意方法,下面例子将第一列数据以第二列的和为基础进行标准化
def norm_by_data2(x):
    # X是一个分组数据的DataFrame
    x['data1'] /= x['data2'].sum()
    return x

print(df.groupby('key').apply(norm_by_data2))
'''
  key     data1  data2
0   A  0.000000      5
1   B  0.142857      0
2   C  0.166667      3
3   A  0.375000      3
4   B  0.571429      7
5   C  0.416667      9
'''
6.3.3 设置分割的键
rng = np.random.RandomState(0)
df = pd.DataFrame({'key':['A','B','C','A','B','C'],
                    'data1':range(6),
                    'data2':rng.randint(0,10,6)},
                   columns=['key','data1','data2'])
print(df)
'''
  key  data1  data2
0   A      0      5
1   B      1      0
2   C      2      3
3   A      3      3
4   B      4      7
5   C      5      9
'''
将列表、数组、Series或索引作为分组键
print(df.groupby('key').sum())
'''
     data1  data2
key
A        3      8
B        5      7
C        7     12
'''
L=[0,1,0,1,2,0]# 相当于序列号,替换上面的A、B、C、A、B、C
print(df.groupby(L).sum())
'''相当于将ABCABC转换为010120,data1后面的7为0+2+5,4为1+3,4为4
   data1  data2
0      7     17
1      4      3
2      4      7
'''
用字典或Series将索引映射到分组名称
df2 = df.set_index('key')
mapping = {'A':'vowel','B':'consonant','C':'consonant'}
print(df2)
'''
     data1  data2
key
A        0      5
B        1      0
C        2      3
A        3      3
B        4      7
C        5      9
'''
print(df2.groupby(mapping).sum())
'''
           data1  data2
consonant     12     19
vowel          3      8
'''
任意python函数
print(df2.groupby(str.lower).mean())
'''
   data1  data2
a    1.5    4.0
b    2.5    3.5
c    3.5    6.0
'''
多个有效键构成的列表
df2 = df.set_index('key')
mapping = {'A':'vowel','B':'consonant','C':'consonant'}
print(df2.groupby([str.lower,mapping]).mean())
'''
             data1  data2
a vowel        1.5    4.0
b consonant    2.5    3.5
c consonant    3.5    6.0
'''
七、数据累计分析
数据透视表是一种类似的操作方法,常见于Excel与类似的表格应用中,数据透视表将每一列数据作为输入,输出将数据不断细分成多个维度累计信息的二维数据表,数据透视表可以理解为一种GroupBy
7.1 演示数据透视表
这节例子采用泰坦尼克号的乘客信息数据库演示,在seaborn程序库获取,该信息包括惨遭厄运的每位乘客的大量信息,包括性别(gender)、年龄(age)、船舱等级(class)、票价(fare paid)等
import pandas as pd
import seaborn as sns
import numpy as np

titanic = sns.load_dataset('titanic')
print(titanic.head())
'''
   survived   class     sex   age  ...  deck  embark_town  alive  alone
0         0       3    male  22.0  ...   NaN  Southampton     no  False
1         1       1  female  38.0  ...     C    Cherbourg    yes  False
2         1       3  female  26.0  ...   NaN  Southampton    yes   True
3         1       1  female  35.0  ...     C  Southampton    yes  False
4         0       3    male  35.0  ...   NaN  Southampton     no   True

[5 rows x 15 columns]
'''
7.2 手工制作数据透视表
首先将他们按照性别、最终生还状态和其他组合属性进行分组,在前面会用GroupBy来实现,例如统计不同性别乘客的生还率
print(titanic.groupby('sex')[['survived']].mean())
'''
        survived
sex
female  0.742038
male    0.188908
'''
我们进一步探索,同时观察不同性别与船舱等级的生还情况,用GroupBy操作也能得到结果
print(titanic.groupby(['sex','class'])['survived'].aggregate('mean').unstack())
'''
class      First    Second     Third
sex
female  0.968085  0.921053  0.500000
male    0.368852  0.157407  0.135447
'''
该代码复杂,pandas提供了一个便捷方式pivot_table来快速解决多维的累计分析问题
7.3 数据透视表语法
用DataFrame的pivot_table实现的效果等同于上一节管道命令的代码
print(titanic.pivot_table('survived', index='sex', columns='class'))
'''
class      First    Second     Third
sex
female  0.968085  0.921053  0.500000
male    0.368852  0.157407  0.135447
'''
7.3.1 多级数据透视表
与GroupBy类似可以将年龄加入进去作为第三维度,通过pd.cut函数将年龄进行分段
age = pd.cut(titanic['age'],[0,18,80])
print(titanic.pivot_table('survived', ['sex', age], 'class'))
'''
class               First    Second     Third
sex    age
female (0, 18]   0.909091  1.000000  0.511628
       (18, 80]  0.972973  0.900000  0.423729
male   (0, 18]   0.800000  0.600000  0.215686
       (18, 80]  0.375000  0.071429  0.133663
'''
对某一列也可以使用同样的策略,利用pd.cut将船票价格按照计数项等分为两份
fare = pd.cut(titanic['fare'], 2)
print(titanic.pivot_table('survived', ['sex',age], [fare,'class']))
'''
fare            (-0.512, 256.165]                     (256.165, 512.329]
class                       First    Second     Third              First
sex    age
female (0, 18]           0.900000  1.000000  0.511628                1.0
       (18, 80]          0.971429  0.900000  0.423729                1.0
male   (0, 18]           0.800000  0.600000  0.215686                NaN
       (18, 80]          0.369565  0.071429  0.133663                0.5
'''
7.3.2 其他数据透视表选项
pivot_table完整版
DataFrame.pivot_table(data,values=None,index=None,columns=None,aggfunc=None,fill_value=None,margins=None,dropna=None,margins_name=None)
fill_value和dropna用于处理缺失值,aggfunc用于设置累计函数类型,默认值是均值,和GroupBy用法一样,累计函数可以用一些常用的字符串(sum,mean,count,min,max等),也可以用标准的累计函数(np.sum(),min(),sum()等),还可以用字典为不同的列指定不同的累计函数
print(titanic.pivot_table(index='sex',columns='class',aggfunc={'survived':sum,'fare':'mean'}))
'''
              fare                       survived
class        First     Second      Third    First Second Third
sex
female  106.125798  21.970121  16.118810       91     70    72
male     67.226127  19.741782  12.661633       45     17    47
'''
这里忽略了values,当我们为aggfunc指定映射关系的时候,带透视的数字就已经确定了
当需要计算每一组的总数时,可以通过margins参数设置
print(titanic.pivot_table('survived',index='sex',columns='class',margins=True))
'''
class      First    Second     Third       All
sex
female  0.968085  0.921053  0.500000  0.742038
male    0.368852  0.157407  0.135447  0.188908
All     0.629630  0.472826  0.242363  0.383838
'''
margin的标签可以通过margins_name参数进行自定义,默认值是All
八、读写文件操作
8.1 写入文件
开始运行可能会报错,需要先安装openpyxl库:pip install openpyxl
8.1.1 写入单个sheet
单个sheet是一个表格文件里面只有一个表格
Series写入
不管有没有a.xlsx,都不会报错,有则覆盖,无则创建
index参数:是否将索引写入
import pandas as pd

a = pd.Series([1, 2, 3],index=['A','B','C'])
# index false为不写入索引
a.to_excel('a.xlsx', sheet_name='Sheet1', index=False)

将index=False改为index=True之后,会将索引写入
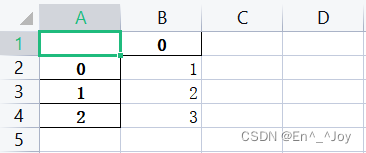
import pandas as pd

a = pd.Series([1, 2, 3])
a.to_excel('a.xlsx', sheet_name='Sheet1', index=True)
import pandas as pd

a = pd.DataFrame([{'a': 0, 'b': 0}, {'a': 1, 'b': 2}, {'a': 2, 'b': 4}])
a.to_excel('a.xlsx', sheet_name='Sheet1', index=True)
import pandas as pd

a = pd.DataFrame([{'a': 0, 'b': 0}, {'a': 1, 'b': 2}, {'a': 2, 'b': 4}])
a.to_excel('a.xlsx', sheet_name='Sheet1', index=False)
8.1.2 写入多个sheet
一个文件有多个表格
import pandas as pd

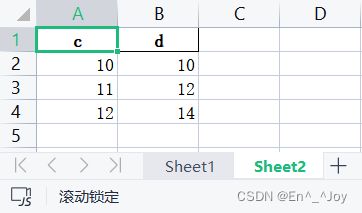
sheet1 = pd.DataFrame([{'a': 0, 'b': 0}, {'a': 1, 'b': 2}, {'a': 2, 'b': 4}])
sheet2 = pd.DataFrame([{'c': 10, 'd': 10}, {'c': 11, 'd': 12}, {'c': 12, 'd': 14}])

with pd.ExcelWriter('a.xlsx') as writer:
    sheet1.to_excel(writer, sheet_name='Sheet1', index=False)
    sheet2.to_excel(writer, sheet_name='Sheet2', index=False)
8.1.3 新增一个sheet
在ExcelWriter函数里面添加个模式参数mode='a',这样在新建的时候就不会把该文件中原有的表格给覆盖了
import pandas as pd

sheet3 = pd.DataFrame([{'e': 40, 'f': 40}, {'e': 41, 'f': 42}, {'e': 42, 'f': 44}])
with pd.ExcelWriter('a.xlsx', mode='a') as writer:
    sheet3.to_excel(writer, sheet_name='Sheet3', index=False)
8.1.4 表格追加数据
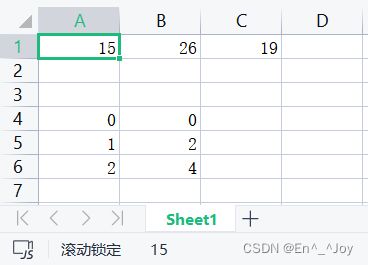
在一个表格中加入两个数据,利用to_excel的参数startrow、startcol可以防止覆盖,to_excel的参数startrow、startcol为写入的起始行列。header为是否写入列名
import pandas as pd

a = pd.DataFrame([{'Li':15,'Liu':26,'Wan':19}])
b = pd.DataFrame([{'a': 0, 'b': 0}, {'a': 1, 'b': 2}, {'a': 2, 'b': 4}])

with pd.ExcelWriter('a.xlsx') as writer:
    a.to_excel(writer, sheet_name='Sheet1', index=False, header=False, startrow=0, startcol=0)
    b.to_excel(writer, sheet_name='Sheet1', index=False, header=False, startrow=3, startcol=0)
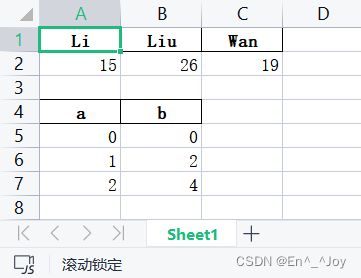
将header=False改为header=True之后
    a.to_excel(writer, sheet_name='Sheet1', index=False, header=True, startrow=0, startcol=0)
    b.to_excel(writer, sheet_name='Sheet1', index=False, header=True, startrow=3, startcol=0)
8.2 读取数据
8.2.1 读取CSV表格数据
pop = pd.read_csv('a.csv')
print(pop.head())
'''
  state  ages  year
0    AL    15  2012
1    AL    20  2012
2    AL    30  2012
'''
8.2.2 读取Excel表格数据
import pandas as pd

a = pd.read_excel('a.xlsx')
print(a.head())
'''
   a  b
0  0  0
1  1  2
2  2  4
'''
运行可能会报错:xlrd.biffh.XLRDError: Excel xlsx file; not supported
需要将xlrd降级,先删除:pip uninstall xlrd
再下载更低等级:pip install xlrd==1.2.0
sheet_name参数可以是数字、列表名
sheet_name为数字时,sheet_name=1表示读取第二个表格,数字从0开始

import pandas as pd

a = pd.read_excel('a.xlsx',sheet_name=1)
print(a.head())
'''
    c   d
0  10  10
1  11  12
2  12  14
'''
sheet_name为列表名时,sheet_name=‘a’表示读取列表名对应的表格
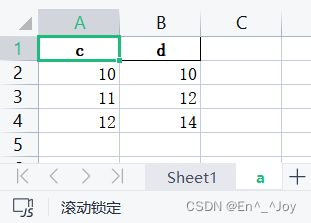
import pandas as pd

a = pd.read_excel('a.xlsx',sheet_name='a')
print(a.head())
'''
    c   d
0  10  10
1  11  12
2  12  14
'''
import pandas as pd

a = pd.read_excel('a.xlsx',sheet_name=['Sheet1','a'])
print(a)
'''
{'Sheet1':    a  b
0  0  0
1  1  2
2  2  4, 'a':     c   d
0  10  10
1  11  12
2  12  14}
'''
header参数:用哪一行作列名
默认为0 ,如果设置为[0,1],则表示将前两行作为多重索引

import pandas as pd

a = pd.read_excel('a.xlsx',sheet_name='a', header=[0,1])
print(a)
'''
    c   d
   10  10
0  11  12
1  12  14
'''
names参数:自定义最终的列名
长度必须和Excel列长度一致,否则会报错

import pandas as pd

a = pd.read_excel('a.xlsx',sheet_name='a', names=['q','w'])
print(a)
'''
    q   w
0  10  10
1  11  12
2  12  14
'''
index_col参数:用作索引的列
参数值可以是数值,也可以是列名
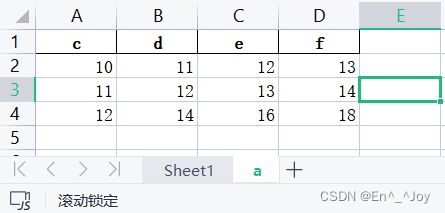
import pandas as pd

a = pd.read_excel('a.xlsx',sheet_name='a', index_col = [0, 1])
print(a)
'''
        e   f
c  d
10 11  12  13
11 12  13  14
12 14  16  18
'''
import pandas as pd

a = pd.read_excel('a.xlsx',sheet_name='a', usecols = [0, 1, 3])
print(a)
'''
    c   d   f
0  10  11  13
1  11  12  14
2  12  14  18
'''
import pandas as pd

a = pd.read_excel('a.xlsx',sheet_name='a', usecols = 'A:B, d')
print(a)
'''
    c   d   f
0  10  11  13
1  11  12  14
2  12  14  18
'''
squeeze参数:当数据仅包含一列
squeeze为True时,返回Series,反之返回DataFrame
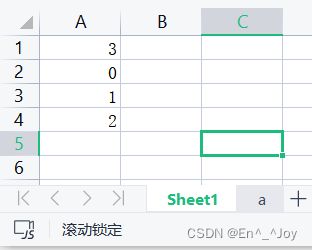
import pandas as pd

a = pd.read_excel('a.xlsx',sheet_name='Sheet1', squeeze=True)
print(a)
'''
0    0
1    1
2    2
Name: 3, dtype: int64
'''
import pandas as pd

a = pd.read_excel('a.xlsx',sheet_name='Sheet1', squeeze=False)
print(a)
'''
   3
0  0
1  1
2  2
'''
skiprows参数:跳过特定行
skiprows= n, 跳过前n行; skiprows = [a, b, c],跳过第a+1,b+1,c+1行
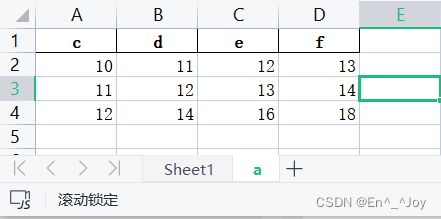
import pandas as pd

a = pd.read_excel('a.xlsx',sheet_name='a', skiprows = 2)
print(a.head())
'''
   11  12  13  14
0  12  14  16  18
'''
import pandas as pd

a = pd.read_excel('a.xlsx',sheet_name='a', skiprows = [0,1])
print(a.head())
'''
   11  12  13  14
0  12  14  16  18
'''
import pandas as pd

a = pd.read_excel('a.xlsx',sheet_name='a', nrows=2)
print(a.head())
'''
    c   d   e   f
0  10  11  12  13
1  11  12  13  14
'''
import pandas as pd

a = pd.read_excel('a.xlsx',sheet_name='a', skipfooter=2)
print(a.head())
'''
    c   d   e   f
0  10  11  12  13
'''
九、处理时间序列
9.1 日期与时间工具
9.1.1 Python的日期与时间工具:datetime与dateutil
可以用datetime类型创建一个日期
from datetime import datetime
print(datetime(year=2022,month=1,day=1))
# 2022-01-01 00:00:00
或者使用dateutil模块对各种字符串的日期进行正确解析
from dateutil import parser
date = parser.parse("4th of July,2022")
print(date)
# 2022-07-04 00:00:00
有了datetime对象,可以进行很多操作,比如打印这天星期几
print(date.strftime('%A'))
# Monday
这里打印星期几使用了一个标准字符串格式代码%A,可以在Python的datetime文档的strftime章节查看。关于datetil的其他日期功能可以通过datetil在线文档学习。pytz程序包解决了大多数时间序列数据都会遇到的问题:时区
9.1.2 Numpy的日期与时间工具
Numpy比datetime对象的运算速度快很多
datetime64类型将日期编码为64位整数,让数组非常紧凑,节省空间,datetime64在设置日期是确定具体的输入类型:
import numpy as np
date = np.array('2022-01-01',dtype=np.datetime64)
print(date)
# 2022-01-01
有了这个日期格式,就可以进行快速的向量化运算
print(date+np.array(12))
# 2022-01-13
datetime64在实践精度和最大实践跨度达成一种平衡,如果想要一个时间纳秒级的时间精度,Numpy会自动判断输入时间使用的时间单位
以天为单位:
print(np.datetime64('2022-01-01'))
# 2022-01-01
以分为单位
print(np.datetime64('2022-01-01 12:00'))
# 2022-01-01T12:00
需要注意的是,时区将自动设置为执行代码的操作系统当地时区,可以通过各种形式的代码设置基本时间单位,例如将时间单位设置为纳秒
print(np.datetime64('2022-01-01 12:59:59.50', 'ns'))
# 2022-01-01T12:59:59.500000000
Numpy的datetime64文档总结了所有支持相对与绝对时间跨度的时间与日期单位格式代码。
日期与时间单位格式代码
| 代码 | 含义 |
|---|---|
| Y | 年 |
| M | 月 |
| W | 周 |
| D | 日 |
| h | 时 |
| m | 分 |
| s | 秒 |
| ms | 毫秒 |
| us | 微秒 |
| ns | 纳秒 |
| ps | 皮秒 |
| fs | 飞秒 |
| as | 原秒 |
Numpy的datetime64弥补了datetime类型的不足,但它缺少了datetime(特别是dateutil)原本具有的便捷方法与函数。
9.1.3 pandas的日期与时间工具:理想与现实的最佳解决方案
我们可以用pandas的方式演示前面介绍的日期与时间功能,灵活处理不同格式的日期与时间字符串,获取某一天是星期几:
import pandas as pd
import numpy as np
date = pd.to_datetime("4th of July,2022")
print(date)
# 2022-07-04 00:00:00
print(date.strftime('%A'))
# Monday
也可以直接进行Numpy类型的向量化运算
print(date+pd.to_timedelta(np.arange(12),'D'))
'''
DatetimeIndex(['2022-07-04', '2022-07-05', '2022-07-06', '2022-07-07',
               '2022-07-08', '2022-07-09', '2022-07-10', '2022-07-11',
               '2022-07-12', '2022-07-13', '2022-07-14', '2022-07-15'],
              dtype='datetime64[ns]', freq=None)
'''
下面详细介绍pandas用来处理时间序列数据的工具
9.2 pandas时间序列:用时间作索引
通过一个时间索引数据创建一个Series对象:
import pandas as pd

index = pd.DatetimeIndex(['2022-01-01','2022-02-01','2023-01-01','2023-02-01'])
data = pd.Series([0,1,2,3], index=index)
print(data)
'''
2022-01-01    0
2022-02-01    1
2023-01-01    2
2023-02-01    3
dtype: int64
'''
有一个带时间索引的Series之后,就能用它来演示Series取值方法,可以直接用日期进行切片取值:
print(data['2022-01-01':'2023-01-01'])
'''
2022-01-01    0
2022-02-01    1
2023-01-01    2
dtype: int64
'''
另外,还有一些仅在此类Series上可用的取值操作,例如直接通过年份切片获取该年的数据:
print(data['2022'])
'''
2022-01-01    0
2022-02-01    1
dtype: int64
'''
9.3 pandas时间序列:创建
最基本的日期/时间对象是Timestamp和DatetimeIndex,这两者可以直接使用,最常用的方法是pd.to_datetime()函数,它可以解析多种时间与日期格式。对pd.to_datetime()传递一个日期会返回一个Timestamp类型,传递一个时间序列会返回一个DatetimeIndex类型:
import pandas as pd
from datetime import datetime

dates = pd.to_datetime([datetime(2022,1,1), '4th of july, 2022','2022-Jul-6','07-07-2022','20220101'])
print(dates)
'''
DatetimeIndex(['2022-01-01', '2022-07-04', '2022-07-06', '2022-07-07',
               '2022-01-01'],
              dtype='datetime64[ns]', freq=None)
'''
任何DatetimeIndex类型都可以通过to_period()方法和一个频率代码转换成PeriodIndex类型。下面用D将数据转换成单日的时间序列:
print(dates.to_period('D'))
'''
PeriodIndex(['2022-01-01', '2022-07-04', '2022-07-06', '2022-07-07',
             '2022-01-01'],
            dtype='period[D]', freq='D')
'''
当一个日期减去另一个日期时,返回的结果是TimedeltaIndex类型:
print(dates-dates[0])
'''
TimedeltaIndex(['0 days', '184 days', '186 days', '187 days', '0 days'], dtype='timedelta64[ns]', freq=None)
'''
有规律的时间序列:pd.date_range()
创建一个有规律的日期序列,默认的频率是天:
print(pd.date_range('2022-01-01','2022-01-04'))
# DatetimeIndex(['2022-01-01', '2022-01-02', '2022-01-03', '2022-01-04'], dtype='datetime64[ns]', freq='D')
此外,日期范围不一定非是开始时间与结束时间,也可以是开始时间与周期数periods:
print(pd.date_range('2022-01-01',periods=3))
# DatetimeIndex(['2022-01-01', '2022-01-02', '2022-01-03'], dtype='datetime64[ns]', freq='D')
还可以通过freq参数改变时间间隔,默认值是D,下面以小时为单位:
print(pd.date_range('2022-01-01',periods=3, freq='H'))
'''
DatetimeIndex(['2022-01-01 00:00:00', '2022-01-01 01:00:00',
               '2022-01-01 02:00:00'],
              dtype='datetime64[ns]', freq='H')
'''
以月为周期:
print(pd.date_range('2022-01',periods=3, freq='M'))
'''
DatetimeIndex(['2022-01-31', '2022-02-28', '2022-03-31'], dtype='datetime64[ns]', freq='M')
'''
以一个小时递增序列
print(pd.timedelta_range(0, periods=3, freq='H'))
'''
TimedeltaIndex(['0 days 00:00:00', '0 days 01:00:00', '0 days 02:00:00'], dtype='timedelta64[ns]', freq='H')
'''
9.4 时间频率与偏移量
pandas频率代码
| 代码 | 含义 |
|---|---|
| A | 年末 |
| BA | 年末(仅工作日) |
| Q | 季末 |
| BQ | 季末(仅工作日) |
| M | 月末 |
| MB | 月末(仅工作日) |
| W | 周 |
| D | 天(含双休日) |
| B | 天(仅工作日) |
| H | 小时 |
| BH | 小时(工作时间) |
| T | 分钟 |
| S | 秒 |
| L | 毫秒 |
| U | 微秒 |
| N | 纳秒 |
月、季、年都是具体周期的结束时间(月末、季末、年末),而有一些以S为后缀的代码表示日期开始时间
| 代码 | 含义 |
|---|---|
| AS | 年初 |
| BAS | 年初(仅工作日) |
| QS | 季初 |
| BQS | 季初(仅工作日) |
| MS | 月初 |
| MBS | 月初(仅工作日) |
另外,可以在频率代码后面加三位月份缩写字母来改变季、年频率的开始时间。
Q-JAN、BQ-FEB、QS-MAR、BQS-APR等
A-JAN、BA-FEB、AS-MAR、BAS-APR等
同理,在后面加三位星期缩写字母来改变一周的开始时间。
W-SUM、W-MON、W-TUE、W-WED等
在这基础上,还可以将频率合起来创建新的周期。例如,用小时和分钟的组合来实现2小时30分钟:
print(pd.timedelta_range(0, periods=9, freq='2H30T'))
'''
TimedeltaIndex(['0 days 00:00:00', '0 days 02:30:00', '0 days 05:00:00',
                '0 days 07:30:00', '0 days 10:00:00', '0 days 12:30:00',
                '0 days 15:00:00', '0 days 17:30:00', '0 days 20:00:00'],
               dtype='timedelta64[ns]', freq='150T')
'''
所有这些代码都对应pandas时间序列的偏移量,具体内容可以在pd.tseries.offsets模块中找到,例如,可以用下面方法直接创建一个工作日偏移序列:
import pandas as pd
from pandas.tseries.offsets import BDay

print(pd.date_range('2022-02-01',periods=5, freq=BDay()))
'''
DatetimeIndex(['2022-02-01', '2022-02-02', '2022-02-03', '2022-02-04',
               '2022-02-07'],
              dtype='datetime64[ns]', freq='B')
'''
关于时间频率与偏移量的内容在pandas在线文档Date Offset objects
十、字符串操作
向量化字符串操作是对一个从网络采集来的杂乱无章的数据进行局部清理
10.1 Pandas字符串操作简介
前面介绍了NumPy和Pandas进行一般的运算操作,因此我们也可以简便快速地对多个数组元素执行同样的操作
import pandas as pd
import numpy as np

x = np.array([2,3,5,6,11,13])
x = x*2
print(x) # [ 4  6 10 12 22 26]
向量化操作简化了纯数值的数组操作语法,我们不用担心数组长度或维度,由于NumPy没有为字符串数组提供简单的接口,因此需要通过for循环来解决问题
data = ['peter','Paul','MARY','gUIDO']
for s in data:
    print(s.capitalize(), end=' ')  # Peter Paul Mary Guido
当某些数据中出现了缺失值,这样操作就会出现异常。比如下面的数组中有个None,会报错
#data = ['peter','Paul',None,'MARY','gUIDO']
#for s in data:
#    print(s.capitalize(), end=' ')
Pandas为包含字符串的Series和Index提供的str属性既可以满足向量化字符串操作的请求,可以正确处理缺失值
data = ['peter','Paul',None,'MARY','gUIDO']
names = pd.Series(data)
print(names)
'''
0    peter
1     Paul
2     None
3     MARY
4    gUIDO
dtype: object
'''
capitalize():首字母转换大写,缺失值会被忽略,直接输出缺失值None
print(names.str.capitalize())
'''
0    Peter
1     Paul
2     None
3     Mary
4    Guido
dtype: object
'''
10.2 Pandas字符串方法列表
10.2.1 与Python字符串方法类似的方法
下面表格列举了Pandas的str方法借鉴Python字符串方法的内容:
| len() | lower() | translatr() | islower() |
| ljust() | upter() | startswith() | isupper() |
| rjust() | find() | endswith() | isnumeric() |
| center() | rfind() | isalnum() | isdecimal() |
| zfill() | index() | isalpha() | split() |
| strip() | rindex() | isdigit() | rsplit() |
| rstrip() | capitalize() | isspace() | partition() |
| lstrip() | swapcase() | istitle() | rpartition() |
这些方法的返回值不同,例如lower()方法返回一个字符串Series
import pandas as pd
import numpy as np

monte = pd.Series(['Graham Chapman', 'John Cleese', 'Terry Gilliam', 'Eric Idle', 'Terry Jones', 'Mincheal Palin'])
print(monte.str.lower())
'''
0    graham chapman
1       john cleese
2     terry gilliam
3         eric idle
4       terry jones
5    mincheal palin
dtype: object
'''
但有些方法返回数值
print(monte.str.len())
'''
0    14
1    11
2    13
3     9
4    11
5    14
dtype: int64
'''
有些方法返回布尔值
print(monte.str.startswith('T'))
'''
0    False
1    False
2     True
3    False
4     True
5    False
dtype: bool
'''
还有些返回列表或其他复合值
print(monte.str.split())
'''
0    [Graham, Chapman]
1       [John, Cleese]
2     [Terry, Gilliam]
3         [Eric, Idle]
4       [Terry, Jones]
5    [Mincheal, Palin]
dtype: object
'''
10.2.2 使用正则表达式的方法
下表内容是Pandas向量化字符串方法根据Python标准库的re模块函数实现的API
| 方法 | 描述 |
|---|---|
| match() | 对每个元素调用re.match(),返回布尔值 |
| extract() | 对每个元素调用re.extract(),返回匹配的字符串组(groups) |
| findall() | 对每个元素调用re.findall() |
| replace() | 用正则模式替换字符串 |
| contains() | 对每个元素调用re.contains(),返回布尔值 |
| count() | 计算符合正则模式的字符串的数量 |
| split() | 等价于str.split(),支持正则表达式 |
| rsplit() | 等价于str.rsplit(),支持正则表达式 |
通过这些方法可以进行很多操作,例如,可以提取元素前面的连续字母做为每个人的名字
print(monte.str.extract('([A-Xa-z]+)'))
'''
0    Graham
1      John
2     Terry
3      Eric
4     Terry
5  Mincheal
'''
还可以实现复杂的操作,例如找出所有开头和结尾都是辅音字母的名字
print(monte.str.findall(r'^[^AEIOU].*[^aeiou]$'))
'''
0    [Graham Chapman]
1                  []
2     [Terry Gilliam]
3                  []
4       [Terry Jones]
5    [Mincheal Palin]
dtype: object
'''
10.2.3 其他字符串方法
Pandas字符串方法
| 方法 | 描述 |
|---|---|
| get() | 获取元素索引位置上的值,索引从0开始 |
| slice() | 对元素进行切片取值 |
| slice_replace() | 对元素进行切片替换 |
| cat() | 连接字符串(此功能复杂,建议阅读文档) |
| repeat() | 重复元素 |
| normalize() | 将字符串装换为Unicode规范形式 |
| pad() | 在字符串的左边、右边或者两边增加空格 |
| wrap() | 将字符串按照指定的宽度换行 |
| join() | 用分隔符连接Series的每个元素 |
| gett_dummies() | 按照分隔符提取每个元素的dummy变量,转换为独热编码的DataFrame |
向量化字符串的取值与切片操作
get()与slice()操作可以从每个字符串数组中获取向量化元素,例如可以通过str.slice(0,3)获取每个字符串数组的前三个字符,通过python的标准取值方法也可以达到一样效果,df.str.slice(0,3)等价于df.str[0:3]
monte = pd.Series(['Graham Chapman', 'John Cleese', 'Terry Gilliam', 'Eric Idle', 'Terry Jones', 'Mincheal Palin'])
print(monte.str[0:3])
'''
0    Gra
1    Joh
2    Ter
3    Eri
4    Ter
5    Min
dtype: object
'''
print(monte.str.slice(0,3))
'''
0    Gra
1    Joh
2    Ter
3    Eri
4    Ter
5    Min
dtype: object
'''
df.str.get(i)与df.str[i]的索引取值效果类似
get()与slice()操作可以在split()操作之后使用
print(monte.str.split().str.get(-1))
'''
0    Chapman
1     Cleese
2    Gilliam
3       Idle
4      Jones
5      Palin
dtype: object
'''
指标变量
get_dummies()方法可以快速将指标变量分割成一个独热编码的DataFrame(每个元素都是0或1)
monte = pd.Series(['Graham Chapman', 'John Cleese', 'Terry Gilliam', 'Eric Idle', 'Terry Jones', 'Mincheal Palin'])
full_monte = pd.DataFrame({'name':monte,'info':['B|C|D','B|D','A|C','B|D','B|C','B|C|D']})
print(full_monte)
'''
             name   info
0  Graham Chapman  B|C|D
1     John Cleese    B|D
2   Terry Gilliam    A|C
3       Eric Idle    B|D
4     Terry Jones    B|C
5  Mincheal Palin  B|C|D
'''
print(full_monte['info'].str.get_dummies('|'))
'''
   A  B  C  D
0  0  1  1  1
1  0  1  0  1
2  1  0  1  0
3  0  1  0  1
4  0  1  1  0
5  0  1  1  1
'''
Pandas在线文档“Working with Text Data”

