数据分析 | 特征重要性分析 | 树模型、SHAP值法
前言
在分析特征重要性的时候,相关性分析和主成分分析往往是比较简单的方法,相关性分析是通过计算特征与目标变量之间的相关系数来评估特征的重要性。它可以告诉我们特征和目标变量之间的线性关系程度,但对于非线性关系就无能为力了;主成分分析是一种降维技术,用于将高维特征数据转化为少数几个主成分。它可以帮助我们理解数据的主要变化模式,但却无法给出具体每个特征对目标变量的影响程度。
本文基于集成学习的方法介绍另外两种可以分析特征重要性的方法:树模型、SHAP值法。
数据集
本文使用的数据集为房价数据集,一共有20640个样本,8个特征,1个自变量,除了HouseAge是离散型变量,其余均为连续型变量。树模型分析重要性和贝叶斯优化时,均使用原始数据,SHAP值法时使用归一化后的数据。
 原始数据节选
TPE过程贝叶斯优化超参数寻优
集成学习中超参数设置一直是大问题,本文通过调用Optuna库进行TPE过程的贝叶斯优化,对三种树模型进行超参数寻优。代码如下:
import optuna
from sklearn.model_selection import KFold,cross_validate
import pandas as pd
import numpy as np
from sklearn.ensemble import GradientBoostingRegressor
from sklearn.tree import DecisionTreeRegressor
from sklearn.ensemble import RandomForestRegressor
import time
start_time = time.time()

# 读取数据
data = pd.read_csv(r'D:\2暂存文件\Sth with Py\重要性程度分析\data.csv')
X = data.iloc[:,[0, 1, 2, 3, 4, 5, 6, 7]]
y = data.iloc[:,8]

'''贝叶斯随机森林寻优'''
# 定义目标函数和参数空间
def optuna_objective(trial):
    # 定义参数空间
    n_estimators = trial.suggest_int('n_estimators', 10, 30, 1)
    max_depth = trial.suggest_int('max_depth', 10, 30, 1)
    max_features = trial.suggest_int('max_features', 10, 30, 1)

    # 定义评估器
    reg = RandomForestRegressor(n_estimators=n_estimators,
              max_depth=max_depth,
              max_features=max_features,
              random_state=1412,
              verbose=False,
              n_jobs=-1)

    # 定义交叉过程,输出负均方误差
    cv = KFold(n_splits=5, shuffle=True, random_state=1412)
    validation_loss = cross_validate(reg, X, y,
                                     scoring='neg_mean_squared_error',
                                     cv=cv,
                                     verbose=True,
                                     n_jobs=-1,
                                     error_score='raise')
    return np.mean(validation_loss['test_score'])

# 定义优化目标函数
def optimizer_optuna(n_trials):
    study = optuna.create_study(sampler=optuna.samplers.TPESampler(n_startup_trials=20, n_ei_candidates=30),
                                direction='maximize')
    study.optimize(optuna_objective, n_trials=n_trials, show_progress_bar=True)

    print('随机森林最优参数:\nbest_params:', study.best_trial.params,
          '随机森林最优得分:\nbest_score:', study.best_trial.values,
          '\n')

    return study.best_trial.params, study.best_trial.values

import warnings
warnings.filterwarnings('ignore',message='The objective has been evaluated at this point before trails')
optuna.logging.set_verbosity(optuna.logging.ERROR)
best_params, best_score = optimizer_optuna(100)

# 保存最优参数和最优得分到文件
with open(r'D:\2暂存文件\Sth with Py\重要性程度分析\随机森林贝叶斯优化结果.txt', 'w') as f:
    for key, value in best_params.items():
        f.write(f'{key}: {value}\n')
    f.write(f'Best Score: {best_score}\n')

'''贝叶斯决策树寻优'''
# 定义目标函数和参数空间
def optuna_objective(trial):
    # 定义参数空间
    max_depth = trial.suggest_int('max_depth', 10, 30, 1)
    min_samples_split = trial.suggest_int('min_samples_split',10,30,1)
    min_samples_leaf = trial.suggest_int('min_samples_leaf',10,30,1)
    max_features = trial.suggest_int('max_features', 10, 30, 1)

    # 定义评估器
    dtr = DecisionTreeRegressor(
        max_depth=max_depth,
        max_features=max_features,
        min_samples_split=min_samples_split,
        min_samples_leaf=min_samples_leaf,
        random_state=1412,)

    # 定义交叉过程,输出负均方误差
    cv = KFold(n_splits=5, shuffle=True, random_state=1412)
    validation_loss = cross_validate(dtr, X, y,
                                     scoring='neg_mean_squared_error',
                                     cv=cv,
                                     verbose=True,
                                     n_jobs=-1,
                                     error_score='raise')
    return np.mean(validation_loss['test_score'])

# 定义优化目标函数
def optimizer_optuna(n_trials):
    study = optuna.create_study(sampler=optuna.samplers.TPESampler(n_startup_trials=20, n_ei_candidates=30),
                                direction='maximize')
    study.optimize(optuna_objective, n_trials=n_trials, show_progress_bar=True)

    print('决策树最优参数:\nbest_params:', study.best_trial.params,
          '决策树最优得分:\nbest_score:', study.best_trial.values,
          '\n')

    return study.best_trial.params, study.best_trial.values

import warnings
warnings.filterwarnings('ignore',message='The objective has been evaluated at this point before trails')
optuna.logging.set_verbosity(optuna.logging.ERROR)
best_params, best_score = optimizer_optuna(100)

# 保存最优参数和最优得分到文件
with open(r'D:\2暂存文件\Sth with Py\重要性程度分析\决策树贝叶斯优化结果.txt', 'w') as f:
    for key, value in best_params.items():
        f.write(f'{key}: {value}\n')
    f.write(f'Best Score: {best_score}\n')

'''贝叶斯梯度提升树寻优'''


# 定义目标函数和参数空间
def optuna_objective(trial):
    # 定义参数空间
    max_depth = trial.suggest_int('max_depth', 3, 10)
    learning_rate = trial.suggest_float('learning_rate', 0.001, 0.1, log=True)
    n_estimators = trial.suggest_int('n_estimators', 50, 200)
    subsample = trial.suggest_float('subsample', 0.5, 1.0)

    # 定义评估器
    gbr = GradientBoostingRegressor(
        max_depth=max_depth,
        learning_rate=learning_rate,
        n_estimators=n_estimators,
        subsample=subsample,
        random_state=1412, )

    # 定义交叉过程,输出负均方误差
    cv = KFold(n_splits=5, shuffle=True, random_state=1412)
    validation_loss = cross_validate(gbr, X, y,
                                     scoring='neg_mean_squared_error',
                                     cv=cv,
                                     verbose=True,
                                     n_jobs=-1,
                                     error_score='raise')
    return np.mean(validation_loss['test_score'])


# 定义优化目标函数
def optimizer_optuna(n_trials):
    study = optuna.create_study(sampler=optuna.samplers.TPESampler(n_startup_trials=20, n_ei_candidates=30),
                                direction='maximize')
    study.optimize(optuna_objective, n_trials=n_trials, show_progress_bar=True)

    print('梯度提升树最优参数:\nbest_params:', study.best_trial.params,
          '梯度提升树最优得分:\nbest_score:', study.best_trial.value, '\n')

    return study.best_trial.params, study.best_trial.value

import warnings

warnings.filterwarnings('ignore', message='The objective has been evaluated at this point before trails')
optuna.logging.set_verbosity(optuna.logging.ERROR)
best_params, best_score = optimizer_optuna(100)

# 保存最优参数和最优得分到文件
with open(r'D:\2暂存文件\Sth with Py\重要性程度分析\梯度提升树贝叶斯优化结果.txt', 'w') as f:
    for key, value in best_params.items():
        f.write(f'{key}: {value}\n')
    f.write(f'Best Score: {best_score}\n')

# 结束计时
end_time = time.time()

# 输出执行时间
execution_time = end_time - start_time
print("模型训练执行时间: {:.2f}秒".format(execution_time))
决策树模型最优参数及最佳得分如下:
max_depth: 11、min_samples_split: 18、min_samples_leaf: 13、max_features: 12
Best Score: -0.24607607821335736
随机森林模型最优参数及最佳得分如下:
n_estimators: 30、max_depth: 19、max_features: 24
Best Score: -0.18016603147647478
梯度提升树模型最优参数及最佳得分如下:
max_depth: 9、learning_rate: 0.0418665547136736、n_estimators: 188、subsample: 0.676537978032126
Best Score: -0.16401985559476492
树模型
树模型,例如决策树和随机森林,能够通过对数据的划分建立一棵树形结构。它可以考虑不仅是线性关系,还包括非线性和交互作用。树模型不仅能够判断特征的重要性,还能够提供每个特征对目标变量的具体影响程度。通过这种方式,我们可以更好地理解和解释特征的重要性。另外,树模型还能够处理缺失值和离群点,使得分析结果更加鲁棒。此外,树模型还可以处理各种类型的特征,包括连续型、分类型以及文本型特征,具有很强的适应性。
其中源码和绘图结果如下:
import pandas as pd
import numpy as np
from sklearn.ensemble import RandomForestRegressor
from sklearn.tree import DecisionTreeRegressor
from sklearn.ensemble import GradientBoostingRegressor
import matplotlib.pyplot as plt
import time
plt.rcParams['font.sans-serif']=['SimHei'] # 把中文字体改成国际黑体
plt.rcParams['axes.unicode_minus'] = False # 显示负号
start_time = time.time()

# 读取数据
data = pd.read_csv(r'D:\2暂存文件\Sth with Py\重要性程度分析\data.csv')
X = data.iloc[0:5000,[0, 1, 2, 3, 4, 5, 6, 7]]
y = data.iloc[0:5000,8]


'''决策树'''
model_dtr = DecisionTreeRegressor(max_depth=11,
                                  min_samples_split=18,
                                  min_samples_leaf=13,
                                  max_features=12)
model_dtr.fit(X, y)
importances_dtr = model_dtr.feature_importances_

'''随机森林'''
model_rfr = RandomForestRegressor(n_estimators=30,max_depth=19,max_features=24)
model_rfr.fit(X, y)
importances_rfr = model_rfr.feature_importances_

'''梯度提升树'''
model_gbr = GradientBoostingRegressor(max_depth=9,learning_rate=0.0418665547136736,n_estimators=188,subsample=0.676537978032126)
model_gbr.fit(X, y)
importances_gbr = model_gbr.feature_importances_

# 创建特征名称列表
feature_names = ['MedInc','HouseAge','AveRooms','AveBedrms','Population','AveOccup','Latitude','Longitude']

# 将特征名称和重要性值进行配对
feature_importances_dtr = list(zip(feature_names, importances_dtr))
print('决策树特征重要性:',feature_importances_dtr)
feature_importances_rfr = list(zip(feature_names, importances_rfr))
print('\n随机森林特征重要性:',feature_importances_rfr)
feature_importances_gbr = list(zip(feature_names, importances_gbr))
print('\n梯度提升树特征重要性:',feature_importances_gbr)

'''绘图'''
tree = pd.read_excel(r'D:\2暂存文件\Sth with Py\重要性程度分析\树模型重要性.xlsx')
labels=["特征","Decision trees","Random Forest","GBDT","Average"]

# 把dataframe转换为list
x = tree['特征'].values.tolist()
y1 = tree['Decision trees'].values.tolist()
y2 = tree['Random Forest'].values.tolist()
y3 = tree['GBDT'].values.tolist()
y4 = tree['Average'].values.tolist()

plt.bar(x=np.arange(len(x))-0.2,height=y1,label="Decision trees",color="#AADCE0",width=0.1)
plt.bar(x=np.arange(len(x))-0.1,height=y2,label="Random Forest",color="#FFD06F",width=0.1)
plt.bar(x=x,height=y3,label="GBDT",color="#FFE6B7",width=0.1)
plt.bar(x=np.arange(len(x))+0.1,height=y4,label="Average",color="#E76254",width=0.1)

plt.legend(loc="upper right")
plt.xticks(x)
轴=plt.gca()
轴.set_xticklabels(x,rotation=45,ha="center")
图形=plt.gcf()
plt.xlabel('Feature',fontsize=15)
plt.ylabel('Importance',fontsize=15)
plt.title('Feature Importance',fontsize=18)
图形.subplots_adjust(left=0.1,bottom=0.3)
plt.savefig(r'D:\2暂存文件\Sth with Py\重要性程度分析\树模型重要性.png',dpi=600)
# 输出执行时间
end_time = time.time()
execution_time = end_time - start_time
print("模型训练执行时间: {:.2f}秒".format(execution_time))
plt.show()
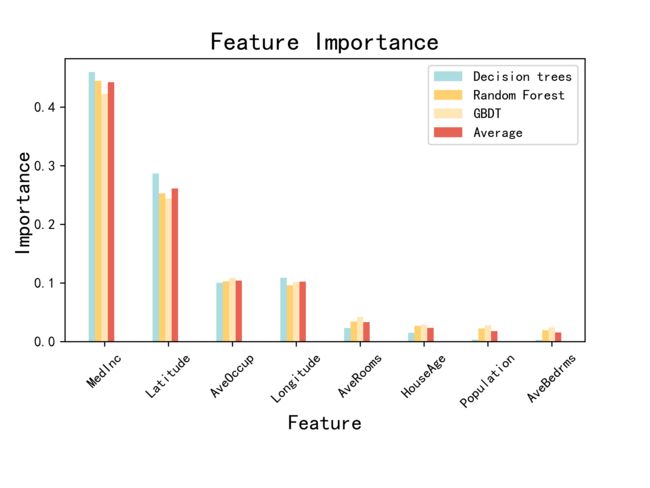 树模型重要性分析图
SHAP值法
SHAP值法采用了一种更为细致的方法来解释特征重要性。它通过计算每个特征对模型预测结果的贡献程度,从而揭示出特征之间的相互作用和非线性关系。这使得我们能够更全面地了解特征对目标的影响,而不仅仅局限于线性关系的分析。本文使用随机森林回归模型,其中数据使用归一化后的数据。代码和摘要图、特征重要性图如下:
import pandas as pd
import shap
from sklearn.preprocessing import MinMaxScaler
from sklearn.ensemble import RandomForestRegressor
import matplotlib.pyplot as plt
import time
plt.rcParams['font.sans-serif']=['SimHei'] # 把中文字体改成国际黑体
plt.rcParams['axes.unicode_minus'] = False # 显示负号

# 读取数据
normalized_data = pd.read_excel(r'D:\2暂存文件\Sth with Py\重要性程度分析\归一化数据.xlsx')
X = normalized_data.iloc[:,[0, 1, 2, 3, 4, 5, 6, 7]]
y = normalized_data.iloc[:,8]

start_time = time.time()

# 初始化随机森林模型
model = RandomForestRegressor(n_estimators=30,max_depth=19,max_features=24)

# 训练模型
model.fit(X, y)

# 创建一个Explainer对象
explainer = shap.Explainer(model)

# 计算SHAP值
shap_values = explainer.shap_values(X)

# 结束计时
end_time = time.time()

# 输出执行时间
execution_time = end_time - start_time
print("模型训练执行时间: {:.2f}秒".format(execution_time))

# 打印特征重要性得分
shap.summary_plot(shap_values, X)

# 打印每个特征的重要性图
shap.summary_plot(shap_values, X, plot_type="bar")
SHAP值摘要图
 SHAP值特征重要性图