Matlab(画图初阶)
目录
1.plot()函数
2. hold(添加新绘图是否保留旧绘图)
3. Plot Style
3.1 线型
3.2 标记
3.3 颜色
编辑
4. legend()
5.X 、Y and Title?
6. Text()和annotation()
7.line(创建基本线条)
7.1 基本语法
7.2 指定线条属性
7.3 更改线条属性
8.图像属性
8.1 获取对象属性
8.2 修改属性
8.2.1 修改轴的限制
8.2.2 设置轴的字体和刻度
8.2.3 修改线条格式以及宽度
8.3 标记规范
9.图像共存
9.1figure
9.2 subplot
9.3 控制网格、框和轴
10. 将数据保存在文件中
10.1 print()
首先我们要先对Matlab这款软件的画图功能给予肯定,画图功能太强大了,所以其也被广泛的应用到绘制图形,Matlab的画图功能有以下几个优点:
- 简单易用:提供了简洁的绘图接口
- 多样性:支持绘制各种类型的图形
- 灵活性:提供了丰富的图形参数和功能
- 交互性:可以通过鼠标交互式的探索和操作图形
- 高质量输出:绘制的图形具有较高的质量
来,我们开整!!!
1.plot()函数
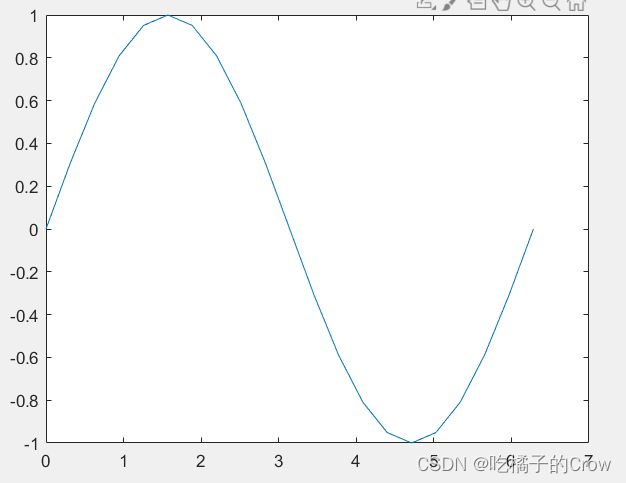
语法1:
plot(x,y)%创建y中数据对x中对应值的二维线图- 要绘制由线段连接的一组坐标,请将x和y指定为相同长度的向量
- 要将同一组坐标上绘制多组坐标,请将x或y中的至少一个指定为矩阵
>> x=0:pi/10:2*pi;
>> y=sin(x);
>> plot(x,y)
语法2:
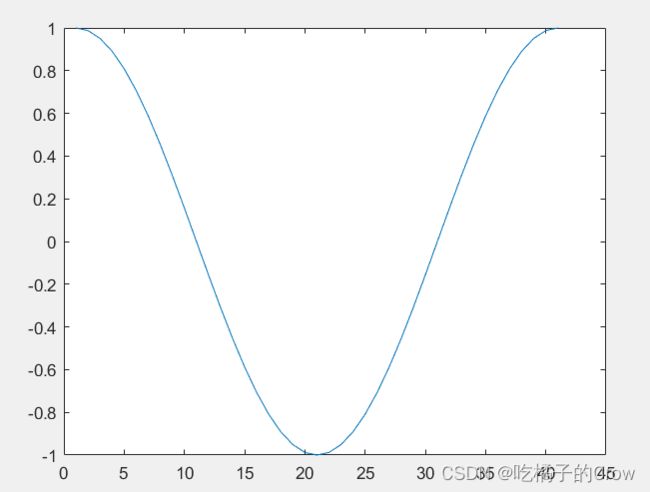
plot(y)%绘制y对一组隐式x的坐标- 如果y是向量,则x的坐标范围从1到length(y)
- 如果y是矩阵,则对于y中的每个列,图中包含一个对应的行
plot(cos(0:pi/20:2*pi))语法三:
plot(y,Linespec)%使用隐式x的坐标绘制y,并指定线型、标记和颜色>> x=0:pi/10:2*pi;
>> y=sin(x);
>> plot(y,'or:')2. hold(添加新绘图是否保留旧绘图)
hold on: 添加新绘图时保留旧绘图,新绘图基于坐标区的 ColorOrder 和 LineStyleOrder 属性使用后续的颜色和线型。
hold off(默认): 将保留状态设置为off,添加新绘图时,不会保留旧绘图,新添加到坐标区中的绘图清除现有绘图并重置所有的坐标区属性
我们现在单画一个图示例:
>> plot(y,'or:');
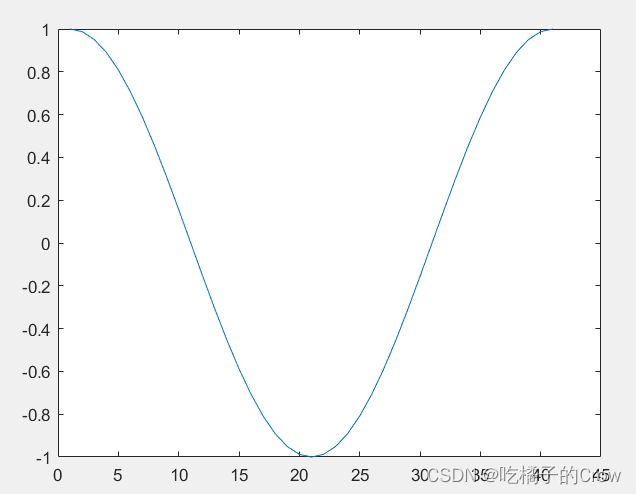
>> plot(cos(0:pi/20:2*pi))
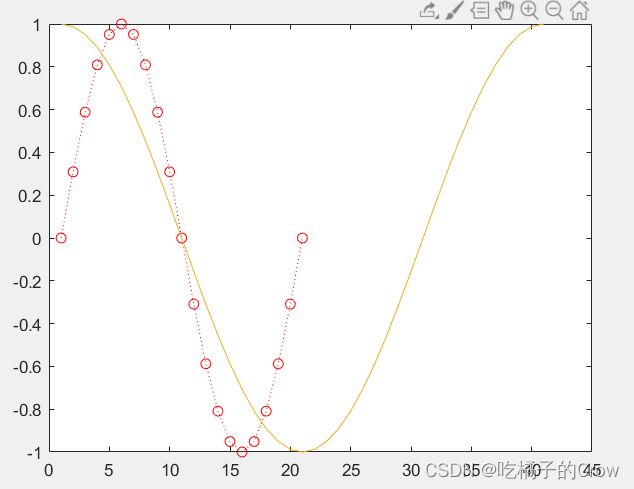
因为我们这个时候hold还是处于默认关闭状态,所以我们不能将两个图在一张画布上进行呈现,当我们打开后
>> hold on我们再运行上述代码,就会发现已经可以按照我们的预期呈现出来了
>> plot(y,'or:');
>> plot(cos(0:pi/20:2*pi))
3. Plot Style
使用str中定义的格式绘制每个向量对(x,y)
3.1 线型
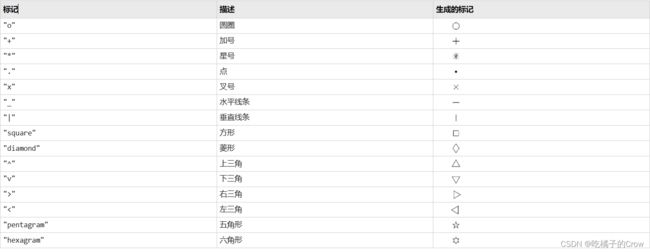
3.2 标记
3.3 颜色
4. legend()
在我们画图中的过程中,因为一块画布上我们 需要画很多个图形,那么怎么识别哪个图形是哪个函数的呢?legend()函数就完美解决了这个问题
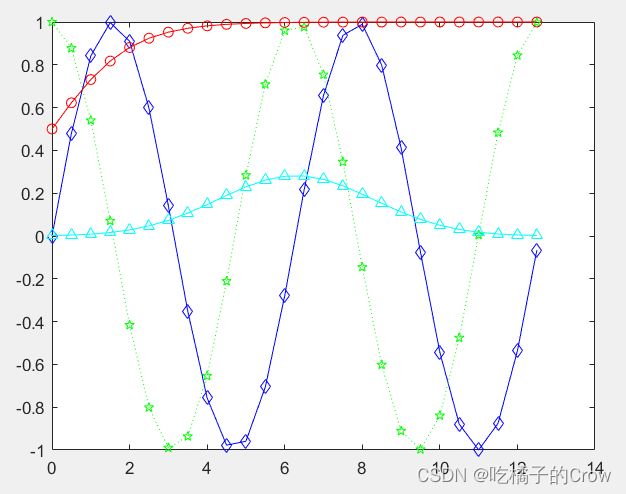
>> x=0:0.5:4*pi;
y=sin(x); h=cos(x); w=1./(1+exp(-x));
g=(1/(2*pi*2)^0.5).*exp((-1.*(x-2*pi).^2)./(2*2^2));
plot(x,y,'bd-',x,h,'gp:',x,w,'ro-',x,g,'c^-');
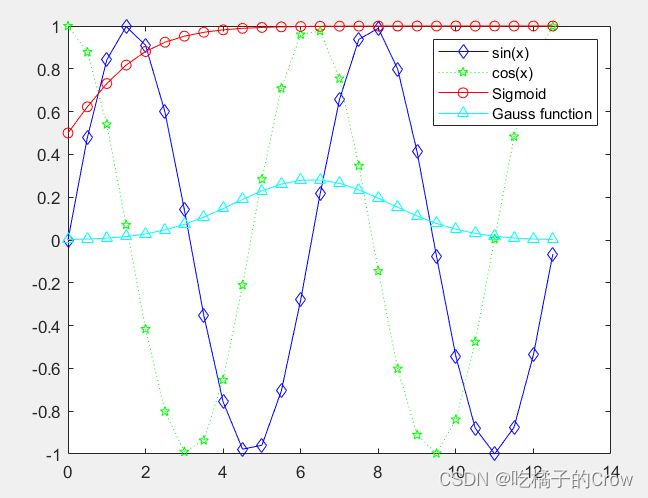
当我们加上legend()之后:
legend('sin(x)','cos(x)','Sigmoid','Gauss function');5.X 、Y and Title?
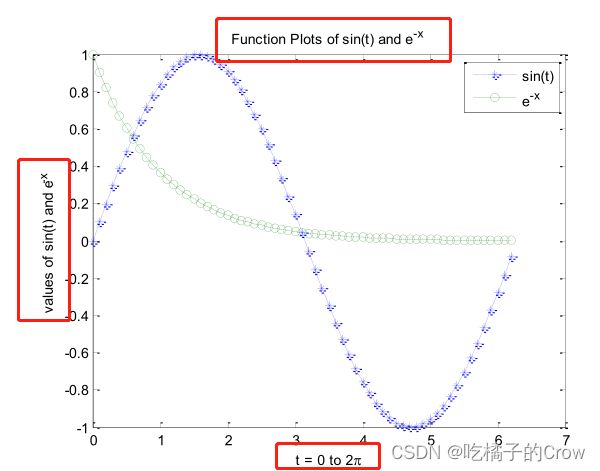
在画图中x轴、y轴和图名我们应该怎么去设置呢?
title()%标题
xlabel()%x坐标
ylabel()%y坐标
zlabel()%z坐标
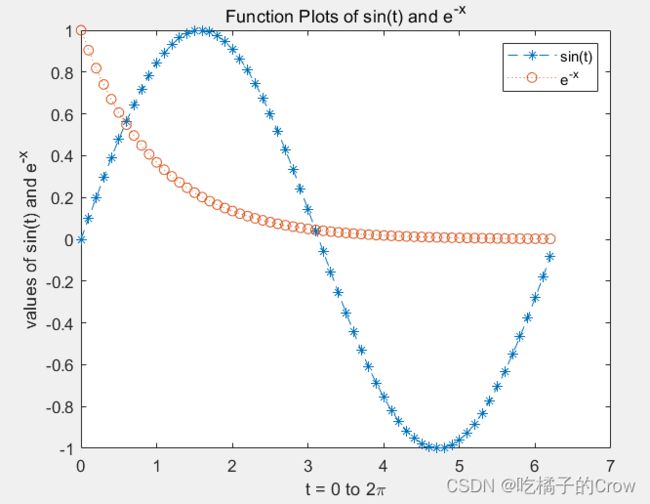
x = 0:0.1:2*pi; y1 = sin(x); y2 = exp(-x);
plot(x, y1, '--*', x, y2, ':o');
xlabel('t = 0 to 2\pi');%2π=2\pi
ylabel('values of sin(t) and e^{-x}')%e^-x =e^{-x}
title('Function Plots of sin(t) and e^{-x}');
legend('sin(t)','e^{-x}');6. Text()和annotation()
文本与数学表达式使用的是LaTex,它是一种专业的排版系统,其优点是:
- 专业的排版质量:LaTeX以其卓越的排版能力而闻名,通过使用LaTeX,用户可以创建高质量、格式美观的文档,自动处理字体样式、大小、段落布局、数学公式、引用等排版细节。
- 数学公式排版:LaTeX是科学和数学排版的首选工具,在排版复杂的数学公式和符号方面有着出色的表现。它提供了丰富的数学环境和符号库,使输入和排版数学公式更加容易。
- 逻辑结构化:LaTeX允许将文档轻松划分为章节,自动生成目录和页眉/页脚,便于管理大型文档。另外,结构化的章节划分可以提高文档的可读性和可维护性。
- 版本控制和协作:LaTeX文档本质上是纯文本文件,可与版本控制系统(如Git)集成,进行版本管理和协作编辑。这对于团队协作和多作者文档编写非常有用。
- 跨平台兼容性:基于TeX的LaTeX几乎可以在所有操作系统上运行,包括Windows、Mac和Linux。这使得轻易在不同操作系统上协作或分享LaTeX文档成为可能。
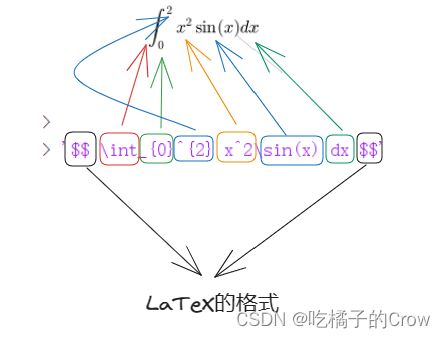
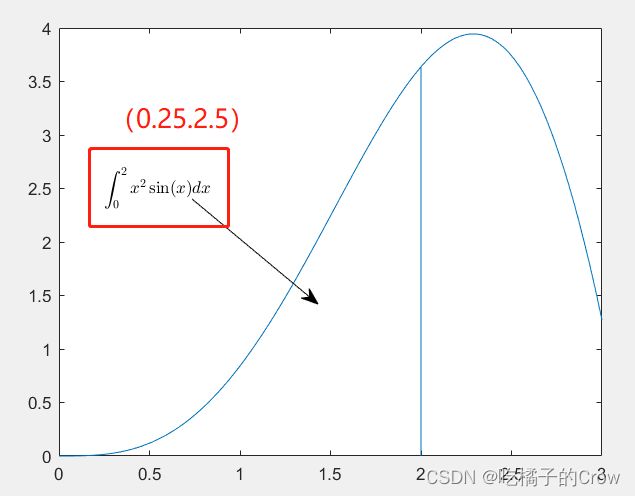
我们如果利用LaTeX去生成这么一个定积分式子?
x = linspace(0,3); y = x.^2.*sin(x); plot(x,y);
line([2,2],[0,2^2*sin(2)]);
str = '$$ \int_{0}^{2} x^2\sin(x) dx $$';
text(0.25,2.5,str,'Interpreter','latex');%(0.25,2.5)文本出现的位置
annotation('arrow','X',[0.32,0.5],'Y',[0.6,0.4]);%[0.32,0.5]x坐标从整个图形32%的地方到50%的地方(左->右) [0.6,0.4]y坐标从60%的地方到40%的地方(上->下)
7.line(创建基本线条)
7.1 基本语法
语法1:
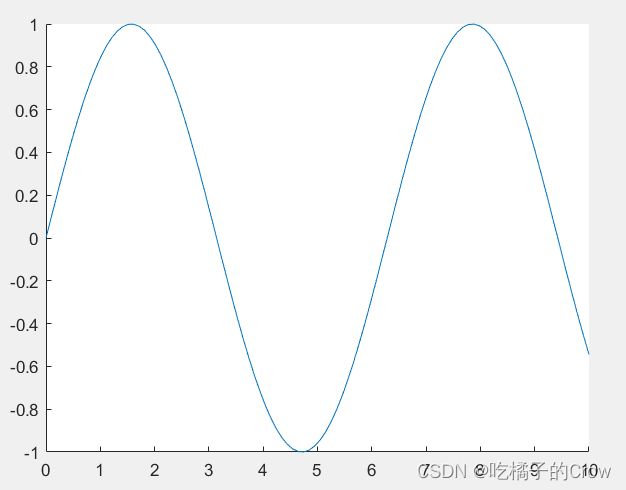
line(x,y) line(x,y) 使用向量 x 和 y 中的数据在当前坐标区中绘制线条。如果 x 和 y 中有一个是矩阵或两者都是矩阵,则 line 将绘制多个线条。与 plot 函数不同,line 会向当前坐标区添加线条,而不删除其他图形对象或重置坐标区属性
- 使用向量数据绘制线条
%以向量的形式创建x、y,然后绘制y对x的图
x = linspace(0,10);
y = sin(x);
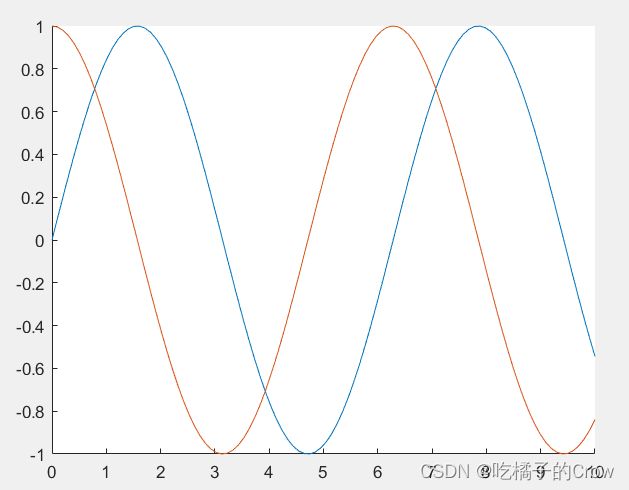
line(x,y)- 使用矩阵数据绘制多个线条
%通过将 x 和 y 指定为矩阵来绘制两个线条。使用 line 绘制 y 的列对 x 的列的单独线条。
x = linspace(0,10)';
y = [sin(x) cos(x)];
line(x,y)
语法2:
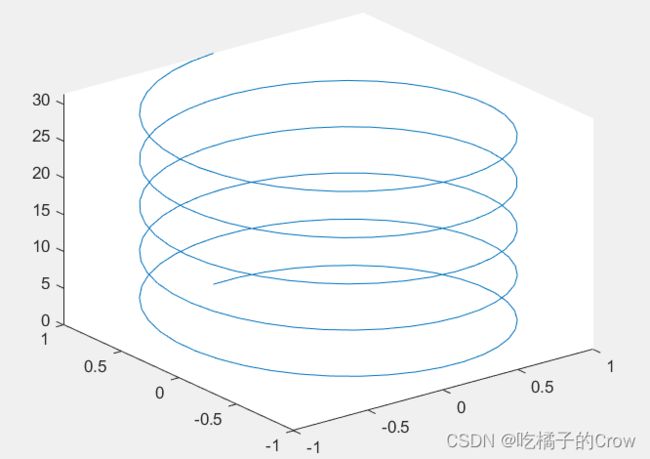
line(x,y,z) 在三维坐标中绘制线条。line(x,y,z) 在三维坐标中绘制线条。
%通过指定 x、y 和 z 的值,在三维坐标中绘制线条。使用 view(3) 将坐标区更改为三维视图。
t = linspace(0,10*pi,200);
x = sin(t);
y = cos(t);
z = t;
line(x,y,z)
view(3)
7.2 指定线条属性
我们想给绘制的线段加点颜色以及形状应该怎么操作?
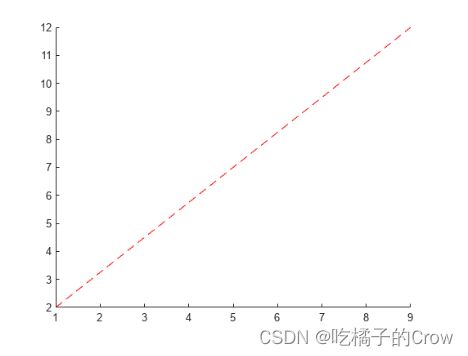
在点 (1,2) 和 (9,12) 之间绘制一条红色虚线。将
Color和LineStyle属性设置为名称-值对组。
x = [1 9];
y = [2 12];
line(x,y,'Color','red','LineStyle','--')
7.3 更改线条属性
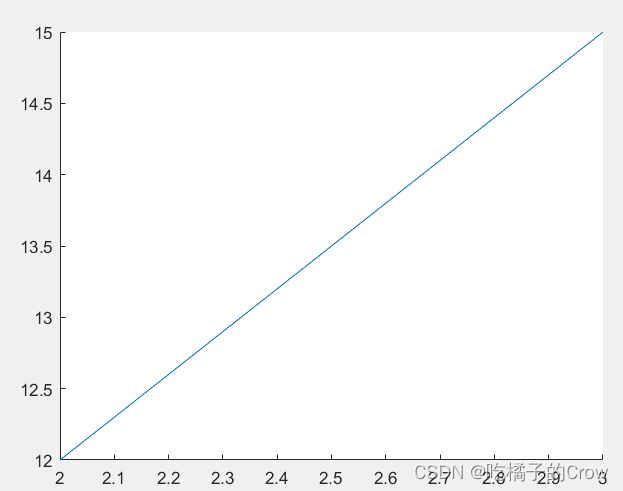
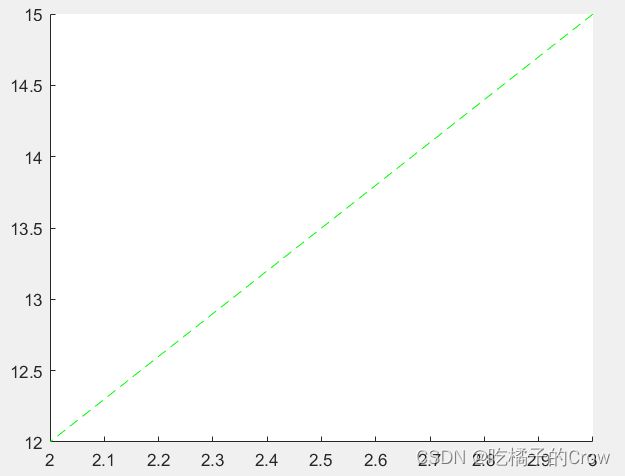
x = [3 2];
y = [15 12];
pl = line(x,y);
pl.Color = 'green';
pl.LineStyle = '--';8.图像属性
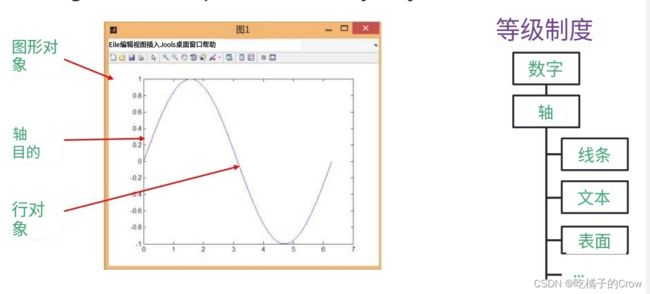
图形对象(万物皆可对象),图形是由许多物体组成的
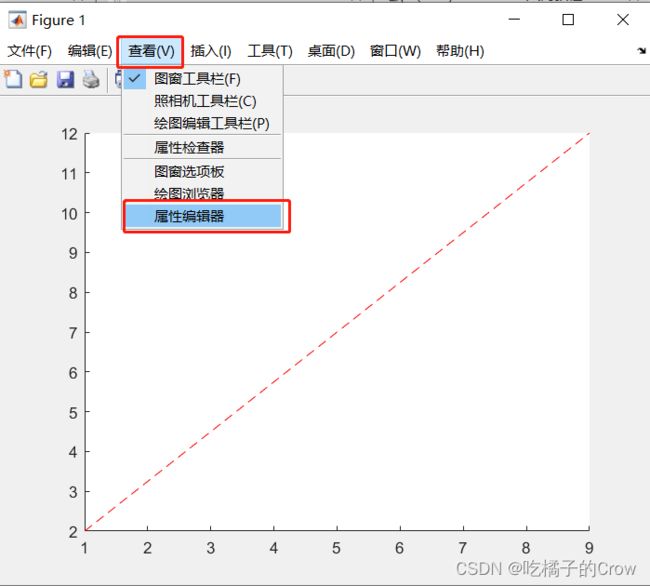
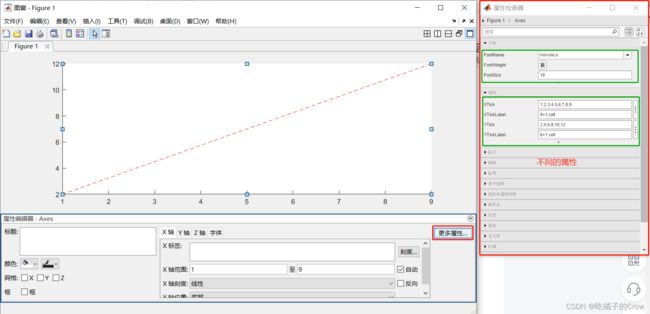
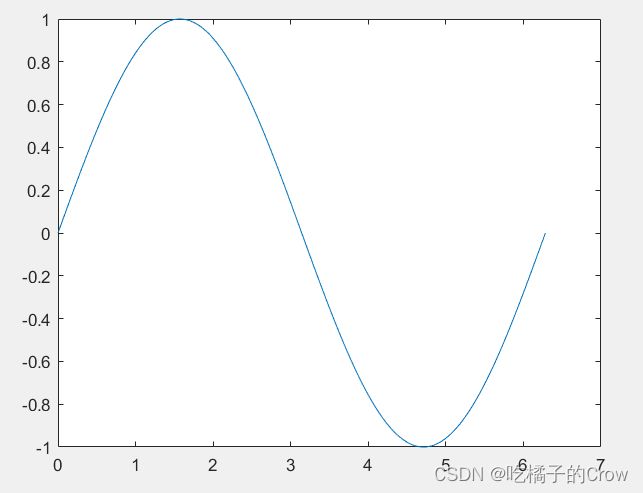
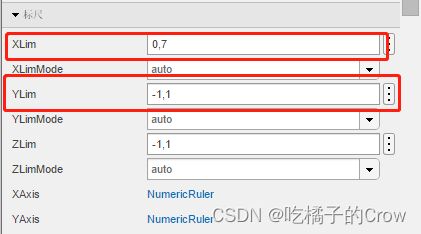
我们可以直接在图形界面进行查看:
一个图像有这么多属性,我们如何去修改其属性,使得图像变得更加具有观赏性呢?
gca:ax = gca 返回当前图窗中的当前坐标区(或独立可视化)。使用 ax 获取和设置当前坐标区的属性。如果当前图窗中没有坐标区或图,则 gca 会创建一个笛卡尔坐标区对象。
gcf:fig = gcfgcf 将创建一个图窗并返回其句柄。可以使用图窗句柄查询和修改图窗的属性。
8.1 获取对象属性
获取图形对象的属性:get()
>> x = linspace(0, 2*pi, 1000);
y = sin(x); h = plot(x,y);
获得h的属性:
>> get(h)
    AlignVertexCenters: 'off'
            Annotation: [1×1 matlab.graphics.eventdata.Annotation]
          BeingDeleted: 'off'
            BusyAction: 'queue'
         ButtonDownFcn: ''
              Children: [0×0 GraphicsPlaceholder]
              Clipping: 'on'
                 Color: [0 0.4470 0.7410]
             ColorMode: 'auto'
             CreateFcn: ''
       DataTipTemplate: [1×1 matlab.graphics.datatip.DataTipTemplate]
             DeleteFcn: ''
           DisplayName: ''
      HandleVisibility: 'on'
               HitTest: 'on'
         Interruptible: 'on'
              LineJoin: 'round'
             LineStyle: '-'
         LineStyleMode: 'auto'
             LineWidth: 0.5000
                Marker: 'none'
       MarkerEdgeColor: 'auto'
       MarkerFaceColor: 'none'
         MarkerIndices: [1×1000 uint64]
            MarkerMode: 'auto'
            MarkerSize: 6
                Parent: [1×1 Axes]
         PickableParts: 'visible'
              Selected: 'off'
    SelectionHighlight: 'on'
                   Tag: ''
                  Type: 'line'
         UIContextMenu: [0×0 GraphicsPlaceholder]
              UserData: []
               Visible: 'on'
                 XData: [1×1000 double]
             XDataMode: 'manual'
           XDataSource: ''
                 YData: [1×1000 double]
           YDataSource: ''
                 ZData: [1×0 double]
           ZDataSource: ''
获得坐标轴的属性:
>> get(gca)
                       ALim: [0 1]
                   ALimMode: 'auto'
     ActivePositionProperty: 'outerposition'
                 AlphaScale: 'linear'
                   Alphamap: [1×64 double]
          AmbientLightColor: [1 1 1]
               BeingDeleted: 'off'
                        Box: 'on'
                   BoxStyle: 'back'
                 BusyAction: 'queue'
              ButtonDownFcn: ''
                       CLim: [0 1]
                   CLimMode: 'auto'
             CameraPosition: [3.5000 0 17.3205]
         CameraPositionMode: 'auto'
               CameraTarget: [3.5000 0 0]
           CameraTargetMode: 'auto'
             CameraUpVector: [0 1 0]
         CameraUpVectorMode: 'auto'
            CameraViewAngle: 6.6086
        CameraViewAngleMode: 'auto'
                   Children: [1×1 Line]
                   Clipping: 'on'
              ClippingStyle: '3dbox'
                      Color: [1 1 1]
                 ColorOrder: [7×3 double]
            ColorOrderIndex: 2
                 ColorScale: 'linear'
                   Colormap: [256×3 double]
                  CreateFcn: ''
               CurrentPoint: [2×3 double]
            DataAspectRatio: [3.5000 1 1]
        DataAspectRatioMode: 'auto'
                  DeleteFcn: ''
                  FontAngle: 'normal'
                   FontName: 'Helvetica'
                   FontSize: 10
               FontSizeMode: 'auto'
              FontSmoothing: 'on'
                  FontUnits: 'points'
                 FontWeight: 'normal'
                  GridAlpha: 0.1500
              GridAlphaMode: 'auto'
                  GridColor: [0.1500 0.1500 0.1500]
              GridColorMode: 'auto'
              GridLineStyle: '-'
           HandleVisibility: 'on'
                    HitTest: 'on'
               Interactions: [1×1 matlab.graphics.interaction.interface.DefaultAxesInteractionSet]
              Interruptible: 'on'
    LabelFontSizeMultiplier: 1.1000
                      Layer: 'bottom'
                     Layout: [0×0 matlab.ui.layout.LayoutOptions]
                     Legend: [0×0 GraphicsPlaceholder]
             LineStyleOrder: '-'
        LineStyleOrderIndex: 1
                  LineWidth: 0.5000
             MinorGridAlpha: 0.2500
         MinorGridAlphaMode: 'auto'
             MinorGridColor: [0.1000 0.1000 0.1000]
         MinorGridColorMode: 'auto'
         MinorGridLineStyle: ':'
                   NextPlot: 'replace'
              OuterPosition: [0 0 1 1]
                     Parent: [1×1 Figure]
              PickableParts: 'visible'
         PlotBoxAspectRatio: [1 0.7882 0.7882]
     PlotBoxAspectRatioMode: 'auto'
                   Position: [0.1300 0.1100 0.7750 0.8150]
                 Projection: 'orthographic'
                   Selected: 'off'
         SelectionHighlight: 'on'
                 SortMethod: 'childorder'
                        Tag: ''
                    TickDir: 'in'
                TickDirMode: 'auto'
       TickLabelInterpreter: 'tex'
                 TickLength: [0.0100 0.0250]
                 TightInset: [0.0510 0.0527 0.0071 0.0200]
                      Title: [1×1 Text]
    TitleFontSizeMultiplier: 1.1000
            TitleFontWeight: 'normal'
                    Toolbar: [1×1 AxesToolbar]
                       Type: 'axes'
              UIContextMenu: [0×0 GraphicsPlaceholder]
                      Units: 'normalized'
                   UserData: []
                       View: [0 90]
                    Visible: 'on'
                      XAxis: [1×1 NumericRuler]
              XAxisLocation: 'bottom'
                     XColor: [0.1500 0.1500 0.1500]
                 XColorMode: 'auto'
                       XDir: 'normal'
                      XGrid: 'off'
                     XLabel: [1×1 Text]
                       XLim: [0 7]
                   XLimMode: 'auto'
                 XMinorGrid: 'off'
                 XMinorTick: 'off'
                     XScale: 'linear'
                      XTick: [0 1 2 3 4 5 6 7]
                 XTickLabel: {8×1 cell}
             XTickLabelMode: 'auto'
         XTickLabelRotation: 0
                  XTickMode: 'auto'
                      YAxis: [1×1 NumericRuler]
              YAxisLocation: 'left'
                     YColor: [0.1500 0.1500 0.1500]
                 YColorMode: 'auto'
                       YDir: 'normal'
                      YGrid: 'off'
                     YLabel: [1×1 Text]
                       YLim: [-1 1]
                   YLimMode: 'auto'
                 YMinorGrid: 'off'
                 YMinorTick: 'off'
                     YScale: 'linear'
                      YTick: [-1 -0.8000 -0.6000 -0.4000 -0.2000 0 0.2000 0.4000 0.6000 0.8000 1]
                 YTickLabel: {11×1 cell}
             YTickLabelMode: 'auto'
         YTickLabelRotation: 0
                  YTickMode: 'auto'
                      ZAxis: [1×1 NumericRuler]
                     ZColor: [0.1500 0.1500 0.1500]
                 ZColorMode: 'auto'
                       ZDir: 'normal'
                      ZGrid: 'off'
                     ZLabel: [1×1 Text]
                       ZLim: [-1 1]
                   ZLimMode: 'auto'
                 ZMinorGrid: 'off'
                 ZMinorTick: 'off'
                     ZScale: 'linear'
                      ZTick: [-1 0 1]
                 ZTickLabel: ''
             ZTickLabelMode: 'auto'
         ZTickLabelRotation: 0
                  ZTickMode: 'auto'
获得当前图窗的属性:
>> get(gcf)
                 Alphamap: [1×64 double]
             BeingDeleted: 'off'
               BusyAction: 'queue'
            ButtonDownFcn: ''
                 Children: [1×1 Axes]
                 Clipping: 'on'
          CloseRequestFcn: 'closereq'
                    Color: [0.9400 0.9400 0.9400]
                 Colormap: [256×3 double]
                CreateFcn: ''
              CurrentAxes: [1×1 Axes]
         CurrentCharacter: ''
            CurrentObject: [0×0 GraphicsPlaceholder]
             CurrentPoint: [0 0]
                DeleteFcn: ''
             DockControls: 'on'
                 FileName: ''
        GraphicsSmoothing: 'on'
         HandleVisibility: 'on'
            InnerPosition: [851.4000 158.6000 560 420]
            IntegerHandle: 'on'
            Interruptible: 'on'
           InvertHardcopy: 'on'
              KeyPressFcn: ''
            KeyReleaseFcn: ''
                  MenuBar: 'figure'
                     Name: ''
                 NextPlot: 'add'
                   Number: 1
              NumberTitle: 'on'
            OuterPosition: [844.2000 151.4000 574.4000 508.8000]
         PaperOrientation: 'portrait'
            PaperPosition: [3.0917 9.2937 14.8167 11.1125]
        PaperPositionMode: 'auto'
                PaperSize: [21.0000 29.7000]
                PaperType: 'A4'
               PaperUnits: 'centimeters'
                   Parent: [1×1 Root]
                  Pointer: 'arrow'
        PointerShapeCData: [16×16 double]
      PointerShapeHotSpot: [1 1]
                 Position: [851.4000 158.6000 560 420]
                 Renderer: 'opengl'
             RendererMode: 'auto'
                   Resize: 'on'
               Scrollable: 'off'
            SelectionType: 'normal'
           SizeChangedFcn: ''
                      Tag: ''
                  ToolBar: 'auto'
                     Type: 'figure'
            UIContextMenu: [0×0 GraphicsPlaceholder]
                    Units: 'pixels'
                 UserData: []
                  Visible: 'on'
      WindowButtonDownFcn: ''
    WindowButtonMotionFcn: ''
        WindowButtonUpFcn: ''
        WindowKeyPressFcn: ''
      WindowKeyReleaseFcn: ''
     WindowScrollWheelFcn: ''
              WindowState: 'minimized'
              WindowStyle: 'normal'
8.2 修改属性
8.2.1 修改轴的限制
修改图像的属性:set()
x = linspace(0, 2*pi, 1000);
y = sin(x); h = plot(x,y);
我们现在需要对坐标轴属性进行修改
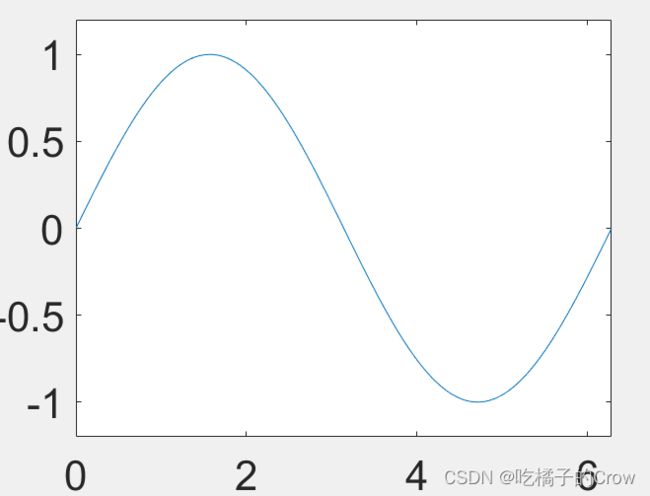
set(gca, 'XLim', [0, 2*pi]);
set(gca, 'YLim', [-1.2, 1.2]);
我们已经发现坐标轴已经有了明显的变化
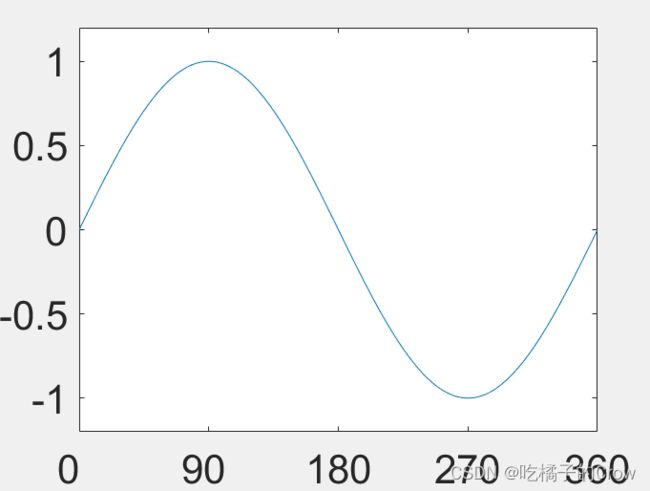
8.2.2 设置轴的字体和刻度
set(gca, 'FontSize', 25);>> set(gca, 'XTick', 0:pi/2:2*pi);
set(gca, 'XTickLabel', 0:90:360);8.2.3 修改线条格式以及宽度
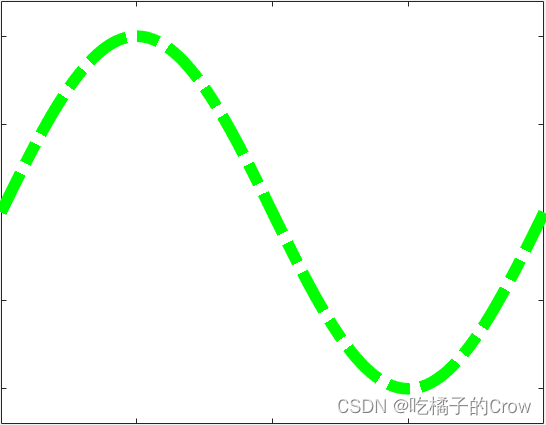
>> set(h, 'LineStyle', '-.',...
'LineWidth', 7.0, 'Color', 'g');
我们还可以使用这种方式进行替换:
plot(x,y, '-.g',...
'LineWidth', 7.0);
如果我们想删除这个图像怎么操作?
delete(h)这样是不是和你想的一样呢?
8.3 标记规范
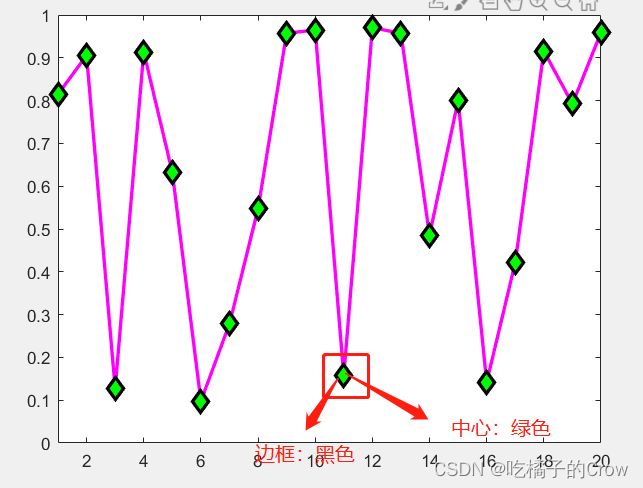
x=rand(20,1); set(gca, 'FontSize', 18);
plot(x,'-md','LineWidth', 2, 'MarkerEdgeColor', 'k',...
'MarkerFaceColor', 'g', 'MarkerSize', 10);
xlim([1, 20]);
9.图像共存
9.1figure
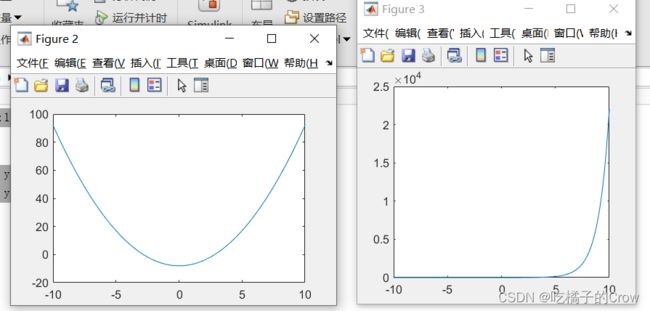
>> x = -10:0.1:10;
y1 = x.^2 - 8;
y2 = exp(x);
%创建两张画布
figure, plot(x,y1);
figure, plot(x,y2);
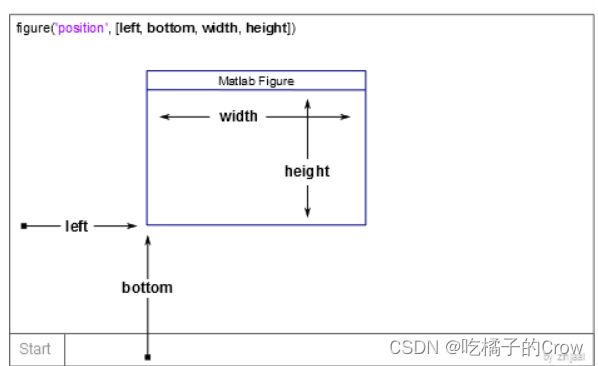
图像的位置和尺寸:
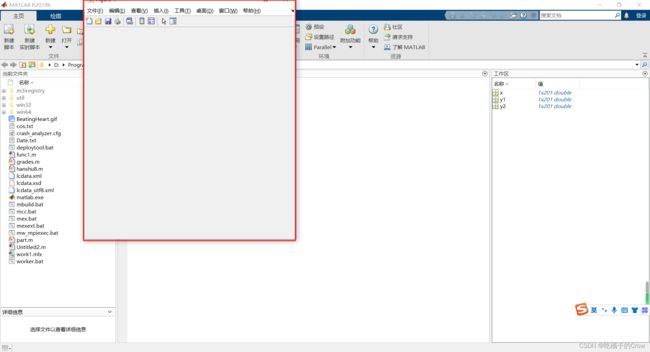
figure('Position', [left, bottom, width, height]);示例:
>> figure('Position',[200,300,500,500])9.2 subplot
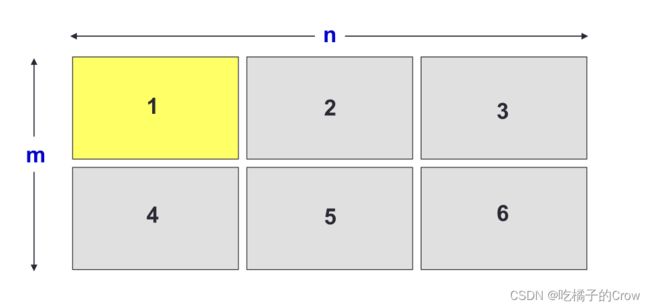
那我们可不可以在一张画布中分出几块区域分别进行存储:
subplot(m, n,1);示例:
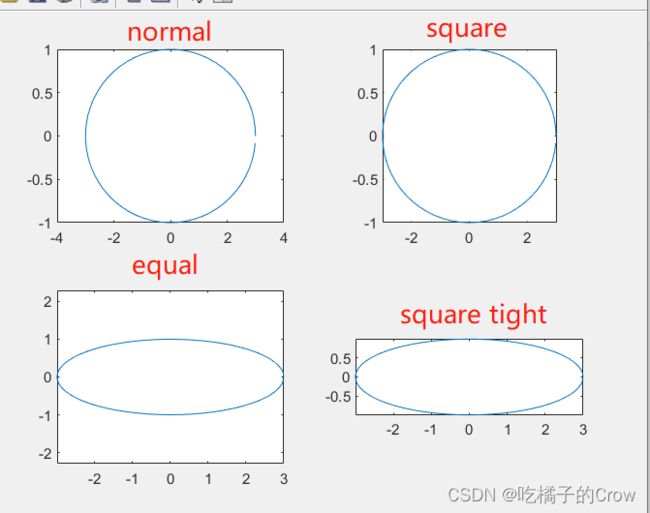
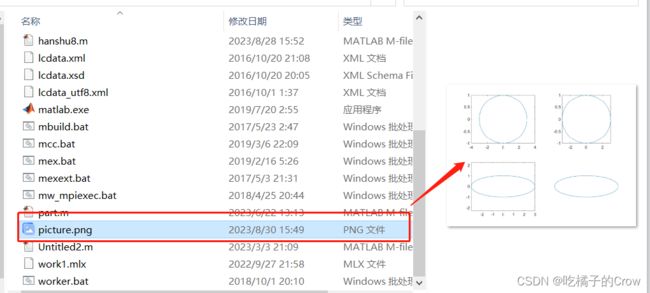
>> subplot(2, 2,1);>> t = 0:0.1:2*pi; x = 3*cos(t); y = sin(t);
subplot(2, 2, 1); plot(x, y); axis normal%还原默认行为
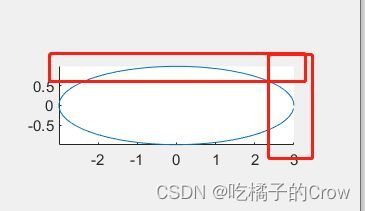
subplot(2, 2, 2); plot(x, y); axis square%使用相同长度的坐标轴线,相应调整数据单位之间的增量
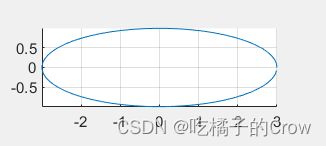
subplot(2, 2, 3); plot(x, y); axis equal%沿每个坐标轴使用相同的数据单位长度
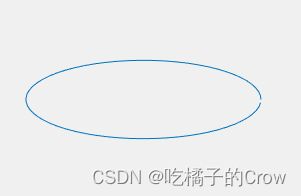
subplot(2, 2, 4); plot(x, y); axis equal tight%将坐标轴范围设置为等同数据范围,使轴框紧密围绕数据9.3 控制网格、框和轴
| grid on/off | 使网格可见或不可见 |
| box on/off | 使盒子可见或者不可见 |
| axis on/off | 使坐标轴可见或不可见 |
| axis normal | 自动调整轴的长宽和数据单位的相对缩放 |
| axis square | 使当前坐标区域为正方形 |
| axis equal | 设置高宽比,使数据单元在每个方向上都是相同的 |
| axis equal tight | 将轴限制设置为数据的范围 |
| axis image | 图框紧紧地围绕着数据 |
| axis ij | 将坐标系统的原点放在左上角 |
| axis xy | 把原点放在左下角 |
>> box offgrid on%网格>> axis off%使得坐标轴不可见10. 将数据保存在文件中
10.1print()
但是我们一般保存文件的时候用的最多的还是print()函数
print('picture','-dpng')- 语法1:
print(filename,formattype) 使用指定的文件格式将当前图窗保存到文件中,例如 print('BarPlot','-dpng')。如果该文件不包括扩展名,则 print 会附加适用的扩展名。
- 语法2:
print(filename,formattype,formatoptions)%指定可用于某些格式的其他选项。- 语法3:
print('-clipboard',clipboardformat)使用 clipboardformat 指定的格式将当前图窗复制到剪贴板。您可以将复制的图窗粘贴到其他应用程序中
- 语法4:
print(resolution,___)使用指定的分辨率。将分辨率指定为字符向量或字符串,其中包含以 -r 开头的整数值,例如 '-r200'。此选项可与先前语法中的任何输入参数一起使用。
