数学建模--逻辑回归算法的Python实现
首先感谢CSDN上发布吴恩达的机器学习逻辑回归算法任务的各位大佬.
通过大佬的讲解和代码才勉强学会.
这篇文章也就是简单记录一下过程和代码.
CSDN上写有关这类文章的大佬有很多,大家都可以多看一看学习学习.
机器学习方面主要还是过程和方法.
这篇文章只完成了线性可分方面的任务,由于时间关系,线性不可分的任务就没有去涉及.
若要深入学习请看这位大佬的文章:https://blog.csdn.net/Cowry5/article/details/80247569
目录
1.数据初始化
2.数据绘图可视化
3.设置关键函数
4.利用fmin_tnc函数进行拟合
5.计算模型正确率
6.计算绘制图形的决策边界
1.数据初始化
#%%
#导入必要的库和函数
import scipy.optimize as opt
import time
import numpy as np
import pandas as pd
import matplotlib.pyplot as plt
from torch import sigmoid
#获取数据并查阅
path="C:\\Users\\Zeng Zhong Yan\\Desktop\\py.vs\\.vscode\\数学建模\\逻辑回归模型材料包\\逻辑回归数据1.txt"
global data1
data=pd.read_csv(path,names=['exam_1','exam_2','admitted'])
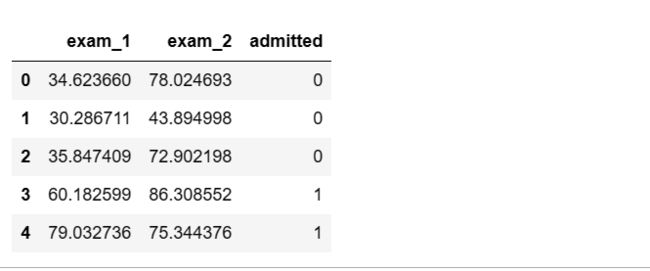
data.head()
2.数据绘图可视化
#%%
#利用.isin()函数将录取和未录取的样本分离
positive = data[data['admitted'].isin([1])]
negative = data[data['admitted'].isin([0])]
#然后进行可视化绘图
#fig用来绘制图像,ax绘制坐标系
fig,ax=plt.subplots(figsize=(10,4))
ax.scatter(positive['exam_1'], positive['exam_2'], s=30, c='b', marker='o', label='Admitted')
ax.scatter(negative['exam_1'], negative['exam_2'], s=30, c='r', marker='x', label='Not Admitted')
ax.legend()
ax.set_xlabel('Exam_1 Score')
ax.set_ylabel('Exam_2 Score')
ax.figure.savefig('C:\\Users\\Zeng Zhong Yan\\Desktop\\py.vs\\.vscode\\数学建模\\逻辑回归模型材料包\\逻辑回归散点分布.png', dpi=500, bbox_inches='tight')
#%%
3.设置关键函数
#创建逻辑回归类

    #创建激活函数
def sigmoid(x):
    y=1 / (1 + np.exp(-x))
    return y
    #创建一个函数检查一下其是否能够正常工作
    """
    x1 = np.arange(-10, 10, 0.1)
    plt.plot(x1, sigmoid(x1), c='r')
    plt.show()
    """
def cost(theta, X, y):
    first = (-y) * np.log(sigmoid(X @ theta))
    second = (1 - y)*np.log(1 - sigmoid(X @ theta))
    return np.mean(first - second)
if 'Ones' not in data.columns:
    data.insert(0, 'Ones', 1)
   #创建一个训练训练集
X = data.iloc[:, :-1].values
y = data.iloc[:, -1].values
theta = np.zeros(X.shape[1])
print(X.shape, theta.shape, y.shape)# ((100, 3), (3,), (100,))
def gradient(theta, X, y):
    return (X.T @ (sigmoid(X @ theta) - y))/len(X)
4.利用fmin_tnc函数进行拟合
#%%
"""
1.利用fmin_tnc函数进行拟合
2.或者利用minimize函数进行拟合,minimize中的method有很多的算法进行计算,设置method=xxx即可
"""
result = opt.fmin_tnc(func=cost, x0=theta, fprime=gradient, args=(X, y))
result
# (array([-25.16131867,   0.20623159,   0.20147149]), 36, 0)
5.计算模型正确率
#%%
"""
我们将theta训练完毕之后我们就能够利用模型来测试学生是否能被录取了
以下就是我们构造函数的过程,设置h(x)
如果h(x)=>0.5->能够被录取
如果h(x)<0.5->不能够被录取
根据以上书写预测函数
"""
"""
def predict(theta, X):
    probability = sigmoid(X@theta)
    for x in probability:
        if x>=0.5:
            return 1
        else:
            return 0
"""
def predict(theta, X):
    probability = sigmoid(X@theta)
    return [1 if x >= 0.5 else 0 for x in probability]  # return a list
#%%
"""
预测之后我们可以查看以下模型预测的正确率如何
"""
final_theta = result[0]
predictions = predict(final_theta, X)
correct = [1 if a==b else 0 for (a, b) in zip(predictions, y)]
accuracy = sum(correct) / len(X)
accuracy#0.89
6.计算绘制图形的决策边界
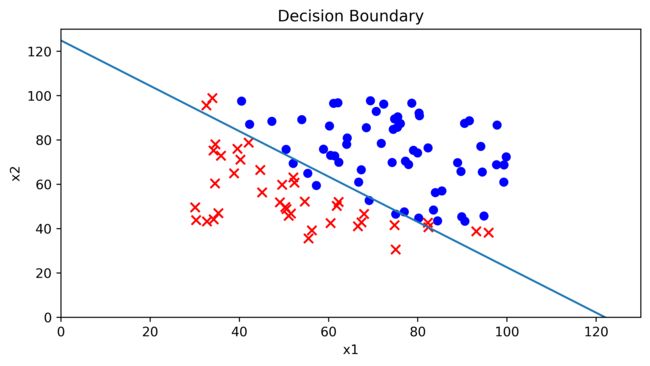
面我们将设置模型的决策边界
x1 = np.arange(130, step=0.1)
x2 = -(final_theta[0] + x1*final_theta[1]) / final_theta[2]
#%
fig, ax = plt.subplots(figsize=(8,4))
ax.scatter(positive['exam_1'], positive['exam_2'], c='b', label='Admitted')
ax.scatter(negative['exam_1'], negative['exam_2'], s=50, c='r', marker='x', label='Not Admitted')
ax.plot(x1, x2)
ax.set_xlim(0, 130)
ax.set_ylim(0, 130)
ax.set_xlabel('x1')
ax.set_ylabel('x2')
ax.set_title('Decision Boundary')
ax.figure.savefig('C:\\Users\\Zeng Zhong Yan\\Desktop\\py.vs\\.vscode\\数学建模\\逻辑回归模型材料包\\Decision Boundary.png', dpi=500, bbox_inches='tight')
#%%


