对西安交大轴承数据集XJTU-SY_Bearing_Datasets进行读取和处理:
对西安交大轴承数据集XJTU-SY_Bearing_Datasets进行读取和处理:
读取交大全寿命数据并显示
1.python
读取任意一个工况里的任意一个轴承数据的任意文件csv
#读取数据集的CSV文件并显示
import csv
import matplotlib.pyplot as plt

def csv_read(CSV_data,CSV_number):#第CSV_data工况,第CSV_number组轴承
    data_csv = []
    data_H = []#水平传感器测量的诊断数据的数组
    data_L = []#垂直传感器测量的诊断数据的数组
    CSV = [[123, 161, 158, 122, 52], [491, 161, 533, 42, 339], [2538, 2496, 371, 1515, 114]]#3种工况分别都有5个轴承,CSV数据集样本总数
    CSV_path = ["", "35Hz12kN", "37.5Hz11kN", "40Hz10kN"]
    #样本数
    # 35Hz12kN   1  1-123   2-161   3-158  4-122   5-52
    # 37.5Hz11kN 2  1-491   2-161   3-533  4-42    5-339
    # 40Hz10kN   3  1-2538  2-2496  3-371  4-1515  5-114
    path = "E://故障诊断//XJTU-SY_Bearing_Datasets//Data//XJTU-SY_Bearing_Datasets//" + CSV_path[CSV_data] + "//Bearing" + str(CSV_data) + "_" + str(CSV_number) + "//"
    print(path)
    for i in range(50,CSV[CSV_data-1][CSV_number-1]):#二维数组从0开始,显示部分周期修改range(里的1)
        csv_data=csv.reader(open(path+"%d.csv"% i,"r"))
        for list in csv_data:
            data_csv.append(list)
        for j in range(1, len(data_csv)):
            data_H.append(float(data_csv[j][1]))
            data_L.append(float(data_csv[j][0]))
        data_csv = []
    return data_H, data_L
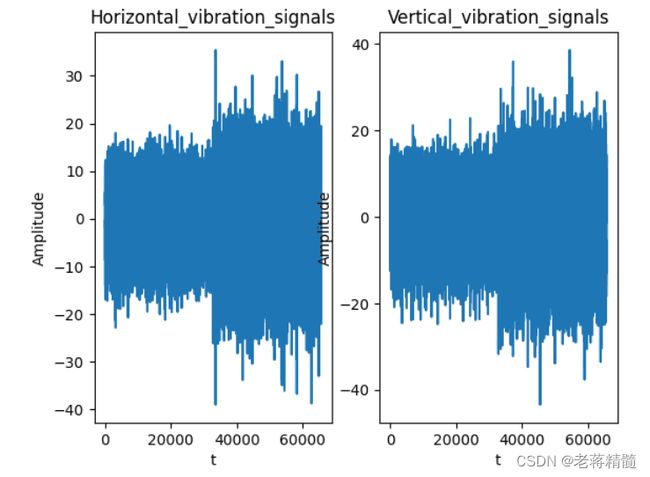
显式读取路径和图像
data1,data2=csv_read(1,5)#第一种工况,第5组轴承的数据
#显示全周期,非全周期则是在for i in range(50,CSV[CSV_data-1][CSV_number-1]):显示部分周期修改range(里的1)
import matplotlib.pyplot as plt
plt.figure()
plt.subplot(121)
plt.title("Horizontal_vibration_signals")
plt.ylabel("Amplitude")
plt.xlabel("t")
plt.plot(data1)
plt.subplot(122)
plt.title("Vertical_vibration_signals")
plt.ylabel("Amplitude")
plt.xlabel("t")
plt.plot(data2)
2.matlab读取全寿命数据
sort_nat.m文件(排序)
function [cs,index] = sort_nat(c,mode)
%sort_nat: Natural order sort of cell array of strings.
% usage:  [S,INDEX] = sort_nat(C)
%
% where,
%    C is a cell array (vector) of strings to be sorted.
%    S is C, sorted in natural order.
%    INDEX is the sort order such that S = C(INDEX);
%
% Natural order sorting sorts strings containing digits in a way such that
% the numerical value of the digits is taken into account.  It is
% especially useful for sorting file names containing index numbers with
% different numbers of digits.  Often, people will use leading zeros to get
% the right sort order, but with this function you don't have to do that.
% For example, if C = {'file1.txt','file2.txt','file10.txt'}, a normal sort
% will give you
%
%       {'file1.txt'  'file10.txt'  'file2.txt'}
%
% whereas, sort_nat will give you
%
%       {'file1.txt'  'file2.txt'  'file10.txt'}
%
% See also: sort

% Version: 1.4, 22 January 2011
% Author:  Douglas M. Schwarz
% Email:   dmschwarz=ieee*org, dmschwarz=urgrad*rochester*edu
% Real_email = regexprep(Email,{'=','*'},{'@','.'})


% Set default value for mode if necessary.
if nargin < 2
	mode = 'ascend';
end

% Make sure mode is either 'ascend' or 'descend'.
modes = strcmpi(mode,{'ascend','descend'});
is_descend = modes(2);
if ~any(modes)
	error('sort_nat:sortDirection',...
		'sorting direction must be ''ascend'' or ''descend''.')
end

% Replace runs of digits with '0'.
c2 = regexprep(c,'\d+','0');

% Compute char version of c2 and locations of zeros.
s1 = char(c2);
z = s1 == '0';

% Extract the runs of digits and their start and end indices.
[digruns,first,last] = regexp(c,'\d+','match','start','end');

% Create matrix of numerical values of runs of digits and a matrix of the
% number of digits in each run.
num_str = length(c);
max_len = size(s1,2);
num_val = NaN(num_str,max_len);
num_dig = NaN(num_str,max_len);
for i = 1:num_str
	num_val(i,z(i,:)) = sscanf(sprintf('%s ',digruns{i}{:}),'%f');
	num_dig(i,z(i,:)) = last{i} - first{i} + 1;
end

% Find columns that have at least one non-NaN.  Make sure activecols is a
% 1-by-n vector even if n = 0.
activecols = reshape(find(~all(isnan(num_val))),1,[]);
n = length(activecols);

% Compute which columns in the composite matrix get the numbers.
numcols = activecols + (1:2:2*n);

% Compute which columns in the composite matrix get the number of digits.
ndigcols = numcols + 1;

% Compute which columns in the composite matrix get chars.
charcols = true(1,max_len + 2*n);
charcols(numcols) = false;
charcols(ndigcols) = false;

% Create and fill composite matrix, comp.
comp = zeros(num_str,max_len + 2*n);
comp(:,charcols) = double(s1);
comp(:,numcols) = num_val(:,activecols);
comp(:,ndigcols) = num_dig(:,activecols);

% Sort rows of composite matrix and use index to sort c in ascending or
% descending order, depending on mode.
[unused,index] = sortrows(comp);
if is_descend
	index = index(end:-1:1);
end
index = reshape(index,size(c));
cs = c(index);
test.m文件
%% 批量读取IEEE PHM 2012轴承全寿命数据
clc
clear all
close all
file_path =  'E:\网盘下载\Data\XJTU-SY_Bearing_Datasets\35Hz12kN\Bearing1_1\';% 文件夹路径
%% 全寿命振动信号
csv_acc_path_list = dir(strcat(file_path,'*.csv'));%获取该文件夹中所有csv格式的文件
csv_order_name= sort_nat({csv_acc_path_list.name});
csv_acc_num = length(csv_acc_path_list);%获取文件总数量
if csv_acc_num > 0 %有满足条件的文件
        for j = 1:csv_acc_num %逐一读取文件
            csv_acc_name = csv_order_name(j);% 文件名
            csv_acc =  csvread(strcat(file_path,csv_acc_name{1,1}),1,0);
            csv_acc_data(:,:,j)=csv_acc;
            fprintf('%d %d %s\n',csv_acc_num,j,strcat(file_path,csv_acc_name{1,1}));% 显示正在处理的文件名
        end
end
% 合并矩阵 时间*通道
channel=2;   %信号的通道数
csv_acc_data_change=permute(csv_acc_data,[2 1 3]);
csv_acc_data=reshape(csv_acc_data_change,channel,prod(size(csv_acc_data))annel)';

%% 全寿命振动信号的时域图
clearvars -except csv_acc_data
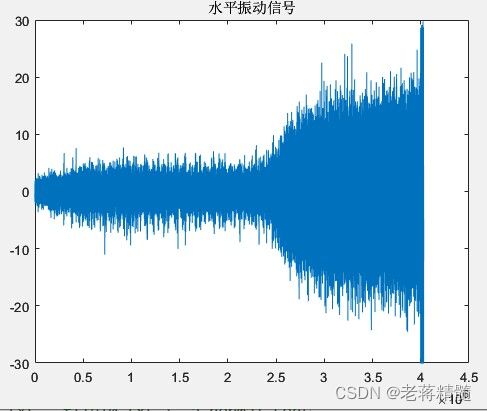
figure;plot(csv_acc_data(:,1));title('水平振动信号');set(gca,'YLim',[-30 30]);
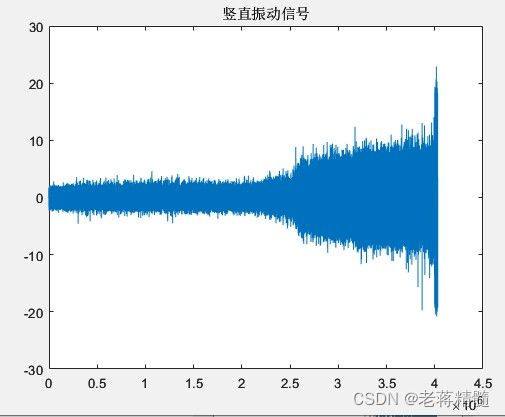
figure;plot(csv_acc_data(:,2));title('竖直振动信号');set(gca,'YLim',[-30 30]);
3.想做全寿命预测,但是思路正确,y不对
#全寿命预测,本程序不正确,因为第一列和第二列分别是水平和垂直振动数据,标签不是y
import pandas as pd
from sklearn.model_selection import train_test_split
from sklearn.linear_model import LinearRegression
#加载数据集
data = pd.read_csv("E:\\故障诊断\\XJTU-SY_Bearing_Datasets\\Data\\XJTU-SY_Bearing_Datasets\\40Hz10kN\\Bearing3_1\\1.csv")
#预处理,iloc[a:b,c]:取行索引从a到b-1,列索引为c的数据
X = data.iloc[:, :-1]#特征,所有行,选择第一列数据,水平振动数据
y = data.iloc[:, -1]#不是目标变量,所有行,并选择最后一列数据(垂直振动数据)


以下思路正确,但是标签不是y
#划分训练集和测试集
X_train, X_test, y_train, y_test = train_test_split(X, y, test_size=0.2, random_state=42)
#构建线性回归模型: 使用线性回归模型进行寿命预测
regressor = LinearRegression()
regressor.fit(X_train, y_train)
#全寿命预测
y_pred = regressor.predict(X_test)
#模型评估
from sklearn.metrics import mean_squared_error
mse = mean_squared_error(y_test, y_pred)
print("均方误差:", mse)
y = data.iloc[:, -1]#不是目标变量,所有行,并选择最后一列数据(垂直振动数据)
这个标签数据量需要改才能做预测,思路是正确的。


