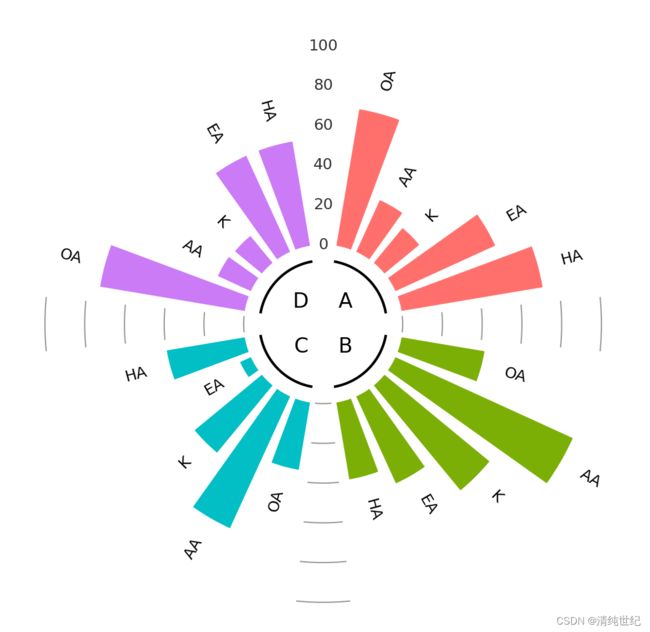
环状分组柱状图 Python
代码:
import matplotlib.pyplot as plt
import numpy as np


# 数据
np.random.seed(123)
group1 = 100 * np.random.rand(5)
group2 = 100 * np.random.rand(5)
group3 = 100 * np.random.rand(5)
group4 = 100 * np.random.rand(5)

groups = [group1, group2, group3, group4]
group_names = list('ABCD')
group_colors = ['#ff706d', '#7baf06', '#01bfc5', '#cb7bf6']


# 画图
fig = plt.figure(figsize=(8, 8), dpi=300, facecolor='white')
ax = fig.add_subplot(projection='polar')

ax.set_theta_zero_location("N")
ax.set_theta_direction(-1)

radii = [0]
colors = ['white']
for g, c in zip(groups, group_colors):
    radii.extend(g)
    colors.extend([c]*len(g))
    radii.append(0)
    colors.append('white')
radii.pop()
colors.pop()

N = len(radii)
r_lim = 180
scale_lim = 100
scale_major = 20
bottom = 40
theta = np.linspace(0.0, 2 * np.pi, N, endpoint=False)
width = 2 * np.pi / (N + 9)

# 画出柱状图
ax.bar(theta, radii, width=width, bottom=bottom, color=colors)

# 画出刻度
def scale(ax, bottom, scale_lim, theta, width):
    t = np.linspace(theta-width/2, theta+width/2, 6)
    for i in range(int(bottom), int(bottom+scale_lim+scale_major), scale_major):
        ax.plot(t, [i]*6, linewidth=0.25, color='gray', alpha=0.8)

# 画出刻度值
def scale_value(ax, bottom, theta, scale_lim):
    for i in range(int(bottom), int(bottom+scale_lim+scale_major), scale_major):
        ax.text(theta,
                i,
                f'{i-bottom}',
                fontsize=3,
                alpha=0.8,
                va='center',
                ha='center'
                )

s_list = []
g_no = 0
aa = ["OA","AA","K","EA","HA"]
for t, r in zip(theta, radii):
    if r == 0:
        s_list.append(t)
        if t == 0:
            scale_value(ax, bottom, t, scale_lim)
        else:
            scale(ax, bottom, scale_lim, t, width)
    else:
        t2 = np.rad2deg(t)
        # 标出每根柱的名称
        ax.text(t, r + bottom + scale_major*0.6,
                aa[g_no],
                fontsize=3,
                rotation=90-t2 if t < np.pi else 270-t2,
                rotation_mode='anchor',
                va='center',
                ha='left' if t < np.pi else 'right',
                color='black',
                clip_on=False
                )
        if g_no == (len(aa)-1):
            g_no = 0
        else:
            g_no += 1


s_list.append(2 * np.pi)

for i in range(len(s_list)-1):
    t = np.linspace(s_list[i]+width, s_list[i+1]-width, 50)
    ax.plot(t, [bottom-scale_major*0.4]*50, linewidth=0.5, color='black')
    ax.text(s_list[i]+(s_list[i+1]-s_list[i])/2,
            bottom-scale_major*1.2,
            group_names[i],
            va='center',
            ha='center',
            fontsize=4,
            )

ax.set_rlim(0, bottom+scale_lim+scale_major)
ax.axis('off')

plt.show()