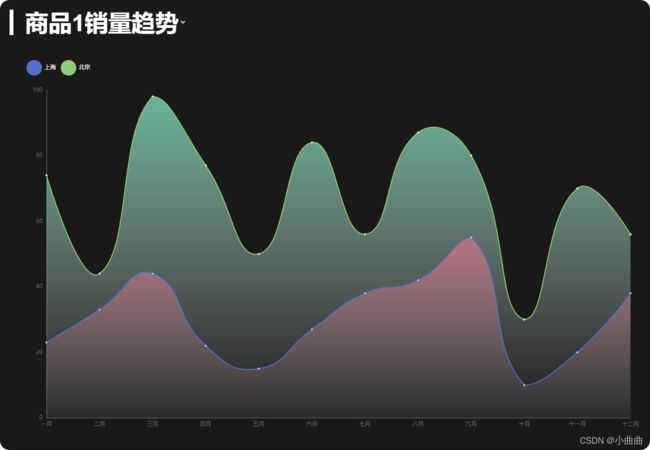
需求
- 下拉切换显示不同商品的销量趋势图
- 根据屏幕大小适配标题和图例的大小
- 折线图颜色填充
源码
<template>
<div class="w100 h100">
<div class="title">
<select
name=""
id=""
@change="onChange"
:style="`fontSize:${size}px;height:${size + 4}px`"
>
<option v-for="(v, k) in lineData" :key="k" :value="k">
{{ v.title }}
</option>
</select>
</div>
<div ref="line" class="w100 h100"></div>
</div>
</template>
<script>
import { ququ } from "../../public/static/theme/ququ";
export default {
props: {
msg: String,
},
data() {
return {
size: null,
lineChart: null,
lineData: {
goods1: {
title: "商品1销量趋势",
data: [
{
name: "上海",
data: [23, 33, 44, 22, 15, 27, 38, 42, 55, 10, 20, 38],
},
{
name: "北京",
data: [51, 11, 54, 55, 35, 57, 18, 45, 25, 20, 50, 18],
},
],
},
goods2: {
title: "商品2销量趋势",
data: [
{
name: "南京",
data: [23, 33, 66, 22, 15, 27, 38, 62, 55, 10, 20, 38],
},
{
name: "杭州",
data: [21, 11, 44, 22, 12, 27, 18, 42, 22, 10, 20, 18],
},
],
},
},
month: [
"一月",
"二月",
"三月",
"四月",
"五月",
"六月",
"七月",
"八月",
"九月",
"十月",
"十一月",
"十二月",
],
};
},
mounted() {
this.init();
this.getData();
window.addEventListener("resize", this.screenResize);
this.screenResize();
},
beforeDestroy() {
window.removeEventListener("resize", this.screenResize);
},
methods: {
init() {
this.$echarts.registerTheme("ququ", ququ);
this.lineChart = this.$echarts.init(this.$refs.line, "ququ");
let initOption = {
grid: {
top: "20%",
left: "5%",
right: "3%",
bottom: "5%",
containLabel: true,
},
xAxis: {
type: "category",
boundaryGap: false,
},
yAxis: {
type: "value",
},
legend: {
show: true,
top: 120,
left: 50,
icon: "circle",
textStyle: {
color: "#fff",
},
},
tooltip: {
trigger: "axis",
show: true,
},
};
this.lineChart.setOption(initOption);
},
onChange(e) {
this.getData(e.target.value);
},
getData(type) {
if (!type) {
type = Object.keys(this.lineData)[0];
}
let color1 = ["#fc97af", "#87f7cf", "#f7f494", "#72ccff", "#f7c5a0"];
let data = this.lineData[type].data;
let seriesArr = data.map((item, index) => {
return {
name: item.name,
type: "line",
stack: "Total",
data: item.data,
smooth: true,
areaStyle: {
color: new this.$echarts.graphic.LinearGradient(0, 0, 0, 1, [
{ offset: 0, color: color1[index] },
{ offset: 1, color: "rgba(255, 255, 255, 0.1)" },
]),
},
};
});
let dataOption = {
xAxis: {
data: this.month,
},
series: seriesArr,
};
this.lineChart.setOption(dataOption);
},
screenResize() {
this.$nextTick(() => {
let width = this.$refs.line.offsetWidth;
this.size = (width / 100) * 3.6;
let screenOption = {
legend: {
itemWidth: this.size / 1.5,
itemHeight: this.size / 1.5,
},
};
this.lineChart.setOption(screenOption);
this.lineChart.resize();
});
},
},
};
</script>
<style scoped lang="less">
.title {
position: absolute;
left: 20px;
top: 20px;
color: #fff;
z-index: 999;
select {
height: 40px;
background: transparent;
border: none;
color: white;
font-weight: 700;
padding-left: 20px;
border-left: 8px solid #fff;
line-height: 30px;
option {
background: #333;
}
}
}
</style>
