python列联表分析
python列联表分析,生成分类条形图,计算卡方,生成个案数据
########################################
#### 创建 个案数据 供 spss excel 这样的软件分析 #
########################################
import numpy as np
import pandas as pd
import matplotlib.pyplot as plt

hobby = np.array([[11, 12, 13], [21, 22, 23], [31, 32, 33]])
hobby2 = np.repeat(hobby, [20, 10, 2, 5, 20, 35, 2, 10, 20])
hobby2
r = np.mod(hobby2, 10)
c = np.floor(hobby2/10)

df = pd.DataFrame(zip(r, c), columns=['age', 'hobby'])
df

df.to_clipboard()

# pd.crosstab(hobby)
#
# pd.crosstab(df)
#
# df.groupby(['age', 'hobby']).value_counts()
# df

df.keys()
df.groupby(['age']).count()
df.groupby(['hobby']).count()
# df.groupby(['age', 'hobby']).count()

# df.pivot_table()

# pd.crosstab(df['age'])
pd.crosstab(index=df['age'], columns=df['hobby'], )

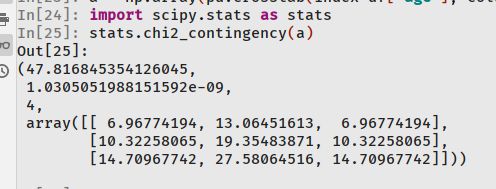
a = np.array(pd.crosstab(index=df['age'], columns=df['hobby']))

import scipy.stats as stats

stats.chi2_contingency(a)

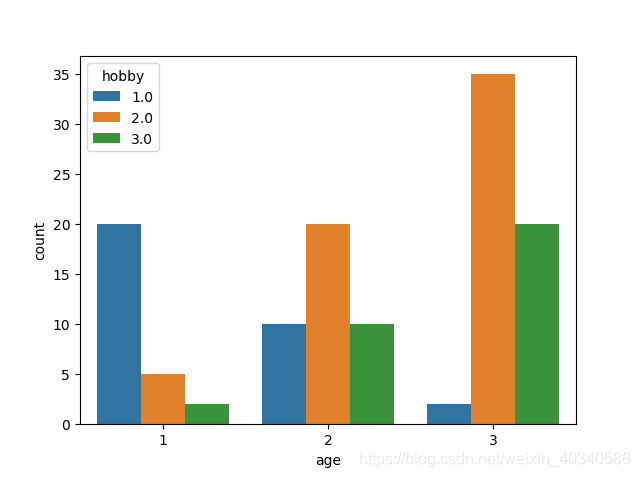
import seaborn as sns

sns.countplot(x=df['age'], hue=df['hobby'])
plt.xlabel(['laonian', 'zhognnian', 'qingnian'])
plt.ylabel(['xiqu', 'gewu', 'qiusai'])

g = sns.countplot(x = df['age'], hue=df['hobby'])
g.set_xlabel(['lao', 'zhogn', 'qing'])
# g.set_xtick(['lao', 'zhogn', 'qing'])


