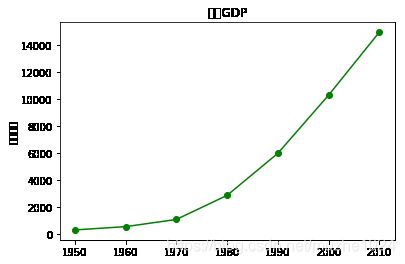
ubuntu下修改matplotlib显示图例的中文乱码(windows也试用)
社区很多教程修改中文乱码,都试过不成功,这里给出我的方法。其实就是改一下配置文件,让mat知道怎么显示中文

思路: 查找可用字体-----配置指定字体----ok
1.寻找matplotlib和Ubuntu都能用的中文字体 (原文源代码)
下面代码复制到jupyter notebook 运行
 __author__ = 'Katherine'
        from matplotlib.font_manager import FontManager
        import subprocess

    fm = FontManager()
    mat_fonts = set(f.name for f in fm.ttflist)

    output = subprocess.check_output(
        'fc-list :lang=zh -f "%{family}\n"', shell=True)
    output = output.decode('utf-8')
     print '*' * 10, '系统可用的中文字体', '*' * 10
     print output
    zh_fonts = set(f.split(',', 1)[0] for f in output.split('\n'))
    available = mat_fonts & zh_fonts
    print('*' * 10, '可用的字体', '*' * 10)
    for f in available:
    print(f)
输出为(基本是刚安装的中文字体):
********** 可用的字体 **********
Arial Unicode MS
2,如果没有可用字体,需要安装一下 这是宋体 下载中文字体simhei.ttf, 网址为http://fontzone.net/download/simhei
3.配置matplotlib字体文件
上面提到字体文件为matplotlibrc文件,搜索方法:
终端运行
$locate -b '\mpl-data'
返回类似 /home/py/.virtualenvs/ai/lib/python3.5/site-packages/matplotlib/mpl-data 路径
cd进去,找到matplotlibrc文件 gedit编辑
编辑此文件找到font.family, font.serif, font.sans-serif行,删除句首#,然后将上述可用字体添加进去并用 , 隔开。
(注意 所有都添加进去)
另外可能会碰到‘-’号的显示乱码 也是在配置文件中修改326行附近 为这样:axes.unicode_minus : False
4.删除cache
cd .cache/matplotlib/
然后 rm -r *
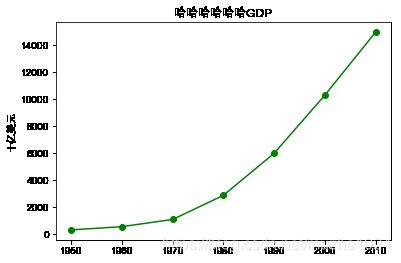
测试代码:
import matplotlib as  mpl
from matplotlib  import pyplot as plt
# mpl.rcParams[u'font.sans-serif'] = ['Arial Unicode MS']
mpl.rcParams['axes.unicode_minus'] = False
years = [1950, 1960, 1970, 1980, 1990, 2000, 2010]
gdp = [300.2, 543.3, 1075.9, 2862.5, 5979.6, 10289.7, 14958.3]
#创建一副线图,x轴是年份,y轴是gdp
plt.plot(years, gdp, color='green', marker='o', linestyle='solid')
#添加一个标题
plt.title('哈哈哈哈哈哈GDP')
#给y轴加标记
plt.ylabel('十亿美元')
plt.show()
参考:
1.How to Let Matplotlib Display Chinese Correctly
3.https://monkey0105.github.io/posts/2016/Dec/15/matplotlib_chinese_display/#3rd,findavailableChinesefontsbothinmatplotlibandubuntu
3 https://www.cnblogs.com/arkenstone/p/6411055.html

