数据分析案例-基于随机森林模型对信用卡欺诈检测
项目背景
信用卡欺诈是指故意使用伪造、作废的信用卡,冒用他人的信用卡骗取财物,或用本人信用卡进行恶意透支的行为,信用卡欺诈形式分为3种:失卡冒用、假冒申请、伪造信用卡。欺诈案件中,有60%以上是伪造信用卡诈骗,其特点是团伙性质,从盗取卡资料、制造假卡、贩卖假卡,到用假卡作案,牟取暴利。而信用卡欺诈检测是银行减少损失的重要手段。
数据介绍
部分数据如下
导入数据
import pandas as pd
import matplotlib.pyplot as plt
from sklearn.preprocessing import StandardScaler
from sklearn.model_selection import train_test_split
from sklearn.ensemble import RandomForestClassifier
from sklearn.metrics import confusion_matrix,accuracy_score,classification_report
import numpy as np
import warnings
warnings.filterwarnings('ignore')

data = pd.read_csv("creditcard.csv")
data.head()
Time V1 V2 V3 V4 V5 V6 V7 V8 V9 ... V21 V22 V23 V24 V25 V26 V27 V28 Amount Class
0 0.0 -1.359807 -0.072781 2.536347 1.378155 -0.338321 0.462388 0.239599 0.098698 0.363787 ... -0.018307 0.277838 -0.110474 0.066928 0.128539 -0.189115 0.133558 -0.021053 149.62 0
1 0.0 1.191857 0.266151 0.166480 0.448154 0.060018 -0.082361 -0.078803 0.085102 -0.255425 ... -0.225775 -0.638672 0.101288 -0.339846 0.167170 0.125895 -0.008983 0.014724 2.69 0
2 1.0 -1.358354 -1.340163 1.773209 0.379780 -0.503198 1.800499 0.791461 0.247676 -1.514654 ... 0.247998 0.771679 0.909412 -0.689281 -0.327642 -0.139097 -0.055353 -0.059752 378.66 0
3 1.0 -0.966272 -0.185226 1.792993 -0.863291 -0.010309 1.247203 0.237609 0.377436 -1.387024 ... -0.108300 0.005274 -0.190321 -1.175575 0.647376 -0.221929 0.062723 0.061458 123.50 0
4 2.0 -1.158233 0.877737 1.548718 0.403034 -0.407193 0.095921 0.592941 -0.270533 0.817739 ... -0.009431 0.798278 -0.137458 0.141267 -0.206010 0.502292 0.219422 0.215153 69.99 0查看数据大小
原始数据共有284807行,31列
数据清洗
删除缺失值和重复值
# 删除缺失值
data.dropna(inplace=True)
# 删除重复值
data.drop_duplicates(inplace=True)
data.shape
(283726, 31)经过数据清洗后还有283726行,31列数据
数据可视化
查看是否欺诈的数量比例
count_classes = pd.value_counts(data['Class'], sort = True).sort_index()
count_classes.plot(kind = 'bar')
plt.title("Fraud class histogram")
plt.xlabel("Class")
plt.ylabel("Frequency")
for x,y in enumerate(count_classes.values):
    plt.text(x,y+100,'%s' % y,ha='center',va='bottom')
plt.show()
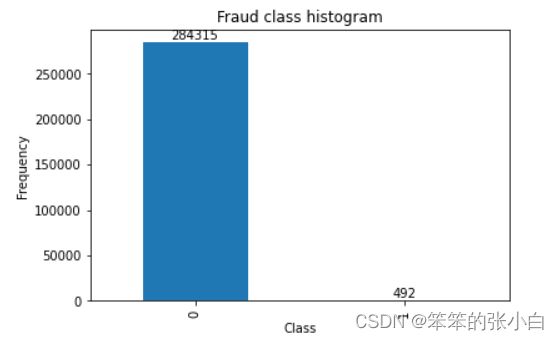
我们发现原始数据中欺诈的数量很少,只有492条,而没有欺诈的样本有284315条 ,
比例相差较大。
数据预处理
由于前面我们发现要分类的类别比例相差较大,所有这里我们要用到欠采样,也就是在类别0里面是数据随机取出与类别1数量想等的样本进行模型预测,然后对比没有进行欠采样和经过欠采样之后的对比。
# 准备数据
X = data.drop('Class',axis=1)
y = data['Class']

# 统计欺诈的数量及挑选出它的索引
number_records_fraud = len(data[data.Class == 1])
fraud_indices = np.array(data[data.Class == 1].index)
# 挑选出没有欺诈的索引
normal_indices = data[data.Class == 0].index
# 从没有欺诈中随机挑选出与欺诈数量想等的索引
random_normal_indices = np.random.choice(normal_indices, number_records_fraud, replace = False)
random_normal_indices = np.array(random_normal_indices)
# 合并两个数量想等的欺诈和非欺诈的索引
under_sample_indices = np.concatenate([fraud_indices,random_normal_indices])
# 根据其索引找到其对应的数据
under_sample_data = data.iloc[under_sample_indices,:]
under_sample_data
# 欠采样后的X Y
X_undersample = under_sample_data.drop('Class',1)
y_undersample = under_sample_data['Class']
当然这步我们也可以直接调用sklearn中的api直接使用
建立模型
首先需要划分数据集
# 划分原数据集
X_train, X_test, y_train, y_test = train_test_split(X,y,test_size = 0.3, random_state = 42)
# 划分经过欠采样后的数据集
X_train_undersample, X_test_undersample, y_train_undersample, y_test_undersample = train_test_split(X_undersample
                                                                                                   ,y_undersample
                                                                                                   ,test_size = 0.3
                                                                                                   ,random_state = 42)
接着建立随机森林模型
# 用原始数据训练模型
rfc1 = RandomForestClassifier(n_estimators=100)
rfc1.fit(X_train,y_train)
y_pred = rfc1.predict(X_test)
print('模型准确率',accuracy_score(y_test,y_pred))
print(confusion_matrix(y_test,y_pred))
print(classification_report(y_test,y_pred))
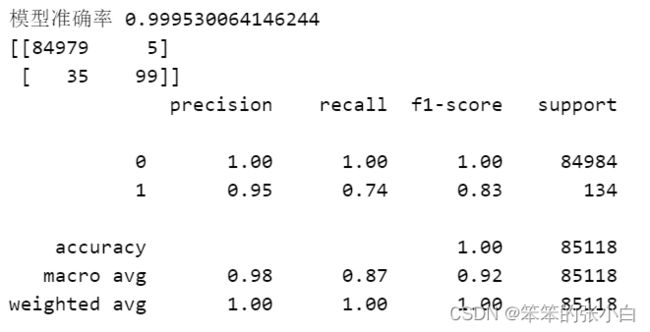
首先这是原始数据,也就是没有经过欠采样的数据来进行建立模型的。模型准确率为99.9%,准确率很高,但是不要被这表面迷惑了,因为从分类报告中我们看出,有与0类别的样本数量很大,所有0类别的准确率和召回率都是100%,而1类别的准确率就降下来了,尤其是召回率,只有74%。接下来用我们欠采样后的数据进行建模看看。
# 用欠采样数据训练模型
rfc2 = RandomForestClassifier(n_estimators=100)
rfc2.fit(X_train_undersample,y_train_undersample)
y_pred = rfc2.predict(X_test_undersample)
print('模型准确率',accuracy_score(y_test_undersample,y_pred))
print(confusion_matrix(y_test_undersample,y_pred))
print(classification_report(y_test_undersample,y_pred))
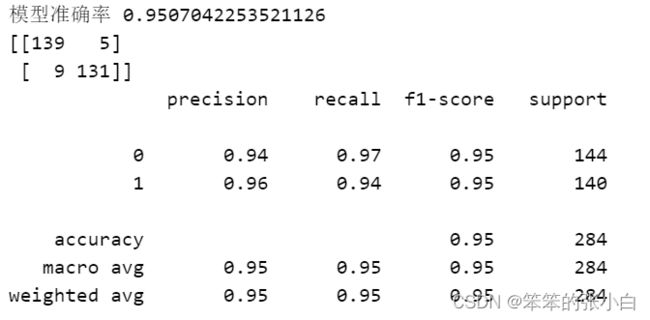
从模型结果我们看出模型的准确率为95%,也还是很高的,而且从分类报告中,两个类别的准确率和召回率都很高,模型的适用性更强。
总结
在分类问题中,目标分类的种类比例差别过大,就必须要进行处理,要么欠采样,要么过采样,这里我们讲的是欠采样。这样我们训练出来的模型才更有价值,适用性才更高。


