Monocle 3 | 太牛了!单细胞必学R包!~(一)(预处理与降维聚类)
1写在前面
忙碌的一周结束了,终于迎来周末了。
这周的手术真的是做到崩溃,2天的手术都过点了。
真的希望有时间静下来思考一下。
最近的教程可能会陆续写一下Monocle 3,炙手可热啊,欢迎大家分享经验。
2用到的包
rm(list = ls())
library(tidyverse)
library(monocle3)
3示例数据
这里我们用一下准备好的示例数据,出自这篇paper:
https://www.science.org/doi/10.1126/science.aam8940 IF: 56.9 Q1

expression_matrix <- readRDS("./cao_l2_expression.rds")
cell_metadata <- readRDS("./cao_l2_colData.rds")
gene_annotation <- readRDS("./cao_l2_rowData.rds")

cds <- new_cell_data_set(expression_matrix,
                         cell_metadata = cell_metadata,
                         gene_metadata = gene_annotation)

cds

4预处理一下
这里我们过滤一下表达太低的细胞。
cds <- preprocess_cds(cds, num_dim = 100)
cds
plot_pc_variance_explained(cds)

5细胞聚类
默认使用UMAP哦,当然你也可以选t-SNE。
这里有个使用的小技巧,umap.fast_sgd = T可以加速哦,但是能会导致每次运行结果有轻微的差异,仁者见仁吧。
cds <- reduce_dimension(cds,
                        core = 8,
                        umap.fast_sgd = T)
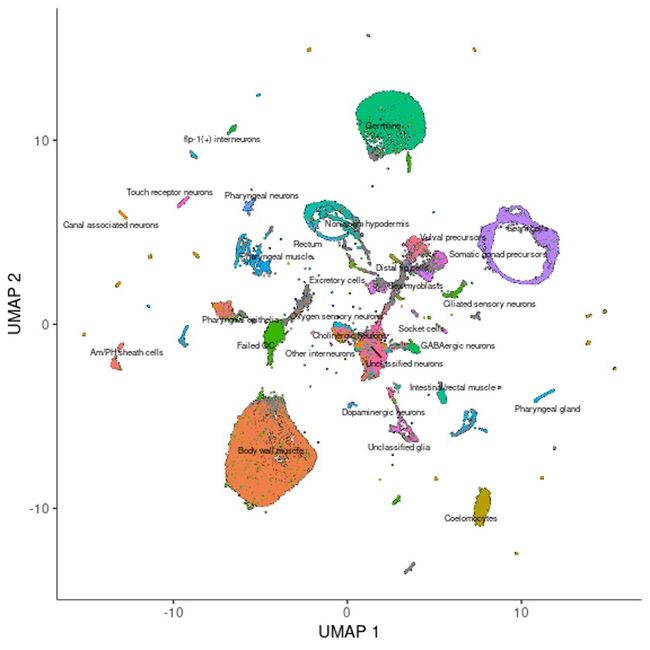
每个点代表一个细胞,注释的话推荐大家手动注释哦。
color_cells_by其实可以是任何一个列名。
plot_cells(cds, color_cells_by="cao_cell_type")
接着我们试试用一组基因来试试。
plot_cells(cds, genes=c("cpna-2", "egl-21", "ram-2", "inos-1"))

6去除批次效应
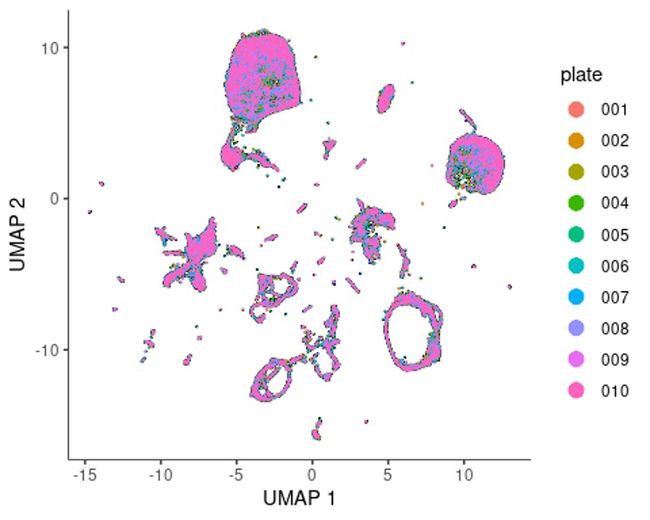
我们先看一下板子的降维情况。
可以看到批次效应并不是很明显。
plot_cells(cds, color_cells_by="plate", label_cell_groups=F)

接着我们去除一下batch试试,需要用到align_cds。
cds <- align_cds(cds, num_dim = 100, alignment_group = "plate")

cds <- reduce_dimension(cds)

plot_cells(cds, color_cells_by="plate", label_cell_groups=FALSE)
7细胞聚类
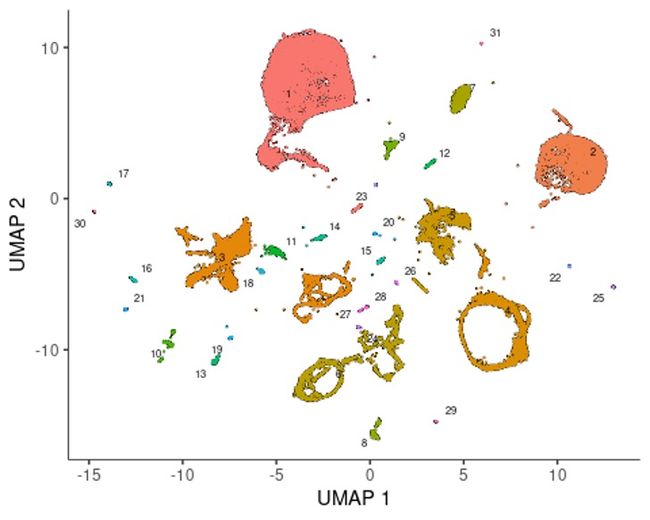
cds <- cluster_cells(cds, resolution=1e-5)

plot_cells(cds)

经过cluster_cells处理后,细胞会被分为partition,大家可以根据partition可视化一下。
plot_cells(cds, color_cells_by="partition", group_cells_by="partition")
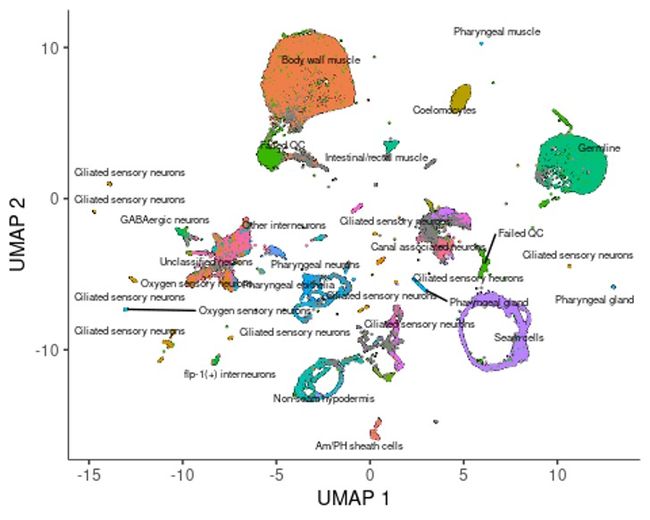
我们再试试根据细胞类型注释给细胞配色。
plot_cells(cds, color_cells_by="cao_cell_type")
8寻找marker gene
marker_test_res <- top_markers(cds, group_cells_by="partition",
                               reference_cells=1000, cores=8)
给结果排个序,这个就根据你自己的需要好了。
这里我们根据pseudo_R2试试。
top_specific_markers <- marker_test_res %>%
                            filter(fraction_expressing >= 0.10) %>%
                            group_by(cell_group) %>%
                            top_n(1, pseudo_R2)

top_specific_marker_ids <- unique(top_specific_markers %>% pull(gene_id))
plot_genes_by_group(cds,
                    top_specific_marker_ids,
                    group_cells_by="partition",
                    ordering_type="maximal_on_diag",
                    max.size=3)

实际操作中,我们不可能只看一个marker,多做几个试试吧(考验电脑了)。
top_specific_markers <- marker_test_res %>%
                            filter(fraction_expressing >= 0.10) %>%
                            group_by(cell_group) %>%
                            top_n(3, pseudo_R2)

top_specific_marker_ids <- unique(top_specific_markers %>% pull(gene_id))

plot_genes_by_group(cds,
                    top_specific_marker_ids,
                    group_cells_by="partition",
                    ordering_type="cluster_row_col",
                    max.size=3)

点个在看吧各位~ ✐.ɴɪᴄᴇ ᴅᴀʏ 〰
LASSO | 不来看看怎么美化你的LASSO结果吗!?
chatPDF | 别再自己读文献了!让chatGPT来帮你读吧!~
WGCNA | 值得你深入学习的生信分析方法!~
ComplexHeatmap | 颜狗写的高颜值热图代码!
ComplexHeatmap | 你的热图注释还挤在一起看不清吗!?
Google | 谷歌翻译崩了我们怎么办!?(附完美解决方案)
scRNA-seq | 吐血整理的单细胞入门教程
NetworkD3 | 让我们一起画个动态的桑基图吧~
RColorBrewer | 再多的配色也能轻松搞定!~
rms | 批量完成你的线性回归
CMplot | 完美复刻Nature上的曼哈顿图
Network | 高颜值动态网络可视化工具
boxjitter | 完美复刻Nature上的高颜值统计图
linkET | 完美解决ggcor安装失败方案(附教程)
......



本文由 mdnice 多平台发布