Echarts3单仪表盘和多仪表盘
一. 简介
ECharts,一个使用 JavaScript 实现的开源可视化库,可以流畅的运行在 PC 和移动设备上,兼容当前绝大部分浏览器(IE8/9/10/11,Chrome,Firefox,Safari等),底层依赖矢量图形库 ZRender,提供直观,交互丰富,可高度个性化定制的数据可视化图表。
二. 特性
1. 丰富的可视化类型
ECharts 提供了常规的折线图、柱状图、散点图、饼图、K线图,用于统计的盒形图,用于地理数据可视化的地图、热力图、线图,用于关系数据可视化的关系图、treemap、旭日图,多维数据可视化的平行坐标,还有用于 BI 的漏斗图,仪表盘,并且支持图与图之间的混搭。
除了已经内置的包含了丰富功能的图表,ECharts 还提供了自定义系列,只需要传入一个renderItem函数,就可以从数据映射到任何你想要的图形,更棒的是这些都还能和已有的交互组件结合使用而不需要操心其它事情。
2. 自定义主题构建
你可以在下载界面下载包含所有图表的构建文件,如果只是需要其中一两个图表,又嫌包含所有图表的构建文件太大,也可以在在线构建中选择需要的图表类型后自定义构建。
三. 示例
1. 首先引入 ECharts
通过标签方式直接引入构建好的 echarts 文件
<html>
<head>
    <meta charset="utf-8">

    <script src="echarts.min.js">script>
head>
html>
2. 为 ECharts 准备一个具备高宽的 DOM 容器
<body>

    <div id="myChart" style="width: 600px;height:400px;">div>
body>
3. 实例化生成
通过 echarts.init 方法初始化一个 echarts 实例,并通过 setOption 方法生成一个简单的仪表盘,下面是完整代码。
(1)常规单仪表盘
<html>
<head>
    <meta charset="utf-8">
    <title>EChartstitle>

    <script src="echarts.min.js">script>
head>
<body>

    <div id="main" style="width: 600px;height:400px;">div>
    <script type="text/javascript">
        // 基于准备好的dom,初始化echarts实例
        var myChart = echarts.init(document.getElementById('myChart'));

        // 指定图表的配置项和数据
        var option = {
			tooltip: {
			        formatter: '{a}
{b} : {c}KM/H'
			    },
			    toolbox: {
			        feature: {
			            restore: {},
			            saveAsImage: {}
			        }
			    },
			    series: [
			        {
			            name: '速度指标',
			            type: 'gauge',
			            detail: {formatter: '{value}KM/H'},
			            data: [{value: 50, name: '速度'}]
			        }
			  ]
		};

        // 使用刚指定的配置项和数据显示图表。
        myChart.setOption(option);
    script>
body>
html>
效果图
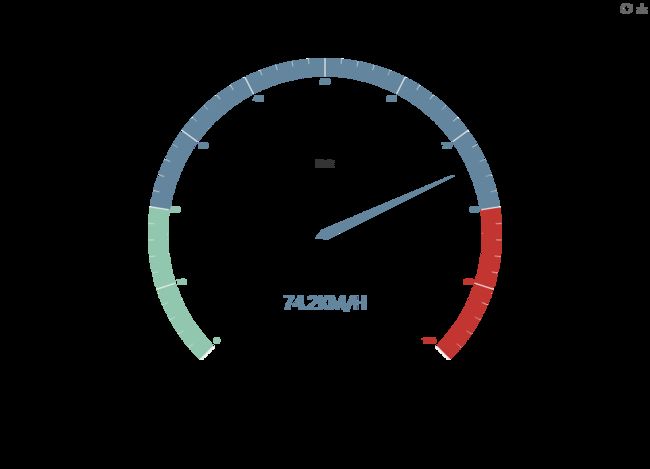
(2)自定义属性单仪表盘
<html>
<head>
    <meta charset="utf-8">
    <title>EChartstitle>

    <script src="echarts.min.js">script>
head>
<body>

    <div id="main" style="width: 600px;height:400px;">div>
    <script type="text/javascript">
        // 基于准备好的dom,初始化echarts实例
        var myChart = echarts.init(document.getElementById('myChart'));

        // 指定图表的配置项和数据
        var option = {
		    tooltip : {//提示框浮层属性
		        show: true,
		        transitionDuration:0.8,//提示框浮层的移动动画过渡时间,单位是 s,设置为 0 的时候会紧跟着鼠标移动。
		        formatter: "{a} - {c}KM/H"//提示框浮层内容格式器,支持字符串模板和回调函数两种形式。
		    },
		    toolbox: {//工具栏。内置有导出图片,数据视图,动态类型切换,数据区域缩放,重置五个工具。
		        show : true,
		        feature : {
		            mark : {show: true},
		            restore : {show: true},
		            saveAsImage : {show: true}
		        }
		    },
		    series : [//系列列表。每个系列通过 type 决定自己的图表类型
		        {
		            name:'速度',
		            type:'gauge',		   // 仪表盘
		            min: 0,                // 最小值
		            max: 100,       	   // 最大值
		            precision: 2,          // 小数精度,默认为0,无小数点
		            splitNumber: 10,       // 分割段数,默认为5
		            axisLine: {            // 轴线相关配置
		                lineStyle: {       // 轴线样式
		                    color: [[0.2, '#5FB878'], [0.8, '#01AAED'], [1, '#FF5722']], //轴线可以被分成不同颜色的多段,每段的结束位置和颜色可以通过一个数组来表示
		                    width: 50
		                }
		            },
		            axisTick: {            // 刻度样式
		                splitNumber: 10,   // 分隔线之间分割的刻度数
		                length :15,        // 刻度线长,支持相对半径的百分比
		                lineStyle: {       // 刻度线样式
		                    color: '#EEE'
		                }
		            },
		            axisLabel: {           // 刻度标签
		                textStyle: {       // 其余属性默认使用全局文本样式,详见TEXTSTYLE
		                    color: 'auto'
		                }
		            },
		            splitLine: {           // 分隔线样式
		                show: true,        // 默认显示,属性show控制显示与否
		                length :50,         // 分隔线线长,支持相对半径的百分比
		                lineStyle: {       // 分隔线条样式
		                    color: '#CCC'
		                }
		            },
		            pointer : {			  // 仪表盘指针
		                width : 10
		            },
		            title : {		     // 仪表盘标题
		                show : true,
		                offsetCenter: [0, '90%'],       // x, y,单位px
		                textStyle: {       // 其余属性默认使用全局文本样式,详见TEXTSTYLE
		                	color: 'rgba(255,255,255,0.7)',
		                    fontSize: 16,
		                    fontWeight: 'bolder'
		                }
		            },
		            detail : {		    // 仪表盘详情,用于显示数据
		                formatter:'{value}KM/H',
		                offsetCenter: [0, '56%'],
		                textStyle: {       // 其余属性默认使用全局文本样式,详见TEXTSTYLE
		                    color: 'auto',
		                    fontSize: 20,
		                    fontWeight: 'bolder'
		                }
		            },
		            data: [{value: 50, name: '速度'}]
		        }
		    ]
		};

        // 使用刚指定的配置项和数据显示图表,加个定时生成,让你的仪表盘动起来
        setInterval(function () {
		    option.series[0].data[0].value = (Math.random() * 100).toFixed(2) - 0;
		    myChart.setOption(option, true);
		},2000);
    script>
body>
html>
效果图

(4)多仪表盘
<html>
<head>
    <meta charset="utf-8">
    <title>EChartstitle>

    <script src="echarts.min.js">script>
head>
<body>

    <div id="main" style="width: 600px;height:400px;">div>
    <script type="text/javascript">
        // 基于准备好的dom,初始化echarts实例
        var myChart = echarts.init(document.getElementById('myChart'));

        // 指定图表的配置项和数据
        var option = {
		    backgroundColor: '#1b1b1b',
		    tooltip: {
		        formatter: '{a}
{c} {b}'
		    },
		    toolbox: {
		        show: true,
		        feature: {
		            mark: {show: true},
		            restore: {show: true},
		            saveAsImage: {show: true}
		        }
		    },
		    series: [
		        {
		            name: '速度',
		            type: 'gauge',
		            min: 0,
		            max: 220,
		            splitNumber: 11,
		            radius: '50%',
		            axisLine: {            // 坐标轴线
		                lineStyle: {       // 属性lineStyle控制线条样式
		                    color: [[0.09, 'lime'], [0.82, '#1e90ff'], [1, '#ff4500']],
		                    width: 3,
		                    shadowColor: '#fff', //默认透明
		                    shadowBlur: 10
		                }
		            },
		            axisLabel: {            // 坐标轴小标记
		                fontWeight: 'bolder',
		                color: '#fff',
		                shadowColor: '#fff', //默认透明
		                shadowBlur: 10
		            },
		            axisTick: {            // 坐标轴小标记
		                length: 15,        // 属性length控制线长
		                lineStyle: {       // 属性lineStyle控制线条样式
		                    color: 'auto',
		                    shadowColor: '#fff', //默认透明
		                    shadowBlur: 10
		                }
		            },
		            splitLine: {           // 分隔线
		                length: 25,         // 属性length控制线长
		                lineStyle: {       // 属性lineStyle(详见lineStyle)控制线条样式
		                    width: 3,
		                    color: '#fff',
		                    shadowColor: '#fff', //默认透明
		                    shadowBlur: 10
		                }
		            },
		            pointer: {           // 分隔线
		                shadowColor: '#fff', //默认透明
		                shadowBlur: 5
		            },
		            title: {
		                textStyle: {       // 其余属性默认使用全局文本样式,详见TEXTSTYLE
		                    fontWeight: 'bolder',
		                    fontSize: 20,
		                    fontStyle: 'italic',
		                    color: '#fff',
		                    shadowColor: '#fff', //默认透明
		                    shadowBlur: 10
		                }
		            },
		            detail: {
		                backgroundColor: 'rgba(30,144,255,0.8)',
		                borderWidth: 1,
		                borderColor: '#fff',
		                shadowColor: '#fff', //默认透明
		                shadowBlur: 5,
		                offsetCenter: [0, '50%'],       // x, y,单位px
		                textStyle: {       // 其余属性默认使用全局文本样式,详见TEXTSTYLE
		                    fontWeight: 'bolder',
		                    color: '#fff'
		                }
		            },
		            data: [{value: 40, name: 'km/h'}]
		        },
		        {
		            name: '转速',
		            type: 'gauge',
		            center: ['25%', '55%'],    // 默认全局居中
		            radius: '30%',
		            min: 0,
		            max: 7,
		            endAngle: 45,
		            splitNumber: 7,
		            axisLine: {            // 坐标轴线
		                lineStyle: {       // 属性lineStyle控制线条样式
		                    color: [[0.29, 'lime'], [0.86, '#1e90ff'], [1, '#ff4500']],
		                    width: 2,
		                    shadowColor: '#fff', //默认透明
		                    shadowBlur: 10
		                }
		            },
		            axisLabel: {            // 坐标轴小标记
		                fontWeight: 'bolder',
		                color: '#fff',
		                shadowColor: '#fff', //默认透明
		                shadowBlur: 10
		            },
		            axisTick: {            // 坐标轴小标记
		                length: 12,        // 属性length控制线长
		                lineStyle: {       // 属性lineStyle控制线条样式
		                    color: 'auto',
		                    shadowColor: '#fff', //默认透明
		                    shadowBlur: 10
		                }
		            },
		            splitLine: {           // 分隔线
		                length: 20,         // 属性length控制线长
		                lineStyle: {       // 属性lineStyle(详见lineStyle)控制线条样式
		                    width: 3,
		                    color: '#fff',
		                    shadowColor: '#fff', //默认透明
		                    shadowBlur: 10
		                }
		            },
		            pointer: {
		                width: 5,
		                shadowColor: '#fff', //默认透明
		                shadowBlur: 5
		            },
		            title: {
		                offsetCenter: [0, '-30%'],       // x, y,单位px
		                textStyle: {       // 其余属性默认使用全局文本样式,详见TEXTSTYLE
		                    fontWeight: 'bolder',
		                    fontStyle: 'italic',
		                    color: '#fff',
		                    shadowColor: '#fff', //默认透明
		                    shadowBlur: 10
		                }
		            },
		            detail: {
		                //backgroundColor: 'rgba(30,144,255,0.8)',
		                // borderWidth: 1,
		                borderColor: '#fff',
		                shadowColor: '#fff', //默认透明
		                shadowBlur: 5,
		                width: 80,
		                height: 30,
		                offsetCenter: [25, '20%'],       // x, y,单位px
		                textStyle: {       // 其余属性默认使用全局文本样式,详见TEXTSTYLE
		                    fontWeight: 'bolder',
		                    color: '#fff'
		                }
		            },
		            data: [{value: 1.5, name: 'x1000 r/min'}]
		        },
		        {
		            name: '油表',
		            type: 'gauge',
		            center: ['75%', '50%'],    // 默认全局居中
		            radius: '30%',
		            min: 0,
		            max: 2,
		            startAngle: 135,
		            endAngle: 45,
		            splitNumber: 2,
		            axisLine: {            // 坐标轴线
		                lineStyle: {       // 属性lineStyle控制线条样式
		                    color: [[0.2, 'lime'], [0.8, '#1e90ff'], [1, '#ff4500']],
		                    width: 2,
		                    shadowColor: '#fff', //默认透明
		                    shadowBlur: 10
		                }
		            },
		            axisTick: {            // 坐标轴小标记
		                length: 12,        // 属性length控制线长
		                lineStyle: {       // 属性lineStyle控制线条样式
		                    color: 'auto',
		                    shadowColor: '#fff', //默认透明
		                    shadowBlur: 10
		                }
		            },
		            axisLabel: {
		                fontWeight: 'bolder',
		                color: '#fff',
		                shadowColor: '#fff', //默认透明
		                shadowBlur: 10,
		                formatter: function (v){
		                    switch (v + '') {
		                        case '0': return 'E';
		                        case '1': return 'Gas';
		                        case '2': return 'F';
		                    }
		                }
		            },
		            splitLine: {           // 分隔线
		                length:15,         // 属性length控制线长
		                lineStyle: {       // 属性lineStyle(详见lineStyle)控制线条样式
		                    width:3,
		                    color: '#fff',
		                    shadowColor: '#fff', //默认透明
		                    shadowBlur: 10
		                }
		            },
		            pointer: {
		                width:2,
		                shadowColor: '#fff', //默认透明
		                shadowBlur: 5
		            },
		            title: {
		                show: false
		            },
		            detail: {
		                show: false
		            },
		            data: [{value: 0.5, name: 'gas'}]
		        },
		        {
		            name: '水表',
		            type: 'gauge',
		            center: ['75%', '50%'],    // 默认全局居中
		            radius: '30%',
		            min: 0,
		            max: 2,
		            startAngle: 315,
		            endAngle: 225,
		            splitNumber: 2,
		            axisLine: {            // 坐标轴线
		                lineStyle: {       // 属性lineStyle控制线条样式
		                    color: [[0.2, 'lime'], [0.8, '#1e90ff'], [1, '#ff4500']],
		                    width: 2,
		                    shadowColor: '#fff', //默认透明
		                    shadowBlur: 10
		                }
		            },
		            axisTick: {            // 坐标轴小标记
		                show: false
		            },
		            axisLabel: {
		                fontWeight: 'bolder',
		                color: '#fff',
		                shadowColor: '#fff', //默认透明
		                shadowBlur: 10,
		                formatter: function(v){
		                    switch (v + '') {
		                        case '0': return 'H';
		                        case '1': return 'Water';
		                        case '2': return 'C';
		                    }
		                }
		            },
		            splitLine: {           // 分隔线
		                length: 15,         // 属性length控制线长
		                lineStyle: {       // 属性lineStyle(详见lineStyle)控制线条样式
		                    width: 3,
		                    color: '#fff',
		                    shadowColor: '#fff', //默认透明
		                    shadowBlur: 10
		                }
		            },
		            pointer: {
		                width: 2,
		                shadowColor: '#fff', //默认透明
		                shadowBlur: 5
		            },
		            title: {
		                show: false
		            },
		            detail: {
		                show: false
		            },
		            data:[{value: 0.5, name: 'gas'}]
		        }
		    ]
		};

		setInterval(function (){
		    option.series[0].data[0].value = (Math.random()*100).toFixed(2) - 0;
		    option.series[1].data[0].value = (Math.random()*7).toFixed(2) - 0;
		    option.series[2].data[0].value = (Math.random()*2).toFixed(2) - 0;
		    option.series[3].data[0].value = (Math.random()*2).toFixed(2) - 0;
		    myChart.setOption(option);
		},2000);
    script>
body>
html>
效果图
四. 后记
其实用起来也简单,根据自己的显示需求,遇到不懂的时候多查看官方文档就好了。
附官方文档链接