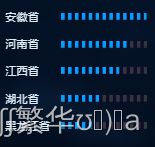
          <div v-for="(item, index) in process" :key="index">
            <Process v-if="item" :data="item">Process>
          div>
this.process.forEach((item, index) => {
if (item.Count < 1000) {
item.total = 1000;
} else if (1000 < item.Count && item.Count < 5000) {
item.total = 5000;
} else if (5000 < item.Count) {
item.total = 800000;
}
item.id = index;
});
<template>
<div class="wrap">
<div class="item">
<div class="name">
{{ data.name }}
div>
<div class="process" :id="`process${data.id}`">div>
<div class="processNum">{{ data.count }}div>
div>
div>
template>
<script>
export default {
data() {
return {};
},
props: {
data: {
type: Object,
default: {},
},
},
watch: {
"data.count": function (val, oldval) {
this.echarts1();
},
},
mounted() {
this.echarts1();
},
methods: {
echarts1() {
const chart = this.$echarts.init(
document.getElementById(`process${this.data.id}`)
);
var colorList = [];
colorList[0] = new this.$echarts.graphic.LinearGradient(0, 0, 1, 0, [
{ offset: 0, color: "#02A0FF" },
{ offset: 0.5, color: "#02A0FF" },
{ offset: 1, color: "#02A0FF" },
]);
let option = {
grid: {
top: "-1%",
left: "0%",
right: "0%",
bottom: "4%",
containLabel: true,
},
xAxis: {
type: "value",
splitLine: {
show: false,
},
offset: 10,
axisTick: {
show: false,
},
axisLine: {
show: false,
},
axisLabel: {
show: false,
},
},
yAxis: {
type: "category",
inverse: true,
axisLine: {
show: false,
},
axisTick: {
show: false,
},
axisLabel: {
inside: true,
},
data: [""],
},
series: [
{
name: "2022年",
type: "bar",
barWidth: "10px",
itemStyle: {
normal: {
color: function (params) {
return colorList[params.dataIndex];
},
},
},
label: {
show: true,
position: "center",
offset: [-18, -2],
fontSize: 12,
color: "#fff",
formatter: "",
},
z: 9999,
data: [this.data.count || this.data.accurateCount],
},
{
type: "bar",
barWidth: "10px",
barGap: "-100%",
z: 99,
itemStyle: {
normal: {
color: "#30373f",
},
},
label: {
show: true,
position: "insideBottomLeft",
offset: [-126, 8],
fontSize: 15,
color: "#caced1",
formatter: "{b}",
},
data: [this.data.total],
},
{
type: "pictorialBar",
itemStyle: {
normal: {
color: "#100c29",
},
},
symbolRepeat: "fixed",
symbolMargin: 2,
symbol: "rect",
symbolClip: true,
symbolSize: [4, 10],
symbolPosition: "start",
symbolOffset: [-4, 0],
data: [this.data.total],
width: 25,
z: 0,
zlevel: 1,
},
],
};
chart.setOption(option);
},
},
};
script>
<style scoped>
.wrap {
height: 100%;
color: #ddebf6;
}
.item {
display: flex;
align-items: center;
}
.name {
width: 65px;
font-size: 13px;
font-family: SourceHanSansCN-Regular, SourceHanSansCN;
line-height: 24px;
overflow: hidden;
text-overflow: ellipsis;
white-space: nowrap;
}
.process {
width: 100px;
height: 8px;
}
.processNum {
margin-left: 10px;
}
style>
