Matplotlib | 高阶绘图案例【3】- 五大战区高校排名
文章目录
- ️ 1. 导入模块
- ️ 2. 数据处理
-
- 2.1 高效数据
- 2.2 学校排名
- ️ 3. 绘图
-
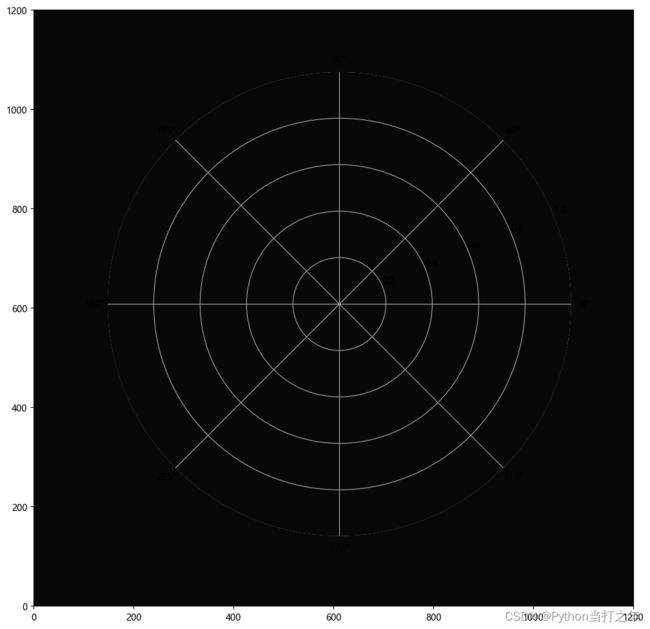
- 3.1 绘制图布,设置极坐标系
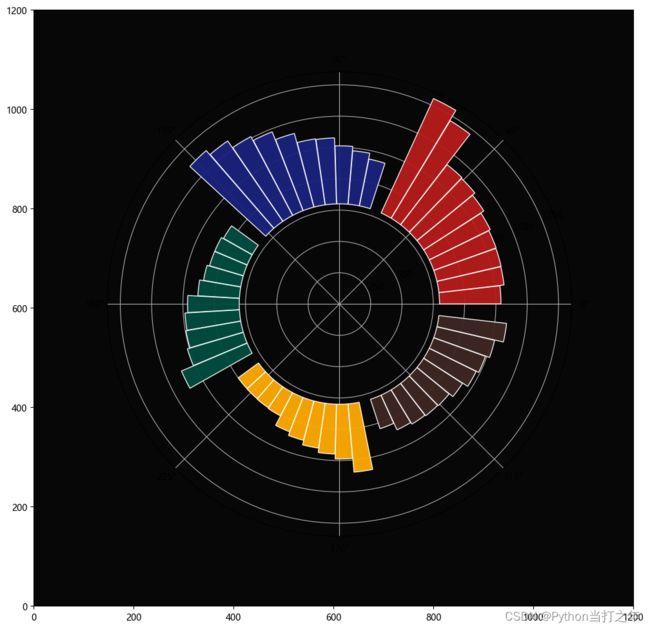
- 3.2 绘制学校排名柱状图
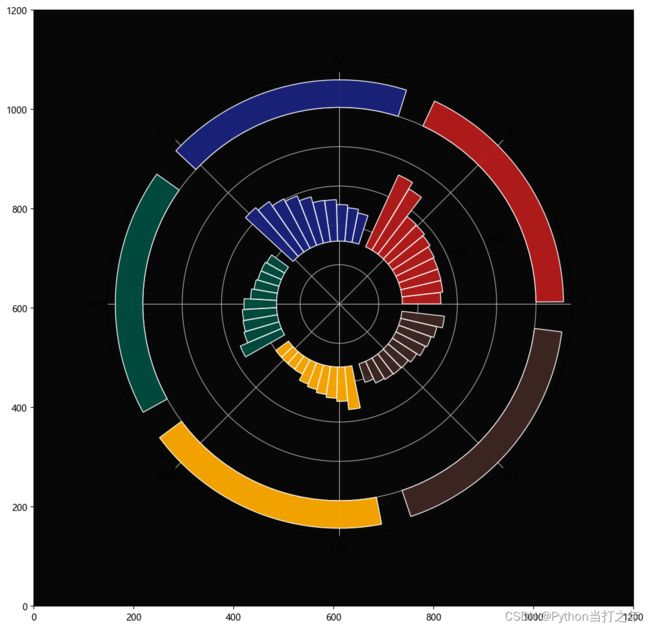
- 3.3 绘制五大战区扇形区域
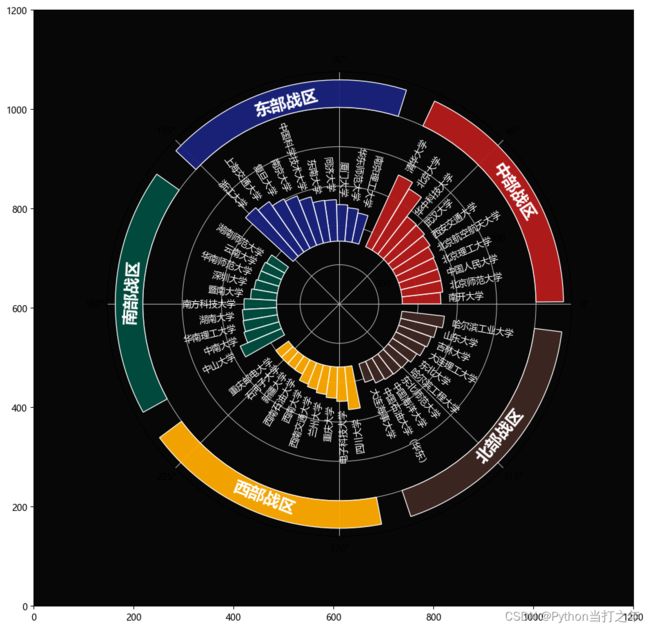
- 3.4 添加战区、学校文本
- 3.5 前三学校高亮
- 3.6 添加标题
- 3.7 添加注释
- ️ 4. 在线运行地址
- ️ 5. 可视化项目源码+数据
大家好,我是 【Python当打之年(点击跳转)】
本期是 Matplotlib高阶绘图案例系列 的第 3 期, Matplotlib系列和Pyecharts系列都会不间断更新,希望对大家有所帮助,如有疑问或者需要改进的地方可以联系小编。
往期:
Matplotlib | 高阶绘图案例【2】
Matplotlib | 高阶绘图案例【1】
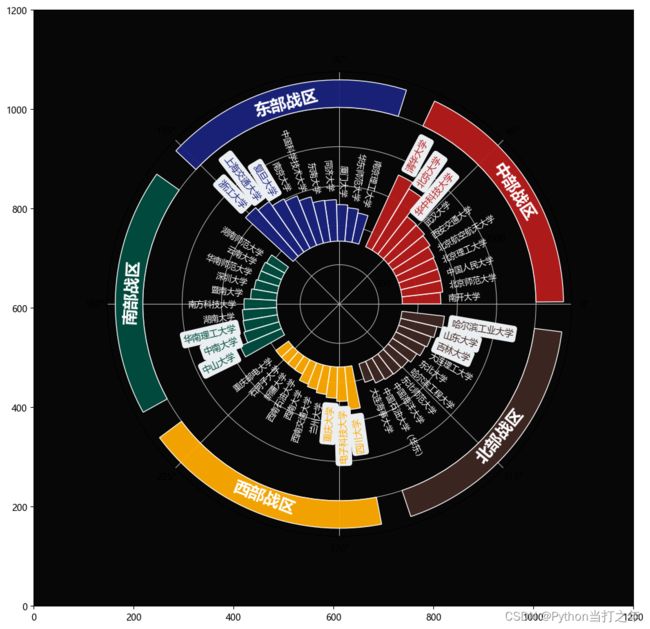
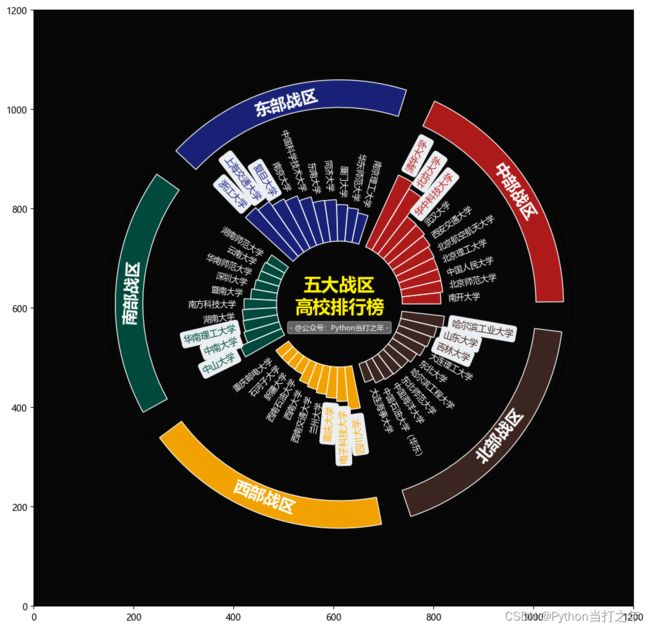
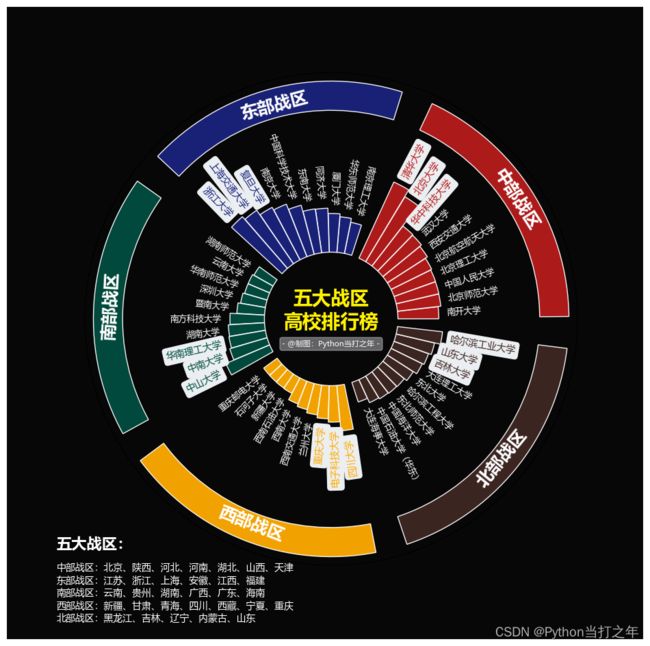
先看看效果:
️ 1. 导入模块
import numpy as np
import pandas as pd
import funcy as fc
import matplotlib.pyplot as plt
import warnings
warnings.filterwarnings('ignore')
plt.rcParams['font.family'] = ['Microsoft YaHei']
️ 2. 数据处理
2.1 高效数据
数据获取部分见:Pandas+Pyecharts | 2023软科中国大学排名分析可视化
df = pd.read_excel('./中国大学综合排名2023.xlsx')
2.2 学校排名
area_dict = {
    '中部战区':['北京','陕西','河北','河南','湖北','山西','天津'],
    '东部战区':['江苏','浙江','上海','安徽','江西','福建'],
    '南部战区':['云南','贵州','湖南','广西','广东','海南'],
    '西部战区':['新疆','甘肃','青海','四川','西藏','宁夏','重庆'],
    '北部战区':['黑龙江','吉林','辽宁','内蒙古','山东'],
}

def dealdatas(data):
    for key,value in area_dict.items():
        if data in value:
            return key
    return ''

df['战区'] = df['地区'].apply(dealdatas)
all_score_datas = []
all_colls = []
for key in area_dict.keys():
    df_tmp = df[df['战区'] == key]
    df_tmp = df_tmp.sort_values('评分',ascending=False)[:10]
    all_score_datas.append(df_tmp['评分'].tolist())
    all_colls.append(df_tmp['学校名称'].tolist())
️ 3. 绘图
3.1 绘制图布,设置极坐标系
fig, ax = plt.subplots(figsize=(12, 12),dpi=100)
ax.set_xlim(0,1200)
ax.set_ylim(0,1200)
ax.set_facecolor('#080708')
ax1 = fig.add_axes([0.22, 0.2, 0.6, 0.6], polar=True,facecolor='#080708')
plt.show()
3.2 绘制学校排名柱状图
num = 0
for i in range(0,55,11):
    # 学校数据
    data_tmp = all_score_datas[num][::-1]
    for idx, group in enumerate(fc.pairwise(theta_group_tmp)):
        theta = (group[0] + group[1]) / 2
        ax1.bar(theta, data_tmp[idx], width=[np.pi / 28], bottom=800,
                facecolor=colors1[num], edgecolor='white', linewidth=1, alpha=0.95, zorder=9)
    num += 1
3.3 绘制五大战区扇形区域
theta = (theta_group_tmp[0]+theta_group_tmp[-1])/2
ax1.bar(theta, 350, width=[np.pi / 2.8], bottom=2500,edgecolor='white', linewidth=1, alpha=0.95, zorder=9)
plt.show()
3.4 添加战区、学校文本
# 战区
ax1.annotate(list(area_dict.keys()), xy=[theta, 2640], va='center', ha='center',
                 zorder=10, rotation=angle,fontsize=18,color='w', fontweight='bold')
# 学校
ax1.text(theta, data_tmp[idx]+900,coll_tmp[idx],fontsize=10,color='w',rotation=angle,rotation_mode='anchor',
                zorder=10,va="center", ha="left" if num < 1 or num > 3  else 'right')
plt.show()
3.5 前三学校高亮
# 学校
ax1.text(theta, data_tmp[idx]+900,coll_tmp[idx],fontsize=10,color='w',rotation=angle,rotation_mode='anchor',
                zorder=10,va="center", ha="left" if num < 1 or num > 3  else 'right')
plt.show()
3.6 添加标题
ax1.text(np.pi/2, 100,'五大战区\n高校排行榜',fontsize=20,color='#fff200', va="center", ha="center", fontweight='heavy' )
ax1.text(-np.pi/2, 300,'- @公众号:Python当打之年 -',fontsize=8,color='w', va="center", ha="center",bbox=dict(boxstyle="round", fc="#ECEFF1", ec="#ECEFF1", alpha=0.4) )
plt.show()
3.7 添加注释
ax1.text(-np.pi*3/4, 4650,'\n'.join(text_tmp),fontsize=10,color='w',va="center", ha="left")
ax1.text(-(np.pi*3.1)/4, 4330,'五大战区:\n',fontsize=16,color='w',ha="left", va="center", fontweight='heavy')
plt.show()
️ 4. 在线运行地址
在线运行地址(全部代码):
https://www.heywhale.com/mw/project/64fe79d7048d25fc8d80fef3
️ 5. 可视化项目源码+数据
点击跳转:【全部可视化项目源码+数据】
以上就是本期为大家整理的全部内容了,赶快练习起来吧,原创不易,喜欢的朋友可以点赞、收藏也可以分享(注明出处)让更多人知道。


