echarts的柱状图的重叠和堆叠实现两个柱体的显示和之前的差值显示
主要思路
准备三个柱体(原计划,实际进度,差值)
原计划和实际进度设置成重叠
          {
            barWidth: 20,
            // yAxisIndex: 1,
            z: 1,
            name: '原计划',
            type: 'bar',
            stack: 'ab',
            emphasis: { // 点击柱体其他柱体颜色会变浅
              disabled: true
            },
            label: {
              show: true
            },
            itemStyle: {
              emphasis: {
                barBorderRadius: 10
              },
              normal: {
                barBorderRadius: 10
              }
            },
            data: this.planProcessData.map((item) => {
              return {
                value: item,
                label: {
                  show: !(item < 10),
                  formatter: item + '%',
                  position: 'insideRight',
                  textStyle: {
                    color: '#262626',
                    fontSize: 12
                  }
                }
              }
            })
          },
 {
            barGap: '-100%', /* 可以重叠*/
            barWidth: 20,
            yAxisIndex: 0,
            z: 2,
            itemStyle: {
              emphasis: {
                barBorderRadius: 10
              },
              normal: {
                barBorderRadius: 10
              }
            },
            data: this.realityProcessData.map((item) => {
              return {
                value: item,
                label: {
                  show: true,
                  formatter: item + '%',
                  position: item < 10 ? 'right' : 'insideRight',
                  textStyle: {
                    color: '#262626',
                    fontSize: 12
                  }
                }
              }
            }),
            type: 'bar',
            label: {
              show: true
            },
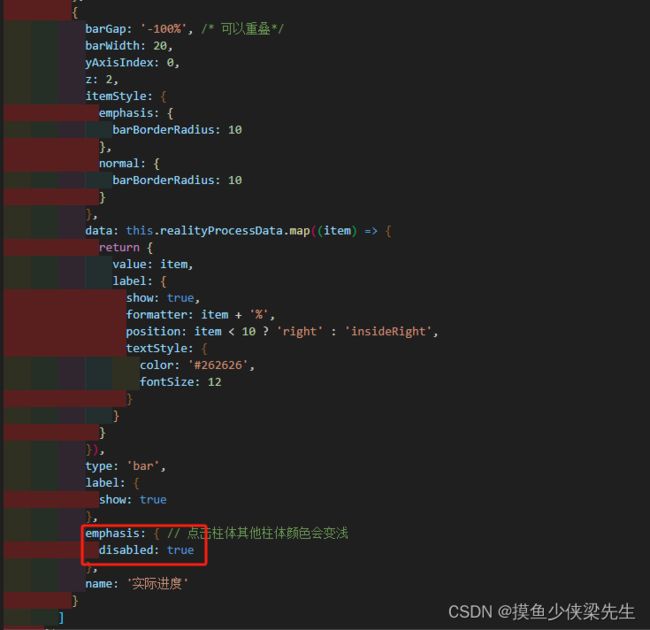
            emphasis: { // 点击柱体其他柱体颜色会变浅
              disabled: true
            },
            name: '实际进度'
          }
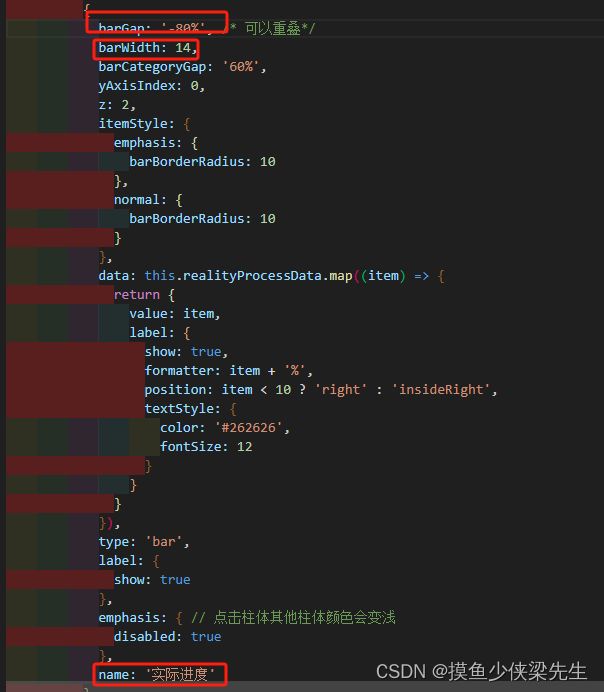
将实际进度的 barGap: ‘-100%’, 就可以重叠啦
然后设置差值柱体
{
            barWidth: 20,
            // yAxisIndex: 1,
            z: 1,
            stack: 'ab', // 这个保持一样就可以堆叠
            data: this.differenceData.map((item) => {
              return {
                value: item,
                label: {
                  show: true,
                  formatter: (params) => { // 核心部分 formatter 可以为字符串也可以是回调
                    // var that = this
                    // console.log('0904', this.differenceData)
                    if (params.value) { // 如果当前值存在则拼接
                      return '↓' + ' ' + '-' + params.value + '%'
                    } else { // 否则返回个空
                      return ''
                    }
                  },
                  position: 'insideLeft',
                  textStyle: {
                    color: '#E20000',
                    fontSize: 12
                  }
                }
              }
            }),
            type: 'bar',
            emphasis: { // 点击柱体其他柱体颜色会变浅
              disabled: true
            },
            label: {
              show: true
            },
            name: '差值'
          },
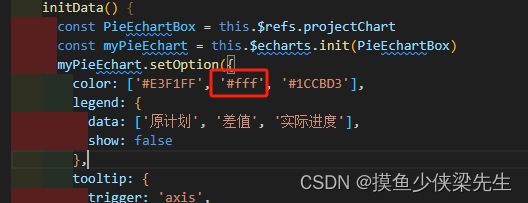
要使差值跟原计划堆叠,他们要是设置 stack: ‘ab’, 这个保持一样就可以堆叠,然后将差值柱体的背景颜色白色
然后将显示的值的位置position改为insideLeft

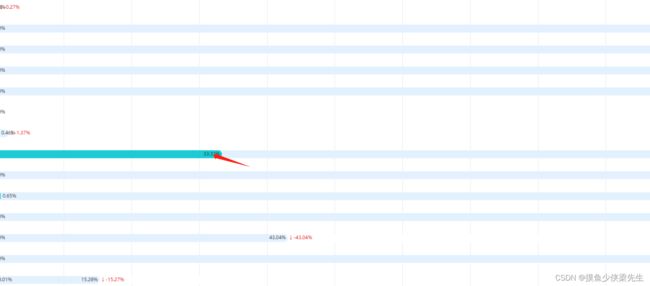
就可以实现上面的效果啦
3.要是重叠的两个柱体不完全重叠
4.设置最大度是100%,但是内容可以超过
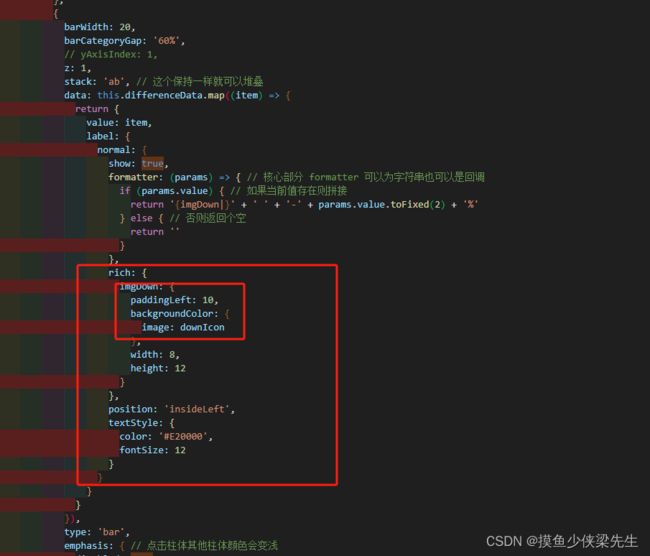
5.在series中,在formatter,自定义图片
补充
1.如果你想在这里使用this,一定要弄箭头函数
2.如果你想要鼠标移到柱体上去,其他一些柱体不会透明
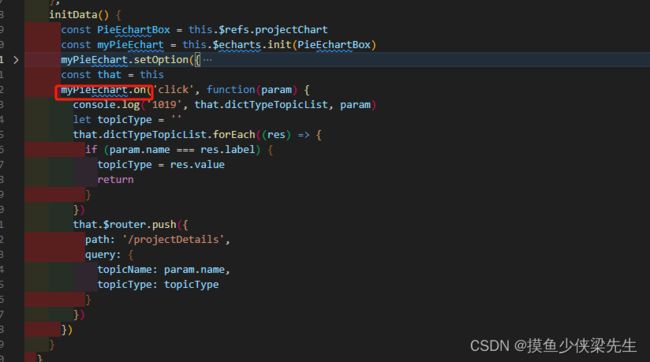
3.给柱状图添加点击事件
点击事件函数里面也是不能直接获取到this,需要let that = this
完整代码
initData() {
      const PieEchartBox = this.$refs.projectChart
      const myPieEchart = this.$echarts.init(PieEchartBox)
      myPieEchart.setOption({
        color: ['#E3F1FF', '#fff', '#1CCBD3'],
        legend: {
          data: ['原计划', '差值', '实际进度'],
          show: false
        },
        tooltip: {
          trigger: 'axis',
          extraCssText: 'width:200px',
          valueFormatter: function(value) { // 里面的值加内容
            return value + '%'
          },
          axisPointer: {
            type: 'shadow'
          },
          formatter: "" + '{b}' + '' +
                                "" + '' + '{a0}' + '{c0}%' +
                                "" + '' + '{a2}' + '{c2}%'
        },
        grid: {
          left: '10',
          right: '6%',
          bottom: '3%',
          top: '2%',
          containLabel: true
        },
        yAxis: [{
          type: 'category',
          axisTick: {
            length: 10
          },
          axisLine: 'none',
          data: this.topicNameData,
          axisLabel: {
            margin: 10,
            interval: 0,
            lineHeight: 14,
            textStyle: {
              fontSize: 12,
              color: '#666666'
            },
            formatter: function(value) {
              var ret = ''// 拼接加\n返回的类目项
              var valLength = value.length// X轴类目项的文字个数
              var maxLength = 10 // 每项显示文字个数
              var rowN = Math.ceil(valLength / maxLength) // 类目项需要换行的行数
              if (rowN > 1) { // / 如果类目项的文字大于3,
                for (var i = 0; i < rowN && i < 2; i++) {
                  var temp = ''// 每次截取的字符串
                  var end = ''
                  var start = i * maxLength// 开始截取的位置
                  if (i === 1 && valLength > 20) {
                    end = start + 9// 结束截取的位置
                  } else {
                    end = start + maxLength// 结束截取的位置
                  }
                  // 这里也可以加一个是否是最后一行的判断,但是不加也没有影响,那就不加吧
                  if (i === 1 && valLength > 20) {
                    temp = value.substring(start, end) + '...'// 结束截取的位置
                  } else {
                    temp = value.substring(start, end) + '\n'// 结束截取的位置
                  }
                  ret += temp // 凭借最终的字符串
                }
                return ret
              } else {
                return value
              }
            }
          }
        },
        {
          show: false,
          type: 'category',
          axisTick: 'none',
          data: [],
          axisLine: 'none'
        }],
        xAxis: {
          type: 'value',
          interval: 10,
          max: 100.001, // 为了然差值显示出来
          axisLabel: {
            show: true,
            textStyle: {
              fontSize: 10
            },
            itemWidth: 123,
            formatter: '{value}%' // 给Y轴数值添加百分号
          },
          position: 'top'
        },

        series: [
          {
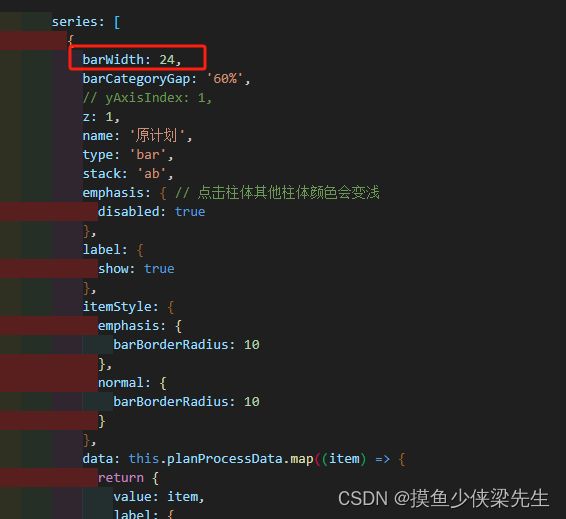
            barWidth: 24,
            barCategoryGap: '60%',
            // yAxisIndex: 1,
            z: 1,
            name: '原计划',
            type: 'bar',
            stack: 'ab',
            emphasis: { // 点击柱体其他柱体颜色会变浅
              disabled: true
            },
            label: {
              show: true
            },
            itemStyle: {
              emphasis: {
                barBorderRadius: 10
              },
              normal: {
                barBorderRadius: 10
              }
            },
            data: this.planProcessData.map((item) => {
              return {
                value: item,
                label: {
                  show: !(item < 10),
                  formatter: item + '%',
                  position: 'insideRight',
                  textStyle: {
                    color: '#262626',
                    fontSize: 12
                  }
                }
              }
            })
          },
          {
            barWidth: 20,
            barCategoryGap: '60%',
            // yAxisIndex: 1,
            z: 1,
            stack: 'ab', // 这个保持一样就可以堆叠
            data: this.differenceData.map((item) => {
              return {
                value: item,
                label: {
                  normal: {
                    show: true,
                    formatter: (params) => { // 核心部分 formatter 可以为字符串也可以是回调
                      if (params.value) { // 如果当前值存在则拼接
                        return '{imgDown|}' + ' ' + '-' + params.value.toFixed(2) + '%'
                      } else { // 否则返回个空
                        return ''
                      }
                    },
                    rich: {
                      imgDown: {
                        paddingLeft: 10,
                        backgroundColor: {
                          image: downIcon
                        },
                        width: 8,
                        height: 12
                      }
                    },
                    position: 'insideLeft',
                    textStyle: {
                      color: '#E20000',
                      fontSize: 12
                    }
                  }
                }
              }
            }),
            type: 'bar',
            emphasis: { // 点击柱体其他柱体颜色会变浅
              disabled: true
            },
            label: {
              show: true
            },
            name: '差值'
          },
          {
            barGap: '-80%', /* 可以重叠*/
            barWidth: 14,
            barCategoryGap: '60%',
            yAxisIndex: 0,
            z: 2,
            itemStyle: {
              emphasis: {
                barBorderRadius: 10
              },
              normal: {
                barBorderRadius: 10
              }
            },
            data: this.realityProcessData.map((item) => {
              return {
                value: item,
                label: {
                  show: true,
                  formatter: item + '%',
                  position: item < 10 ? 'right' : 'insideRight',
                  textStyle: {
                    color: '#262626',
                    fontSize: 12
                  }
                }
              }
            }),
            type: 'bar',
            label: {
              show: true
            },
            emphasis: { // 点击柱体其他柱体颜色会变浅
              disabled: true
            },
            name: '实际进度'
          }
        ]
      })
      const that = this
      myPieEchart.on('click', function(param) {
        console.log('1019', that.dictTypeTopicList, param)
        let topicType = ''
        that.dictTypeTopicList.forEach((res) => {
          if (param.name === res.label) {
            topicType = res.value
            return
          }
        })
        that.$router.push({
          path: '/projectDetails',
          query: {
            topicName: param.name,
            topicType: topicType
          }
        })
      })
    }


